. 2024 Oct;11(39):e2400107.
doi: 10.1002/advs.202400107. Epub 2024 Sep 5.

FGF12 Positively Regulates Keratinocyte Proliferation by Stabilizing MDM2 and Inhibiting p53 Activity in Psoriasis

Affiliations

FGF12 Positively Regulates Keratinocyte Proliferation by Stabilizing MDM2 and Inhibiting p53 Activity in Psoriasis

Nan Wang et al. Adv Sci (Weinh). 2024 Oct.

Abstract

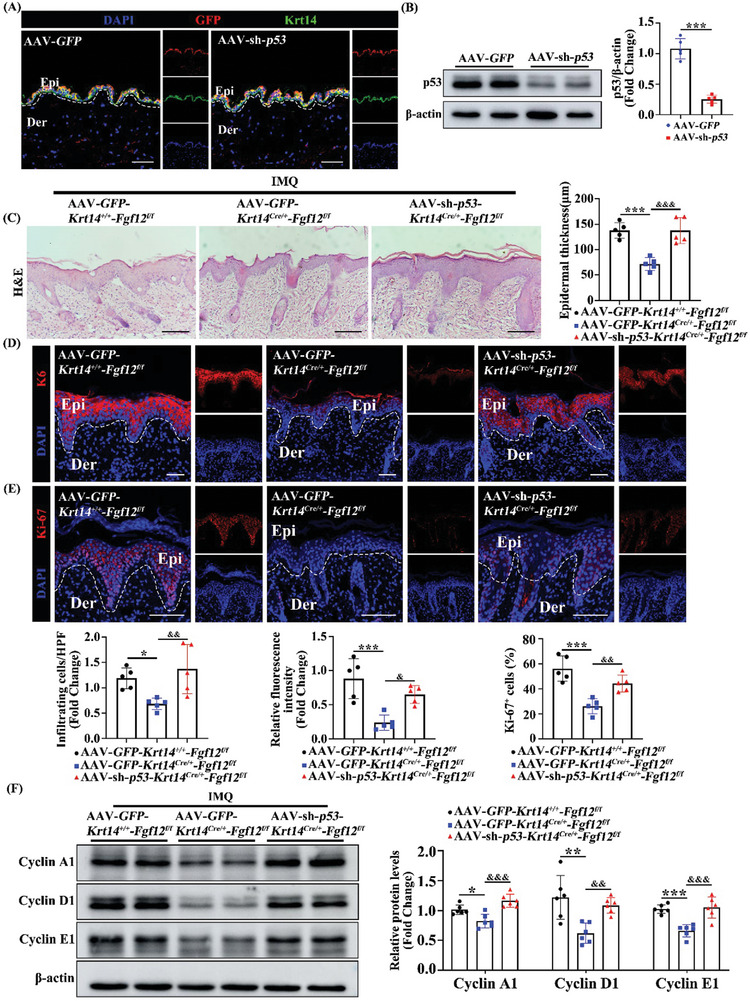
Psoriasis is a chronic skin disease characterized by abnormal proliferation and inflammation of epidermal keratinocytes. Fibroblast growth factor 12 (FGF12) is implicated in the regulation of diverse cellular signals; however, its precise mechanism in psoriasis requires further investigation. In this study, high expression of FGF12 is observed in the epidermis of skin lesion in psoriasis patients and imiquimod (IMQ)-induced psoriasis like-dermatitis. Moreover, specific loss of FGF12 in keratinocytes in IMQ-induced psoriasis model alleviates psoriasis-like symptoms and reduces proliferation. In vitro RNA sequencing demonstrates that knockdown of FGF12 effectively arrests the cell cycle, inhibits cell proliferation, and predominantly regulates the p53 signaling pathway. Mechanistically, FGF12 is selectively bound to the RING domain of MDM2, thus partially inhibiting the binding of β-Trcp to MDM2. This interaction inhibits β-Trcp-induced-K48 ubiquitination degradation of MDM2, thereby suppressing the activity of the p53 signaling pathway, which results in excessive cell proliferation. Last, the alleviatory effect of FGF12 deficiency on psoriasis progression is reversed by p53 knockdown. In summary, these findings provide valuable insights into the mechanisms by which FGF12 suppresses p53 signaling in keratinocytes, exacerbating the development of psoriasis. This positive regulatory loop highlights the potential of FGF12 as a therapeutic target to manage psoriasis.

Keywords: FGF12; MDMD2; p53; proliferation; psoriasis.


Conflict of interest statement

The authors declare no conflict of interest.

Figures

Figure 1
Figure 1
FGF12 is upregulated in the epidermis of patients with psoriasis and IMQ‐induced mouse model. A) The mRNA level of Fgf12 in the skin from non‐lesion skin and lesion skin of psoriasis patients was analyzed using the Gene Expression Omnibus (GEO) database. B) Immunofluorescent and quantitative analysis of FGF12 in the skin from healthy controls and psoriatic patients. Nuclei were stained with DAPI (blue) (n = 5). Scale bar = 200 µm. C) Immunofluorescent and quantitative analysis of FGF12 in the skin from Vaseline and IMQ‐mice. Nuclei were stained with DAPI (blue) (n = 5). Scale bar = 100 µm. D) Immunoblotting and quantitative analysis of FGF12 expression in the skin from Vaseline and IMQ‐mice. β‐Actin was used as a loading control (n = 5). E) Immunoblotting and quantitative analysis of FGF12 protein level in NHEK cells that were treated with PBS or M5 for 12 h. β‐Actin was used as a loading control (n = 5). Error bars show the mean ± SEM. *p < 0.05; ***p < 0.001. The p value was determined using two‐tailed unpaired Student's t test (A – E). All numbers (n) are biologically independent experiments.
Figure 2
Figure 2
FGF12 ablation in keratinocytes ameliorates the psoriasiform phenotype. A) Representative images of the dorsal back from mice, and mice PASI scores were depicted (n = 5). B) Representative histological sections of the dorsal back from Krt14+/+‐Fgf12f/f and Krt14Cre/+‐Fgf12f/f mice treated by Vaseline or IMQ for 9 days stained with H&E, and quantification of the epidermal thickness and the infiltrating cells (n = 5). Scale bars = 100 µm. C) Immunoblotting analysis of Cyclin A1, Cyclin D1, and Cyclin E1 protein levels in Krt14+/+‐Fgf12f/f and Krt14Cre/+‐Fgf12f/f mice were treated with Vaseline or IMQ for 9 days. β‐Actin was used as a loading control (n = 6). D) Immunofluorescent and quantitative analysis of Ki‐67 positive cells in the skin from Krt14+/+‐Fgf12f/f and Krt14Cre/+‐Fgf12f/f mice were treated with Vaseline or IMQ for 9 days. Nuclei were stained with DAPI (blue) (n = 5). Scale bar = 100 µm. E) Immunofluorescent and quantitative analysis of K6 in the skin from Krt14+/+‐Fgf12f/f and Krt14Cre/+‐Fgf12f/f mice were treated with Vaseline or IMQ for 9 days. Nuclei were stained with DAPI (blue) (n = 5). Scale bar = 100 µm. F) qRT‐PCR analysis for IL‐17, CCL2, CXCL2, S100A8 and IL‐1β mRNA levels in the skin from Krt14+/+‐Fgf12f/f and Krt14Cre/+‐Fgf12f/f mice were treated with IMQ for 9 days (n = 5). Error bars show the mean ± SEM. **p < 0.01; ***p < 0.001. &&& p < 0.001. The p value was determined using two‐tailed unpaired Student's t test (A and F) or one‐way ANOVA (B‐E). All numbers (n) are biologically independent experiments.
Figure 3
Figure 3
FGF12 is required for proliferation and cell cycle transition of keratinocytes. A) RNA‐Sequence analyzes the differentially regulated genes between si‐Scr group and si‐Fgf12 group treated with M5 for 12 h. Chord diagram showing the top 20 enriched GO clusters. B) Immunoblotting and quantitative analysis of FGF12 protein level in NHEK cells that were transfected with si‐Scr or si‐Fgf12. β‐Actin was used as a loading control (n = 5). C) Immunoblotting and quantitative analysis of Cyclin A1, Cyclin D1, and Cyclin E1 protein levels in NHEK cells that were treated with si‐Scr or si‐Fgf12 and stimulated with or without M5 for 12 h. β‐Actin was used as a loading control (n = 4). D) Immunofluorescent and quantitative analysis of Ki‐67+ in NHEK cells that were treated with si‐Scr or si‐Fgf12 and stimulated with or without M5 for 12 h (n = 5). Scale bar = 50 µm. E) Immunofluorescent and quantitative analysis of EdU+ in HaCaT cells that were treated with si‐Scr or si‐Fgf12 and stimulated with or without M5 for 12 h. Nuclei were stained with Hoechst (blue) (n = 5). Scale bar = 50 µm. F) Flow cytometric plots of cell‐cycle analysis performed with PI staining on HaCaT cells treated with si‐Scr or si‐Fgf12 and stimulated with or without M5 for 12 h (left). Quantification the percentage of cells that fall into the sub G0/G1, S, or G2/M gates (right) (n = 5). Error bars show the mean ± SEM. *p < 0.05; **p < 0.01; ***p < 0.001. &p < 0.05; &&p < 0.01; &&& p < 0.001. The p value was determined using two‐tailed unpaired Student's t test (B) or one‐way ANOVA (C‐F). All numbers (n) are biologically independent experiments.
Figure 4
Figure 4
FGF12 promotes proliferation and cell cycle transition of keratinocytes through p53 signaling. A–C) KEGG analysis for the significantly upregulated signaling by the interference of si‐Scr or si‐Fgf12 in HaCaT cells treated by M5 for 12 h. The Top 15 upregulated GO signal pathways were listed. D) GSEA showing the significant enrichment of p53 signaling in M5 treated HaCaT cells under FGF12 interference. E) Immunoblotting and quantitative analysis of p53 and p21 protein levels in NHEK cells that were treated with si‐Scr or si‐Fgf12 and stimulated with M5 for 12 h. β‐Actin was used as a loading control (n = 4). F) Immunoblotting and quantitative analysis of p53 and p21 levels in Krt14+/+‐Fgf12f/f and Krt14Cre/+‐Fgf12f/f mice were treated with IMQ. β‐Actin was used as a loading control (n = 6). Error bars show the mean ± SEM. **p < 0.01; ***p < 0.001. The p value was determined using two‐tailed unpaired Student's t test (E and F). All numbers (n) are biologically independent experiments.
Figure 5
Figure 5
FGF12 deficiency‐driven amelioration of keratinocyte proliferation is p53 dependent. A) Immunoblotting and quantitative analysis of p53 protein level in NHEK cells that were transfected in si‐Scr or si‐p53. β‐Actin was used as a loading control (n = 5). B) Immunoblotting and quantitative analysis of Cyclin A1, Cyclin D1, and Cyclin E1 protein levels in NHEK cells that si‐p53 or si‐Scr was transfected in FGF12‐interference cells treated with M5 for 12 h. β‐Actin was used as a loading control (n = 4). C) Flow cytometric plots of cell‐cycle analysis performed with PI staining on HaCaT cells that si‐p53 or si‐Scr was transfected in FGF12‐interference cells treated with M5 for 12 h (left). Quantification the percentage of cells that fall into the sub G0/G1, S, or G2/M gates (right) (n = 5). D) Immunofluorescent and quantitative analysis (bottom) of Ki‐67+ in NHEK cells that si‐p53 or si‐Scr was transfected in FGF12‐interference cells treated with M5 for 12 h. Nuclei were stained with DAPI (blue) (n = 5). Scale bar = 50 µm. E) Immunofluorescent and quantitative analysis (bottom) of EdU+ in HaCaT cells that si‐p53 or si‐Scr was transfected in FGF12‐interference cells treated with M5 for 12 h. Nuclei were stained with Hoechst (blue) (n = 5). Scale bar = 50 µm. Error bars show the mean ± SEM. *p < 0.05; **p < 0.01; ***p < 0.001. & p < 0.05; &&p < 0.01; &&&p < 0.001. The p value was determined using two‐tailed unpaired Student's t test (A) or one‐way ANOVA (B‐E). All numbers (n) are biologically independent experiments.
Figure 6
Figure 6
FGF12 represses expression of p53 through MDM2. A) Immunoblotting and quantitative analysis of p53 and p21 protein levels in NHEK cells that si‐MDM2 or si‐Scr was transfected in Flag‐Fgf12 cells treated with M5. β‐Actin was used as a loading control (n = 4). B) Immunofluorescent and quantitative analysis (down) of p53 in HaCaT cells that si‐MDM2 or si‐Scr was transfected in Flag‐Fgf12 cells treated with M5. Nuclei were stained with DAPI (blue) (n = 5). Scale bar = 50 µm. C) qRT‐PCR analysis for p53 and p21 mRNA levels in HaCaT cells that si‐MDM2 or si‐Scr was transfected in Flag‐Fgf12 cells treated with M5 for 12 h (n = 5). D) p53‐dependent transcriptional activity of p53 determined by performing dual‐luciferase assays with HEK293 cells overexpressing FGF12 in the presence of si‐Scr, or si‐MDM2 (n = 5). E) Immunoblotting and quantitative analysis of Cyclin A1, Cyclin D1, and Cyclin E1 protein levels in NHEK cells that Vector or His‐MDM2 was transfected in FGF12‐interference cells treated with M5 for 12 h. β‐Actin was used as a loading control (n = 4). F) Immunofluorescent and quantitative analysis of Ki‐67+ in NHEK cells that Vector or His‐MDM2 was transfected in FGF12‐interference cells treated with M5 for 12 h. Nuclei were stained with DAPI (blue) (n = 5). Scale bar = 50 µm. Error bars show the mean ± SEM. **p < 0.01; ***p < 0.001. & p < 0.05; && p < 0.01. The p value was determined using one‐way ANOVA (A‐F). All numbers (n) are biologically independent experiments.
Figure 7
Figure 7
FGF12 stabilizes MDM2 by hindering its K48‐linked ubiquitination. A) Immunoblotting and quantitative analysis of MDM2 protein level that Flag‐Fgf12 or Vector were transfected in HEK293 cells. β‐Actin was used as a loading control (n = 5). B) qRT‐PCR analysis for MDM2 mRNA level that si‐Scr or si‐Fgf12 were transfected in HEK293 cells treated with M5 for 12 h (n = 5). C) Immunoblotting and quantitative analysis of MDM2 protein levels that Flag‐Fgf12 or Vector was transfected in HEK293 cells treated with cyclohexamide (CHX) for 0, 2, 4, and 6 h. β‐Actin was used as a loading control (n = 5). D) Immunoblotting of MDM2 protein level that si‐Scr or si‐Fgf12 were transfected in HaCaT cells treated with MG132 or CQ for 6 h. β‐Actin was used as a loading control. E) The NHEK cells were transfected with si‐Scr and si‐Fgf12 and then treated with M5 for 12 h. Cells were treated with MG132 (10 µM) for 6 h before lysation. The cell lysates were immunoprecipitated by anti‐MDM2 antibody, and then western blot assay with anti‐Ub, anti‐FGF12, and anti‐MDM2 antibody. F) The HaCaT cells were transfected with si‐Scr and si‐Fgf12 and then treated with M5 for 12 h. Cells were treated with MG132 (10 µM) for 6 h before lysation. The cell lysates were immunoprecipitated by anti‐MDM2 antibody, and then western blot assay with anti‐Ub, anti‐FGF12, and anti‐MDM2 antibody. G) The HaCaT cells were transfected with Vector and Flag‐Fgf12 and then treated with M5 for 12 h. Cells were treated with MG132 (10 µM) for 6 h before lysation. The cell lysates were immunoprecipitated by anti‐MDM2 antibody, and then western blot assay with anti‐Ub, anti‐Flag, and anti‐MDM2 antibody. H) The HEK293 cells were co‐transfected with Flag‐Fgf12, His‐MDM2, and HA‐Ub plasmids. Cells were treated with MG132 (10 µM) for 6 h before lysation. The cell lysates were immunoprecipitated by anti‐His antibody, and then western blot assay with anti‐HA, anti‐His, and anti‐Flag antibody. I) The HEK293 cells were co‐transfected with Flag‐Fgf12, His‐MDM2, and HA‐Ub‐K48 plasmids. Cells were treated with MG132 (10 µM) for 6 h before lysation. The cell lysates were immunoprecipitated by anti‐His antibody, and then western blot assay with anti‐HA, anti‐His, and anti‐Flag antibody. J) The HEK293 cells were co‐transfected with Flag‐Fgf12, His‐MDM2, and HA‐Ub‐K63 plasmids. Cells were treated with MG132 (10 µM) for 6 h before lysation. The cell lysates were immunoprecipitated by anti‐His antibody, and then western blot assay with anti‐HA, anti‐His, and anti‐Flag antibody. Error bars show the mean ± SEM. n.s., not significant; *p < 0.05; **p < 0.01; ***p < 0.001. The p value was determined using two‐tailed unpaired Student's t test (A and B) or one‐way ANOVA (C). All numbers (n) are biologically independent experiments.
Figure 8
Figure 8
FGF12 interacts with MDM2 to block binding of β‐Trcp. A,B) The HEK293 cells were co‐transfected with Flag‐Fgf12 and His‐MDM2 plasmids for 48 h. The lysates of cells were immunoprecipitated with His‐tag antibody and then western blot assay with Flag‐tag antibody (A); immunoprecipitated with Flag‐tag antibody and immunoblotted with His‐tag antibody (B). C) The HaCaT cell lysates were immunoprecipitated with IgG and anti‐MDM2 antibody and the expression of FGF12 and MDM2 were detected by western blot. D) Immunofluorescent staining (left) of FGF12 and MDM2 in HaCaT cells. Nuclei were stained with DAPI (blue). Scale bar = 20 µm. White lines in merged images (right) indicate the area where the distances between FGF12, MDM2, and DAPI were analyzed using ImageJ. E) The schematic diagram showed structural domains of MDM2 protein. F) HEK293 cells were transfected with Flag‐Fgf12 and several MDM2 deletion mutants. The whole‐cell lysates were immunoprecipitated with anti‐His beads and immunoblotted with anti‐Flag and anti‐His antibodies. G) HaCaT cells and stimulated with M5 for 0, 12, 24, 48 h. Whole‐cell lysates were IP with anti‐MDM2 then subjected to immunoblot analysis with the anti‐FGF12, anti‐MDM2 antibodies. H) HaCaT cells and stimulated with M5 for 0, 12, 24, 48 h. Whole‐cell lysates were immunoprecipitated with anti‐FGF12 then subjected to immunoblot analysis with the anti‐FGF12, anti‐MDM2 antibodies. I) NHEK cells were transfected with si‐Scr and si‐Fgf12 and then stimulated with M5 for 12 h. Cells were treated with MG132 (10 µM) for 6 h before lysation. Whole‐cell lysates were immunoprecipitated with anti‐MDM2 then subjected to immunoblot analysis with the anti‐β‐Trcp, anti‐MDM2 and anti‐FGF12 antibodies. J) Immunoblotting analysis of MDM2 protein level in NHEK cells that were transfected with si‐Scr, si‐β‐Trcp and si‐Fgf12 treatment by M5 for 12 h. β‐Actin was used as a loading control. K) HaCaT cells were co‐transfected with Flag‐Fgf12 plasmid (0, 2, 4 µg) and then stimulated with M5 for 12 h. Cells were treated with MG132 (10 µM) for 6 h before lysation. Whole‐cell lysates were immunoprecipitated with anti‐MDM2 then subjected to immunoblot analysis with the anti‐β‐Trcp, anti‐MDM2 and anti‐Flag antibodies. Data are representative of three independent experiments.
Figure 9
Figure 9
Loss of p53 abolishes the mitigatory effects of FGF12 knockdown on psoriasis in mice. A) Immunofluorescence images for the skin of mice with knock‐down respective genes were labeled with the indicated antibodies. Nuclei were stained with DAPI (blue). Scar bar = 50 µm. B) Immunoblotting and quantitative analysis of p53 protein level in AAV‐GFP and AAV‐sh‐p53 mice. β‐Actin was used as a loading control (n = 5). C) Representative histological sections of the dorsal back from Krt14+/+‐Fgf12f/f ; AAV‐GFP, Krt14Cre/+‐Fgf12f/f ; AAV‐GFP and Krt14Cre/+‐Fgf12f/f ; AAV‐sh‐p53 mice treated by IMQ stained with H&E, and quantification of the epidermal thickness and the infiltrating cells (n = 5). Scale bars = 100 µm. D) Immunofluorescent and quantitative analysis of K6 in the skin from Krt14+/+‐Fgf12f/f ; AAV‐GFP, Krt14Cre/+‐Fgf12f/f ; AAV‐GFP and Krt14Cre/+‐Fgf12f/f ; AAV‐sh‐p53 mice induced by IMQ. Nuclei were stained with DAPI (blue) (n = 5). Scale bars = 50 µm. E) Immunofluorescent and quantitative analysis of Ki‐67 positive cells in the skin from Krt14+/+‐Fgf12f/f ; AAV‐GFP, Krt14Cre/+‐Fgf12f/f ; AAV‐GFP and Krt14Cre/+‐Fgf12f/f ; AAV‐sh‐p53 mice stimulated by IMQ. Nuclei were stained with DAPI (blue) (n = 5). Scale bars = 100 µm. F) Immunoblotting of Cyclin A1, Cyclin D1, and Cyclin E1 protein levels in the skin from Krt14+/+‐Fgf12f/f ; AAV‐GFP, Krt14Cre/+‐Fgf12f/f ; AAV‐GFP and Krt14Cre/+‐Fgf12f/f ; AAV‐sh‐p53 mice treated by IMQ. β‐Actin was used as a loading control (n = 6). Error bars show the mean ± SEM. *p < 0.05; **p < 0.01; ***p < 0.001. &p < 0.05; &&p < 0.01; &&&p < 0.001. The p value was determined using two‐tailed unpaired Student's t test (B) or one‐way ANOVA (C‐F). All numbers (n) are biologically independent experiments.

Similar articles

References

    1. Boehncke W., Schön M., Lancet. 2015, 386, 983. - PubMed
    1. Brożyna A. A., Slominski R. M., Nedoszytko B., Zmijewski M. A., Slominski A. T., Int. J. Mol. Sci. 2022, 23, 8575. - PMC - PubMed
    1. Griffiths C. E., Barke J. N., Lancet. 2007, 370, 263. - PubMed
    1. Langley R. G., Krueger G. G., Griffiths C. E., Ann. Rheum. Dis. 2005, 64, ii18. - PMC - PubMed
    1. Zhou X., Chen Y., Cui L., Shi Y., Guo C., Cell Death Dis. 2022, 13, 81. - PMC - PubMed

MeSH terms

LinkOut - more resources