. 2024 Nov;11(42):e2407221.
doi: 10.1002/advs.202407221. Epub 2024 Sep 5.

Cross-Species Insights into Trophoblast Invasion During Placentation Governed by Immune-Featured Trophoblast Cells

Affiliations

Cross-Species Insights into Trophoblast Invasion During Placentation Governed by Immune-Featured Trophoblast Cells

Xupeng Zang et al. Adv Sci (Weinh). 2024 Nov.

Abstract

Proper development of the placenta, the transient support organ forms after embryo implantation, is essential for a successful pregnancy. However, the regulation of trophoblast invasion, which is most important during placentation, remains largely unknown. Here, rats, mice, and pigs are used as biomedical models, used scRNA-seq to comparatively elucidate the regulatory mechanism of placental trophoblast invasion, and verified it using a human preeclampsia disease model combined with scStereo-seq. A dual-featured type of immune-featured trophoblast (iTrophoblast) is unexpectedly discovered. Interestingly, iTrophoblast only exists in invasive placentas and regulates trophoblast invasion during placentation. In a normally developing placenta, iTrophoblast gradually transforms from an immature state into a functional mature state as it develops. Whereas in the developmentally abnormal preeclamptic placenta, disordered iTrophoblast transformation leads to the accumulation of immature iTrophoblasts, thereby disrupting trophoblast invasion and ultimately leading to the progression of preeclampsia.

Keywords: iTrophoblast; placentation; preeclampsia; trophoblast invasion.


Conflict of interest statement

The authors declare no conflict of interest.

Figures
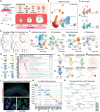
Figure 1
Figure 1
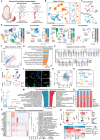
Decoding single‐cell transcriptome profiles during rat placentation using scRNA‐seq. A) Schematic diagram of the experimental design. The study included three critical stages of placental development in rats. The labyrinth zone (LZ) and junction zone (JZ) of rat placenta were collected. B) Uniform manifold approximation and projection (UMAP) visualization showing seven major cell types. C) UMAP visualization showing the cell cycle phase of rat placental cells. D) UMAP visualization showing the origin of placental cells at different stages. E) Line charts showing the proportion of major cell types in three stages. F) UMAP visualization showing subclusters of rat placental cell types. G) UMAP visualization showing marker gene expression in different placental trophoblast subclusters. H) Heatmap showing the top differentially expressed genes (DEGs) of trophoblast subclusters, and the GO biological process terms enriched by corresponding subcluster DEGs. I) UMAP visualization showing typical maker gene expression of trophoblast (Krt7) and immune (Ptprc) cell in clustered trophoblast subclusters. J,K) UMAP visualization showing the results of iTrophoblast integration with trophoblast and immune cell subclusters, and the corresponding average expression levels of trophoblast and immune cell marker genes. L) Immunostainings of Krt7 and Cd45 (Ptprc) protein in E15.5 rat placenta. M) Hierarchical clustering of iTrophoblast, trophoblast and immune cell subclusters. N) Violin plot showing the expression of top DEGs in SC subclusters. O) GO term clustering results of SC subclusters. E0.5‐E15.5, embryonic day 0.5 until 15.5; SC, stromal cell; EC, endothelial cell; Blood P., blood progenitor cells; Ery., erythrocyte; VE, visceral endoderm; TrPC, trophoblast progenitor cell; LaTP, labyrinth trophoblast progenitor cell; SpT, spongiotrophoblast; TGC, trophoblast giant cell; iTrophoblast, immune‐featured trophoblast cell; iSC, immune‐featured stromal cell; SMC, smooth muscle cell; IPC, immune progenitor cell; HBC, hofbauer cell; DC, dendritic cell; NK Cell, natural killer cell; EPC, endothelial progenitor cell; EndMT Cell, endothelial to mesenchymal transition cell.
Figure 2
Figure 2
Constructing of the single‐cell transcriptome atlas during early placentation in pigs. A) Schematic diagram of experimental design. The study included four different stages of early placentation in pigs. B) UMAP visualization showing seven major cell types of pig placenta. C) UMAP visualization showing the cell cycle phase. D) UMAP visualization showing the origin of placental cells at different stages. E) UMAP visualization showing subclusters of pig placental cell types. F) Stacked bar plot showing the proportion of each trophoblast subcluster in four stages. G) UMAP visualization showing marker gene expression in different placental trophoblast subclusters. H) Heatmap showing the top DEGs of trophoblast subclusters and the enriched GO terms by corresponding DEGs. I) Dot plot showing the expression of top DEGs in SC subclusters. J) GO term clustering results of SC subclusters. K) Dot plot showing the top DEGs in immune cell subclusters, and the heatmap showing the enriched GO terms. L) UMAP visualization showing typical maker gene expression of immune (PTPRC) and stromal (HAND2) cell in clustered immune cell subclusters. M,N) UMAP visualization showing the results of iSC integration with immune cell and SC subclusters, and the corresponding average expression levels of immune cell and SC marker genes. O) Hierarchical clustering of iSC, SC and immune cell subclusters. P0‐P28, day 0 to 28 of pregnancy.
Figure 3
Figure 3
Cross‐species comparative analysis of placental cells during placentation. A) Schematic diagram of cross‐species comparison of rat and pig placental cells. B,C) UMAP visualization showing all subclusters of major cell types identified in rat and pig placenta. D) Conserved genes identified in rat and pig placental cells. E,F) Violin plot and UMAP visualization showing the average expression levels of top 50 extravillous trophoblast cell (EVT) marker genes in rat and pig different trophoblast subclusters. G) Heatmap showing correlation of coexpressed gene modules in invasive trophoblast generated by WGCNA in rat and pig placentas. GO terms related to the module are highlighted on the right. H) PPI network of M1 module genes. Highlighting the 8 hub modules identified. I) UMAP visualization showing the reclustering of iTrophoblast cells. J) Stacked bar plot showing the proportion of each iTrophoblast subcluster in three stages. K) Violin plots and heatmap showing the top DEGs of iTrophoblast subclusters and enriched GOs. L) UMAP visualization showing the origin of iTrophoblast cells at different stages. M) UMAP visualization showing marker gene expression in different iTrophoblast subclusters. N) Predicted trajectories of iTrophoblast colored with pseudotime. O) Heatmap showing the clustering of DEGs along iTrophoblast developmental trajectory. P) UMAP projection of mouse iTrophoblasts showing the three subclusters of iTrophoblasts. Q) Stacked bar plot showing the proportion of mouse iTrophoblast subcluster in five stages. R) Violin plots and heatmap showing the top DEGs of mouse iTrophoblast subclusters and enriched GOs.
Figure 4
Figure 4
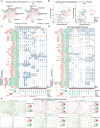
Functional cellular disorders regulating trophoblast invasion of placenta in human preeclampsia. A) Schematic diagram of human normal and preeclamptic placental sample collection. B) UMAP visualization showing the six major cell types in human normal (C) and preeclamptic (PE) placenta. C) UMAP visualization showing the cell cycle phase of human placental cells. D) UMAP visualization showing the origin of placental cells in both samples. E) UMAP visualization showing subclusters of human placental cell types, with a stacked bar plot showing the proportion corresponding to each subcluster. F) Scatter plot showing DEGs of PE placenta compared with normal placenta in EVT. G) GO enrichment terms of DEGs of PE placenta compared with normal placenta in EVT. H) Violin plots showing gene expression of hub modules 2–5 identified above in normal and PE placental EVT. I) UMAP visualization showing typical marker gene expression of trophoblast (KRT7) and immune (PTPRC) cells in clustered trophoblast and immune cell subclusters. J) Immunostainings of KRT7 and CD45 (PTPRC) protein in human normal placenta. K) Flow cytometry analysis of iTrophoblast expressing KRT7 and CD45 (PTPRC) in normal human placenta. L) Volcano plots showing DEGs between mature and immature iTrophoblast subclusters. M) GO enrichment and Kyoto Encyclopedia of Genes and Genomes (KEGG) pathway analysis of DEGs between mature and immature iTrophoblast subclusters, showing the top 15 enriched terms for each category. N) UMAP visualization showing the reclustered iTrophoblast subclusters. O) Stacked bar plot showing the proportion of each iTrophoblast subcluster in different placenta samples and subcluster origins. P) Heatmap showing the top DEGs of iTrophoblast subclusters and enriched GO terms. Q) Cell differentiation score calculated by CytoTRACE and predicted trajectories of iTrophoblast colored by pseudotime. R) Heatmap showing the correlation between iTrophoblast subclusters with different types of trophoblast and immune cells. C, normal placenta; PE, preeclamptic placenta; CTB, cytotrophoblast; CTB‐CCC, cytotrophoblast cell column‐cytotrophoblast; STB, syncytiotrophoblast; EVT, extravillous trophoblast.
Figure 5
Figure 5
Spatial identification and visualization of iTrophoblast in normal and preeclamptic placentas using scStereo‐seq. A) Schematic diagram of placenta samples for spatial transcriptomics (scStereo‐seq). B) Spatial distribution of spots colored by placental major cell type scores in scStereo‐seq data. C) The identified cell subclusters from scRNA‐seq atlas mapped to scStereo‐seq profile by cell2location deconvolution. D) In situ hybridization of iTrophoblast subcluster DEGs merged with KRT8 and PTPRC.
Figure 6
Figure 6
Dysfunctional and spatially disorganized iTrophoblast leads to failure of placental EVT invasion and preeclampsia. A) Network diagram for the number of ligand‐receptor pairs in main cell types between normal and PE placentas. Edge width is proportional to the number of cell interactions. B) Outgoing and incoming communication probabilities and number of interactions in different cell subclusters of placenta. C) Dot plot showing outgoing signals from the iTrophoblast2 subcluster emitted to trophoblast and immune cell subclusters. D) Dot plot showing outgoing signals from the HBC subcluster emitted to iTrophoblast and trophoblast subclusters. E) scStereo‐seq heatmaps of normal placenta showing spatial expression of selected ligands and receptors.

References

    1. Maltepe E., Fisher S. J., Annu. Rev. Cell Dev. Biol. 2015, 31, 523. - PubMed
    1. Woods L., Perez‐Garcia V., Hemberger M., Front. Endocrinol. 2018, 9, 570. - PMC - PubMed
    1. Gardner R., Beddington R., J. Cell Sci. 1988, 1988, 11. - PubMed
    1. Rai A., Cross J. C., Dev. Biol. 2014, 387, 131. - PubMed
    1. Soares M. J., Chakraborty D., Renaud S. J., Kubota K., Bu P., Konno T., Ma K., J. Reprod. Dev. 2012, 58, 283. - PMC - PubMed

LinkOut - more resources