. 2025 Feb 1;110(2):350-367.
doi: 10.3324/haematol.2024.285552.

BCAT1 is a NOTCH1 target and sustains the oncogenic function of NOTCH1

Affiliations

BCAT1 is a NOTCH1 target and sustains the oncogenic function of NOTCH1

Valeria Tosello et al. Haematologica. .

Abstract

High levels of branched-chain amino acid (BCAA) transaminase 1 (BCAT1) have been associated with tumor aggressiveness and drug resistance in several cancer types. Nevertheless, the mechanistic role of BCAT1 in T-cell acute lymphoblastic leukemia (T-ALL) remains uncertain. We provide evidence that Bcat1 was over-expressed following NOTCH1-induced transformation of leukemic progenitors and that NOTCH1 directly controlled BCAT1 expression by binding to a BCAT1 promoter. Further, using a NOTCH1 gain-of-function retroviral model of T-ALL, mouse cells genetically deficient for Bcat1 showed defects in developing leukemia. In murine T-ALL cells, Bcat1 depletion or inhibition redirected leucine metabolism towards production of 3-hydroxy butyrate (3-HB), an endogenous histone deacetylase inhibitor. Consistently, BCAT1-depleted cells showed altered protein acetylation levels which correlated with a pronounced sensitivity to DNA damaging agents. In human NOTCH1-dependent leukemias, high expression levels of BCAT1 may predispose to worse prognosis. Therapeutically, BCAT1 inhibition specifically synergized with etoposide to eliminate tumors in patient-derived xenograft models suggesting that BCAT1 inhibitors may have a part to play in salvage protocols for refractory T-ALL.


Figures
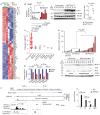
Figure 1.
Figure 1.
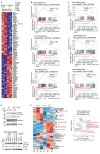
BCAT1 is upregulated during NOTCH1-dependent transformation. (A) Heat map showing the top 50 most downregulated and upregulated genes between normal double-positive (DP) cells and ICN1-induced DP leukemic cells (NIC Tumors). (B) Expression levels (quantitative polymerase chain reaction [qRT-PCR]; left) of Bcat1 in thymocytes obtained from 6-8-week-old C57/ Bl6 mice and leukemic cells from 6 AE-NOTCH1 T-cell acute lymphoblastic leu kemia (T-ALL) tumors (NOTCH1-T). Significance was calculated using an unpaired two-tailed t test. **P<0.01. Western blot (right) showing protein expression levels of ICN1 and Bcat1. (3-actin and tubulin are shown as loading controls. Graphical representation of Bcat1/|3-actin ratios (extreme right). Bars represent mean values. ICN1: intracellular NOTCH1. (C) Box plot showing the expression of BCAT1 mRNA in T-ALL patients (N=57) and thymocyte subsets (7 thymocyte and mature T-cell subsets derived from [N=3] independent donors; quantile-normalized microarray results downloaded from GSE33469 and GSE33470). CD3+ and CD3- DP cells were grouped together. CD1+ and CD1-CD34+ cells were grouped together. Boxes represent first and third quartiles and line represents the median. Statistical analysis between groups was performed using unpaired two-sided t test. (D) BCAT1 transcript (top) and protein levels (bottom) in total human thymus, NOTCH1 wild-type and NOTCH1-activated/mutated patient derived T-ALL patient-derived xenografts (PDX). Significance was calculated using a non-parametric t test (Mann-Whitney). **P<0.01. ICN1, MYC and PTEN protein levels are also shown. (3-actin is shown as loading control. (E) PDX samples were treated in vivo with DBZ (10 μg/kg every 8 hours [h] for a total of 3 injections) or vehicle (dimethyl suldoxide [DMSO]) for 24 h before analysis of BCAT1 transcript levels. For statistical analysis, an unpaired t test was used. **P<0.01, ***P<0.001. (F) NOTCH1 chromatin immunoprecipitation (ChIP)-sequencing binding (left) in the BCAT1 locus in HPB T-ALL cells. Inset shows the location of ChIP-quantitative polymerase chain reaction (qPCR) amplicons near NOTCH-1 peak region (P1-P2) and in a negative control region (NL). Chromatin from PF382 cells was subjected to ChIP using a NOTCH1 antibody (right). The indicated regions (P1, P2 and NL) were PCR amplified from the precipitated and input DNA. Fold enrichment was calculated as a ratio of amplification efficiency of ChIP sample over that of the immunoglobulin G (IgG) control. Shown are means ± standard deviation SD (N≥3). For statistical analysis, an unpaired t test was used. ***P<0.001. NS: not significant.
Figure 2.
Figure 2.
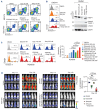
Functional effects of BCAT1 depletion. (A) Kaplan-Meier survival curves of overall survival in lethally irradiated C57BL/6J hosts transplanted with bone marrow (BM) cells (wild-type [WT] or knockout [KO] for Bcat1) transduced with ΔE-NOTCH1 allele. Data from 2 independent transplantation experiments were pooled together. Log-rank Mantel-Cox test was performed to calculate P value. ***P<0.001. Shaded area represents 95% confidence interval (CI). (B) Representative plots (left) and bar graph representation (S-phase fraction; right) of ex vivo EdU incorporation in ΔE-NOTCH1 leukemias WT and null for Bcat1. Data for bar graph is shown as mean ± standard deviation (SD). Significance was calculated using an unpaired two-tailed t test. ***P<0.001. (C) Representative plots (left) and bar graph representation (S-phase fraction; right) of MOLT4 cells transduced with small hairpin control vector (shCTRL), shBCAT1 #1 or shBCAT1 #2 7 days post-puromycin selection and assessed for EdU incorporation by fluorescence-activated cell sorting (FACS) analysis. Data for bar graph is shown as mean ± standard deviation (SD). Significance was calculated using an unpaired two-tailed t test. ***P<0.001. (D) T-ALL cells were transduced with control vector (shCTRL) or vector containing shRNA sequences against BCAT1 (shBCAT1 #1, shBCAT1 #2). Expression of BCAT1 and tubulin was analyzed by immunoblotting 7 days post transduction (left panels) in DND41 and MOLT4. Starting from 7 days post-puromycin selection, cell proliferation was evaluated by determining cell number (DND41) or ATP levels by bioluminescence (MOLT4). Significance was calculated using an unpaired two-tailed t test. *P<0.05, **P<0.01. (E) Representative images of bioluminescence (left) and quantitative analysis of tumor burden (right) in NSG mice xenografted with CCRF-CEM cells expressing luciferase and transduced with shCTRL or shBCAT1 (#1 and #2). Analysis after 15 days post-transplant is shown. Significance was calculated using an unpaired two-tailed t test. **P<0.01. (F) Representative images of bioluminescence (top) and quantitative analysis of tumor burden (bottom) in NSG mice xenografted with MOLT4 cells expressing luciferase and transduced with shCTRL or shBCAT1 (#1 and #2). Analysis after 15 days post-transplant is shown. Significance was calculated using an unpaired two-tailed t test. *P<0.05, **P<0.01.
Figure 3.
Figure 3.
Canonical functions of Bcat1. (A) Heat map representation of the top down-and upregulated genes between AE-NOTCH1 tumors wild-type (WT) or knockout (KO) for Bcat1. Two independent WT and KO tumors were analyzed. Bcat1 gene is highlighted in red. (B) Gene set enrichment analysis (GSEA) identified 3 significantly enriched gene sets involved in cell cycle regulation downregulated in Bcat1 KO T-cell acute lymphoblastic leukemia (T-ALL) cells. The normalized enrichment score (NES) and the nominal P value are illustrated. (C) GSEA identified 3 significantly enriched gene sets involved in DNA damage response upregulated in Bcat1 KO T-ALL cells. The NES and the nominal P value are illustrated. (D) Immunoblots of yH2AX, p21 and Bcat1 in tumors WT or KO for Bcat1 (top). a-tubulin is shown as loading control. T-ALL cells (CCRF-CEM, DND41, MOLT4) transduced with shCTRL/ CAS9 or shBCAT1 (#1 and #2)/sgBCAT1 were analyzed by immunoblotting for yH2AX and BCAT1 (bottom). (3-actin is shown as loading control. (E) Heatmap representation (left) of the top 50 differentially expressed metabolites identified by capillary electrophoresis time-of-flight mass spectrometry (CE-TOFMS) between AE-NOTCH1 leukemias WT and KO for Bcat1. Metabolites that are significantly and consistently differentially expressed in multiple comparisons are highlighted in red. Volcano plot (right) showing differentially expressed metabolites (≥1.5 fold change, P<0.05; in red and blue) identified by CE-TOFMS between AENOTCH1 leukemias WT and KO for Bcat1. Metabolites that are significantly and consistently differentially expressed in multiple comparisons are encircled.
Figure 4.
Figure 4.
ERG245, a BCAT1-specific inhibitor mimics the functional consequences of Bcat1 depletion. (A) Representative plots of apoptosis in AE-NOTCH1 leukemia wild-type for Bcat1 (WT#6) treated in vitro for 48 hours (h) with phosphate-buffered saline (PBS) (vehicle) or increasing doses of ERG245 (200 μM - 1 mM). (B) Representative plots of ΔE NOTCH1 leukemia WT for Bcat1 (WT#6) treated in vitro for 48 h with PBS (vehicle) or increasing doses of ERG245 (200-500 \iM). Cells were then assessed for EdU incorporation by fluorescence-activated cell sorting (FACS) analysis. (C) Representative cell viability analysis in AE-NOTCH1 tumors WT (WT#3) or knockout (KO) (KO#3, #1) for Bcat1. Murine T-cell acute lymphoblastic leukemia (T-ALL) cells were treated in vitro for 48 h with PBS (vehicle) or increasing doses of ERG245 (100 ^M - 1 mM). Data is shown as mean ± standard deviation (SD). (D) Representative plots of T-ALL cell lines (CCRF-CEM, DND41) treated in vitro for 72 h with PBS (vehicle) or ERG245 (300 μM). Cells were then assessed for EdU incorporation by FACS analysis. (E) Representative plots of PDX#27 treated in vitro for 72 h with PBS (vehicle) or increasing doses of ERG245 (300 μM - 1 mM). Cells were then assessed for EdU incorporation by FACS analysis.
Figure 5.
Figure 5.
BCAT1 loss induces a dysfunctional DNA damage response following etoposide treatment. (A) Representative cell viability analysis (top) in AE-NOTCH1 tumors wild-type (WT) (WT#1) or knockout (KO) (KO#6) for Bcat1. Murine T-cell acute lymphoblastic leukemia (T-ALL) cells were treated in vitro for 48 hours (h) with dimethyl sulfoxide (DMSO) (vehicle) or increasing concentrations of etoposide (25-100 nM). Data is shown as mean ± standard deviation (SD). Significance was calculated using an unpaired two-tailed t test. *P<0.05, **P<0.01. Quantification of apoptosis (bottom) in AE-NOTCH1 tumors WT (WT#1) or KO (KO#6) for Bcat1 treated in vitro for 48 h with DMSO (vehicle) or increasing concentrations of etoposide (25-100 nM). Data is shown as mean ± SD. Significance was calculated using an unpaired two-tailed t test. *P<0.05, **P<0.01. (B) Representative plots of apoptosis (left) in CCRF-CEM T-ALL cells transduced with small hairpin control vector (shCTRL) or shBCAT1 (#1 and #2) and treated in vitro for 48 h with DMSO (vehicle) or etoposide (100 nM or 1 μM). Quantification of apoptosis (right) in CCRF-CEM T-ALL cells transduced with shCTRL or shBCAT1 (#1 and #2) and treated in vitro for 48 h with DMSO (vehicle) or etoposide (100 nM - 2 μM). Significance was calculated using an unpaired two-tailed t test. **P< 0.01, ***P<0.001. (C) Expression of cleaved PARP-1 and phosphorylated yH2AX was analyzed by immunoblotting in CCRF-CEM T-ALL cells transduced with shCTRL or shBCAT1 (#1 and #2) and treated in vitro for 48 h with DMSO (vehicle) or etoposide (1 μM). [3-actin and GADPH are shown as loading controls. (D) Representative neutral comet images (left) performed in CCRF-CEM cells infected with a control shRNA (shCTRL) or BCAT1-targeting shRNA (shBCAT1#1, shBCAT1#2) either untreated or after etoposide treatment (1µM) for 2 or 6 hours. Dot plot (right) showing individual percentages of comet tail DNA. The median value of 50-80 nuclei per experimental condition is indicated. Statistical analysis was conducted by using the Mann-Whitney test. Data are representative of 2 independent experiments.
Figure 6.
Figure 6.
BCAT1-specific inhibition increases response to DNA-damaging agents, especially etoposide, in vitro and in vivo. (A) Representative plots of apoptosis in MOLT4 T-cell acute lymphoblastic leukemia (T-ALL) cells treated with vehicle (dimethyl sulfoxide [DMSO]), BCAT1 inhibitor (ERG245), etoposide (Etop; 50-75 nM) or the combination (ERG245 + Etop) for 48 hours (h). (B) Representative plots of Annexin V staining (left panels) in DND41 T-ALL cells treated with vehicle (DMSO), BCAT1 inhibitor (ERG245), Etop or the combination (ERG245 + Etop) for 48 h. Western blot analysis (right panels) of PARP-1 (total or cleaved PARP-1), and phosphorylated yH2AX in DND41 cells treated for 48 h with DMSO (vehicle), ERG245 (200 µM), Etop (500 nM) or ERG245 + Etop. GADPH was used as protein loading control. (C) Representative plots (left) and bar graph representation (right) of apoptosis (Annexin V-positive) in ex vivo obtained PDX#39 cells treated with vehicle (DMSO), BCAT1 inhibitor (ERG245), Etop (50-250 nM) or the combination (ERG245 + Etop) for 48 h. Significance was calculated using an unpaired two-tailed t test. **P<0.01, ***P<0.001. (D) Representative images of bioluminescence (left) in NSG mice xenografted with PDX#27 cells expressing luciferase (PDX#27-luc) and treated with vehicle (DMSO), BCAT1 inhibitor (ERG245; 30 mg/kg 3 times a week), Etop (15 mg/kg twice a week) or the combination (ERG245 + Etop). Analysis before (day 13 post-transplantation) and 15 days after start of treatment (day 28 post-transplantation) is shown. Quantitative analysis of tumor load (right) via in vivo bioluminescence imaging of NSG mice xenografted with PDX#27-luc after treatment (day 28 post-transplantation) with vehicle (DMSO), BCAT1 inhibitor (ERG245), Etop or the combination (ERG245 + Etop). Significance was calculated using an unpaired two-tailed t test. **P<0.01, ***P<0.001. NS: not significant.
Figure 7.
Figure 7.
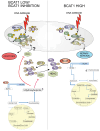
Schematic illustration of the proposed role of BCAT1 in regulating T-cell acute lymphoblastic leukemia response to DNA-damaging agents in BCAT1-high and BCAT1-silenced/functionally inhibited T-cell acute lymphoblastic leukemia cells. BCAT1 inhibition induces a partial break in the tricarboxylic acid cycle cycle between citrate and succinate leading to citrate accumulation and directing leucine metabolism towards 3-HB synthesis. 3-HB is known to act as an energy source in the absence of sufficient glucose and as it builds up it inhibits class I histone deacetylases (HDAC), leading to increased acetylation of proteins such as histones and DNA damage response proteins (including Ku70 and Ku80) modifying their activity, and possibly priming cells to the deleterious effects of DNA-damaging agents. Following the exposure to DNA-damaging agents (etoposide) this leads to accentuated DNA damage leading to cell death.

References

    1. Terwilliger T, Abdul-Hay M. Acute lymphoblastic leukemia: a comprehensive review and 2017 update. Blood Cancer J. 2017;7(6):e577. - PMC - PubMed
    1. Pui CH, Robison LL, Look AT. Acute lymphoblastic leukaemia. Lancet. 2008;371(9617):1030-1043. - PubMed
    1. Belver L, Ferrando A. The genetics and mechanisms of T cell acute lymphoblastic leukaemia. Nature reviews Cancer. 2016;16(8):494-507. - PubMed
    1. Bongiovanni D, Saccomani V, Piovan E. Aberrant signaling pathways in T-cell acute lymphoblastic leukemia. Int J Mol Sci. 2017;18(9):1904. - PMC - PubMed
    1. Weng AP, Ferrando AA, Lee W, et al. . Activating mutations of NOTCH1 in human T cell acute lymphoblastic leukemia. Science. 2004;306(5694):269-271. - PubMed

MeSH terms