. 2024 Sep 3;16(9):evae195.
doi: 10.1093/gbe/evae195.

Genomic Diversity Illuminates the Environmental Adaptation of Drosophila suzukii

Affiliations

Genomic Diversity Illuminates the Environmental Adaptation of Drosophila suzukii

Siyuan Feng et al. Genome Biol Evol. .

Abstract

Biological invasions carry substantial practical and scientific importance and represent natural evolutionary experiments on contemporary timescales. Here, we investigated genomic diversity and environmental adaptation of the crop pest Drosophila suzukii using whole-genome sequencing data and environmental metadata for 29 population samples from its native and invasive range. Through a multifaceted analysis of this population genomic data, we increase our understanding of the D. suzukii genome, its diversity and its evolution, and we identify an appropriate genotype-environment association pipeline for our dataset. Using this approach, we detect genetic signals of local adaptation associated with nine distinct environmental factors related to altitude, wind speed, precipitation, temperature, and human land use. We uncover unique functional signatures for each environmental variable, such as the prevalence of cuticular genes associated with annual precipitation. We also infer biological commonalities in the adaptation to diverse selective pressures, particularly in terms of the apparent contribution of nervous system evolution to enriched processes (ranging from neuron development to circadian behavior) and to top genes associated with all nine environmental variables. Our findings therefore depict a finer-scale adaptive landscape underlying the rapid invasion success of this agronomically important species.

Keywords: Drosophila suzukii; environmental adaptation; genotype–environment association; invasion genomics.


Conflict of interest statement

Conflict of Interest The authors have no conflicts of interest to declare.

Figures

Fig. 1.
Fig. 1.
D. suzukii populations show maximal diversity in Eastern Asia and continent-level genetic structure. a) The geographic locations of the studied 29 natural populations are depicted as dots. In addition to the 22 populations sampled by Olazcuaga et al. (2020), populations newly sampled at independent locations are circled in black. Populations newly sampled at nearby locations are circled and center-dashed in black, with the number of total population samples in brackets. The year of the first recorded occurrence in each geographic range (colored grey in the map) is given in brackets in the color legend. China (CN) and Japan (JP) are within the native range of D. suzukii. The gray shading indicates countries with samples represented in this study (darkest), those with documented occurrence of D. suzukii but not sampled in this study (medium), or those lacking occurrence records of D. suzukii (lightest) (Bächli 2016; Rossi Stacconi 2022). Further information about each sample is presented in supplementary table S1, Supplementary Material online. b) Population differentiation in allele frequencies (FST; lower triangle), between-population sequence distances (DXY; higher triangle), and within-population nucleotide diversity (πS; diagonal) across autosomal synonymous SNPs are displayed as a heatmap. DXY and πS share the same color scale, since theoretically DXY between genetically identical populations is π. Population names are colored by their geographic region. Asterisks indicate samples contaminated by other Drosophila species, which may affect estimation of these statistics. c) Autosomal genetic structure is shown by three-dimensional principal components analysis (PCA) based on allele frequencies of the two most frequent alleles across all populations. Each dot represents a population. Labeled are Hawaii and western coastal US populations, to illustrate potential admixture. See the X chromosome version of b) and c) in supplementary fig. S2, Supplementary Material online.
Fig. 2.
Fig. 2.
Chromosomal distribution of genetic polymorphism in D. suzukii informs the ordering and orientations of contigs, as well as levels of centromeric and telomeric repression. Window nucleotide diversity (πw) values are displayed across a) the X chromosome and major autosomal arms b) 2L, c) 2R, d) 3L, e) 3R. Chromosome 4 is not shown as it only contains 12 windows. Each window is a continuous genomic region that includes 125,000 analyzed sites. Each dot represents the average πw across populations within their geographic range as colored. Only populations from major continental ranges are shown for chromosomal patterns to be clear. Within each chromosome arm, separate contigs are indicated by gray or white shading, and ordered by length. However, we note that certain arrangements of contigs would result in patterns of reduced πw at the ends of each arm, as expected based on other examined D. melanogaster group species (e.g. True et al. 1996), and relatively smooth shifts in the diversity of large windows. Therefore, the landscape of genome-wide polymorphism could provide useful information to aid the ordering and orienting of contig-level genome assemblies like that of D. suzukii.
Fig. 3.
Fig. 3.
Identification of least-correlated environmental variables for GEA analysis in D. suzukii. a) Pairwise correlations among a preliminary set of 26 environmental variables that are potentially impactful on D. suzukii. b) A final set of nine of the most relevant and least correlated environmental variables that were chosen for GEA analysis. The Pearson correlation coefficients are colored from −1 (perfect negative correlation) to 1 (perfect positive correlation). Significance correlations (P < 0.05) are indicated by asterisks. See supplementary table S4, Supplementary Material online for environmental values used to calculate correlation coefficients.
Fig. 4.
Fig. 4.
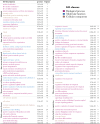
GO enrichment analysis of candidate genes from the gene-environment association analysis of D. suzukii. The top 10 GO categories enriched by the top 500 genes associated with each environmental variable are shown in each panel (labelled on the left), with permutation P-values and the number of associated genes in each GO category. Descriptions of GO categories are colored by their GO class (see legend at top right). Only GO categories including more than five associated genes are listed here. For a full list of enriched GO categories, see supplementary table S8, Supplementary Material online.
Fig. 5.
Fig. 5.
Overlapping genes and GO categories among environmental factors reveal the shared genetic and functional basis of environmental adaptation in D. suzukii. The numbers and proportions of shared a) environment-associated genes and b) enriched GO categories among environmental factors are shown in heatmaps. Here, joint proportion represents the fraction of the genes or GO terms associated with either of two environmental variables that are associated with both variables. c) Top GO categories of each type are depicted as bubbles. Bubbles are colored by the negative logarithm of the combined P-value of enrichment across all environmental variables, and are scaled by the number of enriched genes. The number of environmental variables that enrich a given GO category is indicated by the top horizontal axis.

Update of

References

    1. Adrion JR, Kousathanas A, Pascual M, Burrack HJ, Haddad NM, Bergland AO, Machado H, Sackton TB, Schlenke TA, Watada M, et al. . Drosophila suzukii: the genetic footprint of a recent, worldwide invasion. Mol Biol Evol. 2014:31(12):3148–3163. 10.1093/molbev/msu246. - DOI - PMC - PubMed
    1. Alloway PG, Dolph PJ. A role for the light-dependent phosphorylation of visual arrestin. Proc Natl Acad Sci U S A. 1999:96(11):6072–6077. 10.1073/pnas.96.11.6072. - DOI - PMC - PubMed
    1. Asplen MK, Anfora G, Biondi A, Choi D-S, Chu D, Daane KM, Gibert P, Gutierrez AP, Hoelmer KA, Hutchison WD, et al. . Invasion biology of spotted wing Drosophila (Drosophila suzukii): a global perspective and future priorities. J Pest Sci. 2015:88(3):469–494. 10.1007/s10340-015-0681-z. - DOI
    1. Atallah J, Teixeira L, Salazar R, Zaragoza G, Kopp A. The making of a pest: the evolution of a fruit-penetrating ovipositor in Drosophila suzukii and related species. Proc Biol Sci. 2014:281(1781):20132840. 10.1098/rspb.2013.2840. - DOI - PMC - PubMed
    1. Avidor-Reiss T, Leroux MR. Shared and distinct mechanisms of compartmentalized and cytosolic ciliogenesis. Curr Biol. 2015:25(23):R1143–R1150. 10.1016/j.cub.2015.11.001. - DOI - PMC - PubMed

LinkOut - more resources