. 2024 Aug;532(8):e25665.
doi: 10.1002/cne.25665.

Scaled Complexity of Mammalian Astrocytes: Insights From Mouse and Macaque

Affiliations

Scaled Complexity of Mammalian Astrocytes: Insights From Mouse and Macaque

Kate S Heffernan et al. J Comp Neurol. 2024 Aug.

Abstract

Astrocytes intricately weave within the neuropil, giving rise to characteristic bushy morphologies. Pioneering studies suggested that primate astrocytes are more complex due to increased branch numbers and territory size compared to rodent counterparts. However, there has been no comprehensive comparison of astrocyte morphology across species. We employed several techniques to investigate astrocyte morphology and directly compared them between mice and rhesus macaques in cortical and subcortical regions. We assessed astrocyte density, territory size, branching structure, fine morphological complexity, and interactions with neuronal synapses using a combination of techniques, including immunohistochemistry, adeno-associated virus-mediated transduction of astrocytes, diOlistics, confocal imaging, and electron microscopy. We found significant morphological similarities between primate and rodent astrocytes, suggesting that astrocyte structure has scaled with evolution. Our findings show that primate astrocytes are larger and more numerous than those in rodents but contest the view that primate astrocytes are morphologically far more complex.

Keywords: astrocyte; astrocyte complexity; astrocyte morphology; astrocyte‐synapse interaction; species comparison.


Figures

Figure 1.
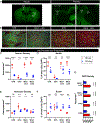
Figure 1.. Astrocyte and neuron densities across the rhesus macaque and mouse brain.
(A) Representative example of sampled brain regions from mouse (left) and rhesus macaque (right). MCX, motor cortex; STR, striatum; GP, globus pallidus. Scalebars 2mm. (B) Representative examples of astrocyte (red) and neuron (green) labeling in striatum and motor cortex in mouse (left) and rhesus macaque (right), scalebars 20 μm. (C) Neuron density measurements (STR: p=0.0022; GPe: p=0.0022; MCX L2/3: p=0.0022; MCX L5/6: p=0.0022; Multiple Mann-Whitney tests). (D) Percent of total nuclei that are NeuN+ (STR: p=0.0022; GPe: p=0.0022; MCX L2/3: p=0.0043; MCX L5/6: p=0.0022; Multiple Mann-Whitney tests). (E) Astrocyte density measurements (3STR: p=0.2229; GPe: p=0.0022; MCX L2/3: p=0.0087; MCX L5/6: p=0.8506; Multiple Mann-Whitney tests). (F) Percent of total nuclei that are Sox9+ (STR: p=0.0022; GPe: p=0.5887; MCX L2/3: p=0.0022; MCX L5/6: p=0.0022; Multiple Mann-Whitney tests). (G) Total nuclei density assessed by DAPI staining (p=0.0022 for all regions; Multiple Mann-Whitney tests). All panels: inter-species comparisons assessed by multiple Mann-Whitney tests. All individual data are shown with lines representing means and error bars (panel G) as standard deviation (nmouse = 6, nrhesus macaque = 6).
Figure 2.
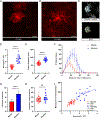
Figure 2.. Astrocyte primary branching with GFAP.
(A) Representative maximum intensity z-projection of GFAP+ astrocyte in layer 5 of mouse motor cortex. (B) Representative maximum intensity z-projection of GFAP+ astrocyte in layer 5 of rhesus macaque motor cortex. All scalebars 20 μm. (C) Steps of processing: binarization, territory outline, and Sholl analysis. (D-E) Territory area (p<0.0001, t-test) and Feret’s maximum diameter (p<0.0001, t-test) of mouse and rhesus macaque GFAP+ astrocytes (Nrhesus macaque= 2, Ncells= 21 Nmouse= 6, Ncells= 32). (F) Sholl analysis of individual astrocyte morphologies. Data are represented as mean ± SD. (G) Number of GFAP+ primary branches in individual astrocytes (p<0.0001, t-test). Data are represented as mean ± SD. (H) Complexity ratio: territory area/maximum number of intersections (p=0.0754, t-test). (I) Linear regressions of maximum number of intersections and area.
Figure 3.
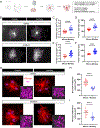
Figure 3.. Comparison of astrocyte territories after viral transduction using the GfaABC1D promoter.
(A) Schematic of experimental procedure. (B) Example maximum intensity z-projections or astrocytes in mouse and rhesus macaque motor cortex layer 5 and striatum (putamen in rhesus macaque and dorsolateral striatum in mouse). All scalebars 20 μm. (C-D) Territory area (p<0.0001, t-test with Welch’s correction) and Feret’s maximum diameter (p<0.0001, t-test with Welch’s correction) of cortical astrocytes (Nrhesus macaque= 3, Ncells= 25, Nmouse= 5, Ncells= 30). (E-F) Territory area (p<0.0001, t-test with Welch’s correction) and Feret’s maximum diameter (p<0.0001) of striatal astrocytes (Nrhesus macaque= 2, Ncells= 41, Nmouse= 5, Ncells= 22). (G) Representative examples of sites for neuropil infiltration volume (NIV) analysis in mouse (left) and rhesus macaque (right) in primary motor cortex (top) and striatum (bottom). Scalebar 10 μm on overview image and 2 μm on inset. (H) Neuropil infiltration volume (p<0.0001, t-test with Welch’s correction) of cortical astrocytes (Nrhesus macaque= 2, Ncells= 14, Nmouse= 5, Ncells= 30). (I) Neuropil infiltration volume (p<0.0001, t-test) of striatal astrocytes (Nrhesus macaque= 2, Ncells= 15, Nmouse= 5, Ncells= 22). Only animals injected with AAV5-GfaABC1D-tdTomato were included in NIV analysis.
Figure 4.
Figure 4.. Morphology of fine astrocyte processes using diOlistics.
(A) Experimental overview. (B) Representative examples of diI-labeled astrocytes in mouse (left) and rhesus macaque (right). Maximum intensity z-projections (top) and individual slices (middle and bottom) of each cell. Scalebars 20 μm. (C-D) Territory area (p<0.0001, t-test, Nmouse=6 Ncells= 10, Nrhesus macaque=2 Ncells= 12) and Feret’s diameter (p<0.0001, t-test) of cortical diI-labeled astrocytes. (E) Fractal dimension box counting (p=0.4961, t-test). (F) Representative examples of neuropil infiltration volume (NIV) sites and surface reconstructions in mouse (left) and rhesus macaque (right). (G) Neuropil infiltration volumes (p=0.0164, t-test).
Figure 5.
Figure 5.. Astrocyte coverage of neuronal GABAergic terminals.
(A) Representative examples of image processing from right to left: tdTomato+ astrocyte, vgat1 labeling, outlining of the astrocyte territory, and quantification of the vgat1+ terminals within the astrocyte territory. (B) Representative images of astrocytes and vgat1 staining in mouse (left) and rhesus macaque (right) primary motor cortex (top) and striatum (bottom). (C) Density of vgat1+ terminals per 100 μm2 in layer 5 of mouse and rhesus macaque motor cortex (Nmouse=4, Nastrocytes=19, Nimages=57; Nrhesus macaque=2, Nastrocytes=8, Nimages=24; t-test, p<0.0001). (D) Number of vgat1+ terminals per astrocyte territory in primary motor cortex (t-test, p=0.712). (E) Density of vgat1+ terminals per 100 μm2 in striatum of mouse and rhesus macaque (Nmouse=4, Nastrocytes=12, Nimages=36; Nrhesus macaque=2, Nastrocytes=8, Nimages=24; t-test with Welch’s correction, p<0.0001). (F) Number of vgat1+ terminals per astrocyte territory in striatum (Mann-Whitney, p<0.0001). All scalebars 20 μm.
Figure 6.
Figure 6.. Spatial relationship between astrocyte processes and neuronal synapses.
(A) Schematic of experimental procedure. (B-D) Representative examples of astrocyte-synapse interactions. Astrocyte (red), axon terminal (blue), dendrite or dendritic spine (yellow). The type of synapses formed by the blue terminals are asymmetric in B and D, and symmetric in C. Scalebars are 1μm. (E) Distribution of the types of astrocyte-synapse contacts in mouse and rhesus macaque motor cortex (Nmouse=3, Nsynapses=166; Nrhesus macaque=2, Nsynapses=141; Chi-square on raw counts, p=0.8256). (F) Cleft-associated astrocyte processes were measured parallel to the synapse (Nmouse=3, Nsynapses=115; Nrhesus macaque=2, Nsynapses= 94; Mann-Whitney, p=0.017). (G) Distribution of asymmetric and symmetric synapses of all astrocyte-synaptic contacts. (H) Distribution of astrocyte contact types for identified asymmetric synapses (Nmouse=3,Nsynapses=76; Nrhesus macaque=2,Nsynapses=62; Fisher’s exact on raw counts, p=0.2853). (I) Distribution of astrocyte contact types for identified symmetric synapses (Nmouse=3, Nsynapses=18; Nrhesus macaque=2, Nsynapses=23; Fisher’s exact on raw counts, p=0.8163).

References

    1. Adamsky A, Kol A, Kreisel T, Doron A, Ozeri-Engelhard N, Melcer T, Refaeli R, Horn H, Regev L, Groysman M, London M, Goshen I, 2018. Astrocytic Activation Generates De Novo Neuronal Potentiation and Memory Enhancement. Cell 174, 59–71.e14. 10.1016/j.cell.2018.05.002 - DOI - PubMed
    1. Allen NJ, Eroglu C, 2017. Cell Biology of Astrocyte-Synapse Interactions. Neuron 96, 697–708. 10.1016/j.neuron.2017.09.056 - DOI - PMC - PubMed
    1. Allen NJ, Lyons DA, 2018. Glia as Architects of Central Nervous System Formation and Function. Science 362, 181–185. 10.1126/science.aat0473 - DOI - PMC - PubMed
    1. Araque A, Carmignoto G, Haydon PG, Oliet SHR, Robitaille R, Volterra A, 2014. Gliotransmitters Travel in Time and Space. Neuron 81, 728–739. 10.1016/j.neuron.2014.02.007 - DOI - PMC - PubMed
    1. Aten S, Kiyoshi CM, Arzola EP, Patterson JA, Taylor AT, Du Y, Guiher AM, Philip M, Camacho EG, Mediratta D, Collins K, Boni K, Garcia SA, Kumar R, Drake AN, Hegazi A, Trank L, Benson E, Kidd G, Terman D, Zhou M, 2022. Ultrastructural view of astrocyte arborization, astrocyte-astrocyte and astrocyte-synapse contacts, intracellular vesicle-like structures, and mitochondrial network. Prog. Neurobiol 213, 102264. 10.1016/j.pneurobio.2022.102264 - DOI - PMC - PubMed

LinkOut - more resources