

Stat3-mediated Atg7 expression regulates anti-tumor immunity in mouse melanoma
- PMID: 39235510
- PMCID: PMC11377374
- DOI: 10.1007/s00262-024-03804-4
Stat3-mediated Atg7 expression regulates anti-tumor immunity in mouse melanoma
Abstract
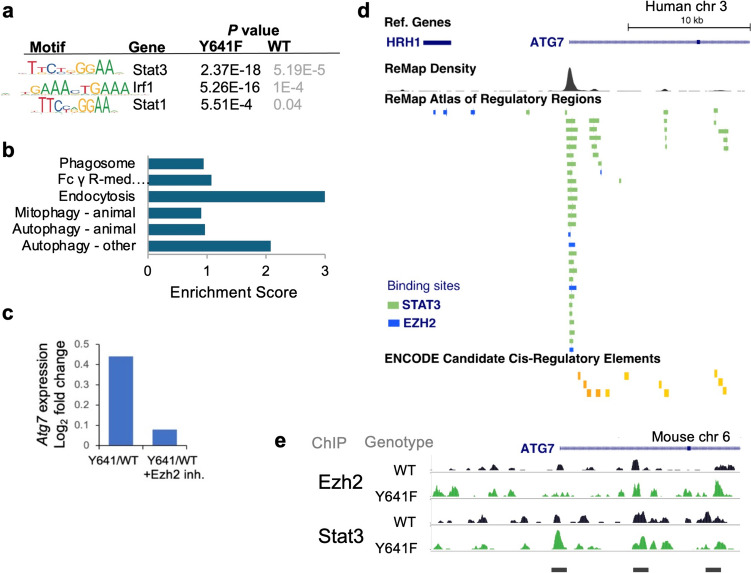
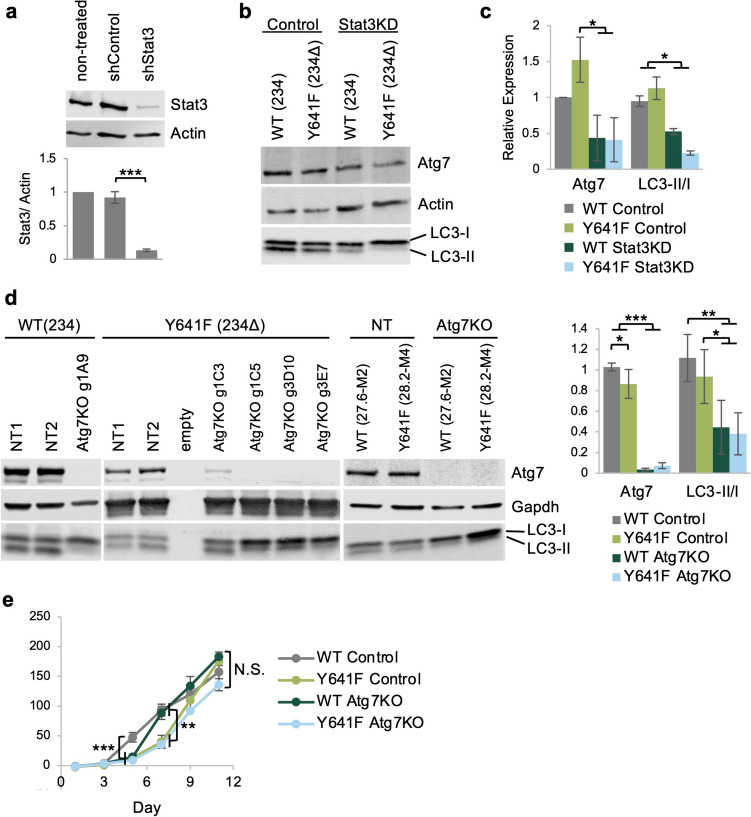
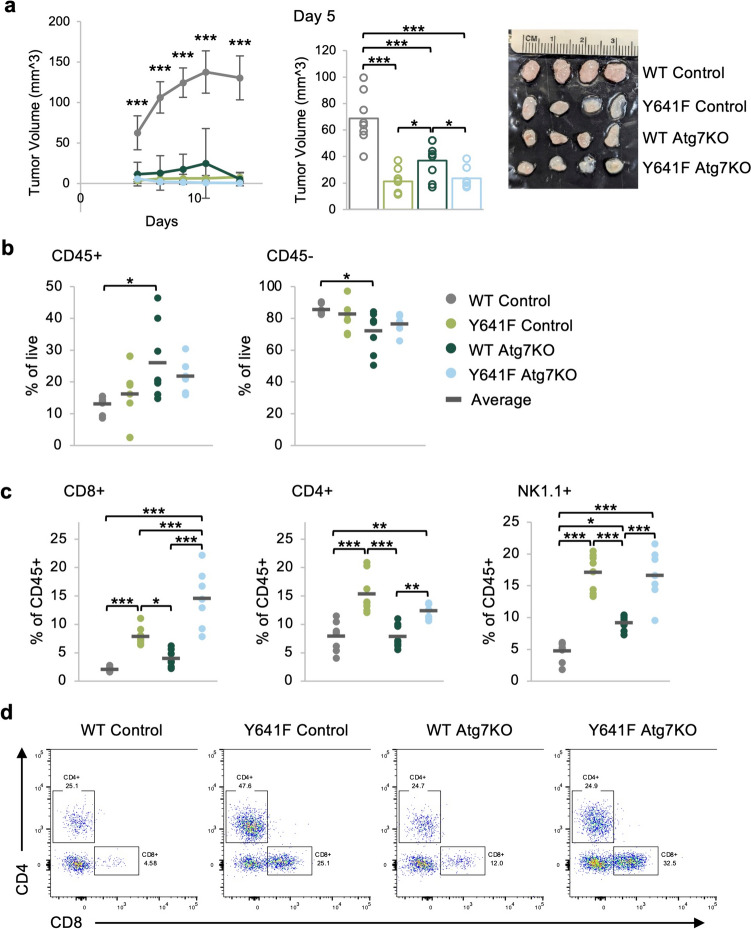
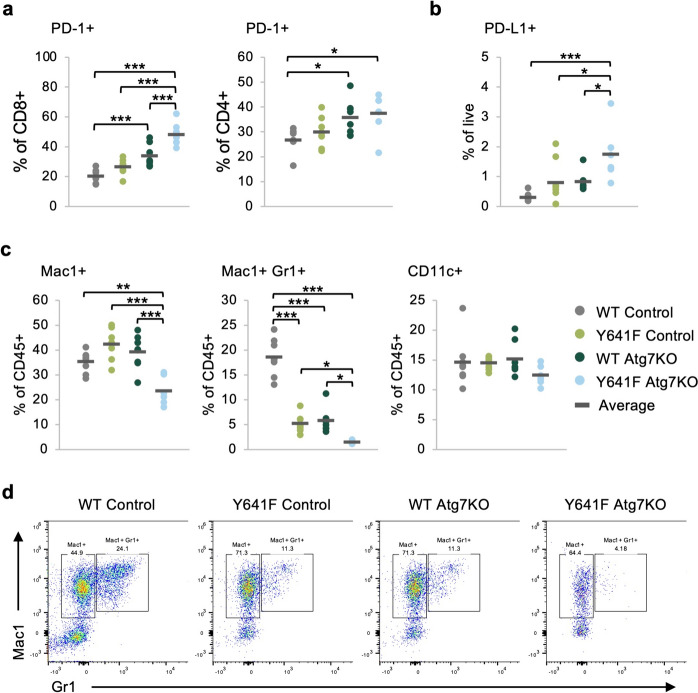
Epigenetic modifications to DNA and chromatin control oncogenic and tumor-suppressive mechanisms in melanoma. Ezh2, the catalytic component of the Polycomb Repressive Complex 2 (PRC2), which mediates methylation of lysine 27 on histone 3 (H3K27me3), can regulate both melanoma initiation and progression. We previously found that mutant Ezh2Y641F interacts with the immune regulator Stat3 and together they affect anti-tumor immunity. However, given the numerous downstream targets and pathways affected by Ezh2, many mechanisms that determine its oncogenic activity remain largely unexplored. Using genetically engineered mouse models, we further investigated the role of pathways downstream of Ezh2 in melanoma carcinogenesis and identified significant enrichment in several autophagy signatures, along with increased expression of autophagy regulators, such as Atg7. In this study, we investigated the effect of Atg7 on melanoma growth and tumor immunity within the context of a wild-type or Ezh2Y641F epigenetic state. We found that the Atg7 locus is controlled by multiple Ezh2 and Stat3 binding sites, Atg7 expression is dependent on Stat3 expression, and that deletion of Atg7 slows down melanoma cell growth in vivo, but not in vitro. Atg7 deletion also results in increased CD8 + T cells in Ezh2Y641F melanomas and reduced myelosuppressive cell infiltration in the tumor microenvironment, particularly in Ezh2WT melanomas, suggesting a strong immune system contribution in the role of Atg7 in melanoma progression. These findings highlight the complex interplay between genetic mutations, epigenetic regulators, and autophagy in shaping tumor immunity in melanoma.
Keywords: Atg7; Autophagy; Melanoma; Tumor-immune response.
© 2024. The Author(s).
Conflict of interest statement
The authors declare no competing interests.
Figures
Update of
-
Stat3-mediated Atg7 expression enhances anti-tumor immunity in melanoma.bioRxiv [Preprint]. 2024 Jun 12:2024.06.10.598284. doi: 10.1101/2024.06.10.598284. bioRxiv. 2024. Update in: Cancer Immunol Immunother. 2024 Sep 5;73(11):218. doi: 10.1007/s00262-024-03804-4. PMID: 38915518 Free PMC article. Updated. Preprint.
Similar articles
-
Stat3-mediated Atg7 expression enhances anti-tumor immunity in melanoma.bioRxiv [Preprint]. 2024 Jun 12:2024.06.10.598284. doi: 10.1101/2024.06.10.598284. bioRxiv. 2024. Update in: Cancer Immunol Immunother. 2024 Sep 5;73(11):218. doi: 10.1007/s00262-024-03804-4. PMID: 38915518 Free PMC article. Updated. Preprint.
-
Tetrandrine augments melanoma cell immunogenicity via dual inhibition of autophagic flux and proteasomal activity enhancing MHC-I presentation.Acta Pharmacol Sin. 2025 Jul;46(7):2056-2072. doi: 10.1038/s41401-025-01507-9. Epub 2025 Feb 27. Acta Pharmacol Sin. 2025. PMID: 40016522 Free PMC article.
-
Constitutive expression of the transcriptional co-activator IκBζ promotes melanoma growth and immunotherapy resistance.Nat Commun. 2025 Jun 25;16(1):5387. doi: 10.1038/s41467-025-60929-5. Nat Commun. 2025. PMID: 40562773 Free PMC article.
-
EZH2 in digestive system cancers: Epigenetic regulation, oncogenic interactions, and therapeutic potential.Exp Cell Res. 2025 Jul 15;450(2):114648. doi: 10.1016/j.yexcr.2025.114648. Epub 2025 Jun 10. Exp Cell Res. 2025. PMID: 40499609 Review.
-
The dual functionality of EZH2 in cardiovascular disease: Bridging cancer biology and cardiac pathophysiology through epigenetic regulation, metabolic reprogramming, and novel therapeutic interventions.Curr Probl Cardiol. 2025 Sep;50(9):103104. doi: 10.1016/j.cpcardiol.2025.103104. Epub 2025 Jun 13. Curr Probl Cardiol. 2025. PMID: 40517834 Review.
Cited by
-
Developmental stage and cellular context determine oncogenic and molecular outcomes of Ezh2 Y641F mutation in hematopoiesis.Blood Neoplasia. 2025 Jul 11;2(3):100137. doi: 10.1016/j.bneo.2025.100137. eCollection 2025 Aug. Blood Neoplasia. 2025. PMID: 40823663 Free PMC article.
-
Developmental Stage and Cellular Context Determine Oncogenic and Molecular Outcomes of Ezh2 Y641F Mutation in Hematopoiesis.bioRxiv [Preprint]. 2024 Nov 27:2024.11.14.622807. doi: 10.1101/2024.11.14.622807. bioRxiv. 2024. Update in: Blood Neoplasia. 2025 Jul 11;2(3):100137. doi: 10.1016/j.bneo.2025.100137. PMID: 39605688 Free PMC article. Updated. Preprint.
References
-
- Villanueva L, Álvarez-Errico D, Esteller M (2020) The contribution of epigenetics to cancer immunotherapy. Trends Immunol 41:676–691 - PubMed
-
- Hogg SJ, Beavis PA, Dawson MA, Johnstone RW (2020) Targeting the epigenetic regulation of antitumour immunity. Nat Rev Drug Discov 19:776–800 - PubMed
-
- Jones PA, Baylin SB (2002) The fundamental role of epigenetic events in cancer. Nat Rev Genet 3:415–428 - PubMed
MeSH terms
Substances
Grants and funding
LinkOut - more resources
Full Text Sources
Research Materials
Miscellaneous
