. 2024 Oct 7;221(10):e20231143.
doi: 10.1084/jem.20231143. Epub 2024 Sep 5.

SETD1B mutations confer apoptosis resistance and BCL2 independence in B cell lymphoma

Affiliations

SETD1B mutations confer apoptosis resistance and BCL2 independence in B cell lymphoma

Ana Portelinha et al. J Exp Med. .

Abstract

The translocation t(14;18) activates BCL2 and is considered the initiating genetic lesion in most follicular lymphomas (FL). Surprisingly, FL patients fail to respond to the BCL2 inhibitor, Venetoclax. We show that mutations and deletions affecting the histone lysine methyltransferase SETD1B (KMT2G) occur in 7% of FLs and 16% of diffuse large B cell lymphomas (DLBCL). Deficiency in SETD1B confers striking resistance to Venetoclax and an experimental MCL-1 inhibitor. SETD1B also acts as a tumor suppressor and cooperates with the loss of KMT2D in lymphoma development in vivo. Consistently, loss of SETD1B in human lymphomas typically coincides with loss of KMT2D. Mechanistically, SETD1B is required for the expression of several proapoptotic BCL2 family proteins. Conversely, inhibitors of the KDM5 histone H3K4 demethylases restore BIM and BIK expression and synergize with Venetoclax in SETD1B-deficient lymphomas. These results establish SETD1B as an epigenetic regulator of cell death and reveal a pharmacological strategy to augment Venetoclax sensitivity in lymphoma.


Conflict of interest statement

Disclosures: N.K. Aryal works for AstraZeneca and may own stocks of the company. O. Tavana reported personal fees from AstraZeneca outside the submitted work; and being an employee and shareholder of AstraZeneca. A. Dogan reported research support for AstraZeneca, not related to this work. A. Younes reported being currently employed by AstraZeneca. A.M. Melnick reported grants from Janssen, Daiichi Sankyo, Epizyme, AstraZeneca, and Treeline Biosciences during the conduct of the study; and personal fees from Treeline Biosciences and Ipsen outside the submitted work. H-.G. Wendel reported grants from AstraZeneca during the conduct of the study. No other disclosures were reported.

Figures
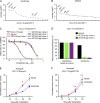
Figure 1.
Figure 1.
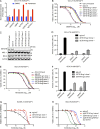
Loss of SETD1B impairs response to BCL2 and MCL-1 inhibition. (A and B) Dot plots illustrate the top candidate genes identified through CRISPR screening for (A) Venetoclax and (B) MCL-1 inhibitor (S63845). Genes are ranked by the average Log2FC (FC after treatment vs. before treatment) of all significantly enriched sgRNAs targeting the respective gene. (C) IC50 curves depict the response of OCI-LY19 cells to Venetoclax. The cells carry either Cas9 alone, Cas9 with sgRNA targeting LacZ (sgLacZ), or sgRNAs targeting SETD1B (sgSETD1B, single-cell clones without detectable SETD1B protein) generated from two independent sgRNAs. Values represent the average of three independent dose-titration curves (n = 3). (D) Bar graphs displaying measurements of mitochondrial cytochrome c release, reflecting mitochondrial depolarization, following treatment with DMSO or Venetoclax. Alamethicin treatment triggers the complete release of mitochondrial cytochrome c (100% mitochondrial depolarization) and serves as a positive control. (E) Relative growth curve of xenografted OCI-LY19; sgLacZ treated with vehicle (n = 5) or 100 mg/kg of Venetoclax (n = 5). P value was calculated using Student’s t test (*P < 0.05). (F) Relative growth curve of xenografted OCI-LY19;sgSETD1B (sg1; clone 1) treated with vehicle (n = 5) or Venetoclax (n = 5). P value was calculated using Student’s t test (n.s.: not significant).
Figure S1.
Figure S1.
Funtional analysis of SETD1B loss in DLBCL cell lines. (A) Bar graphs displaying the validation of the CRISPR-cas9 screen hits with individual sgRNA by cell competition assay. OCI-LY19 cells were partially transduced with sgRNA targeting top candidate genes from the genome-wide screening. sgRNAs co-expressing tRFP (turbo-red fluorescent protein) and the percentages of tRFP-positive cells were measured by flow cytometry. Cells were treated with DMSO or 100 nmol Venetoclax for 3 days and recovered for 3–5 days and the treatment and recovery cycle was repeated once. The percentages of tRFP-positive cells after treatment were normalized to before treatment as FC to indicate the Venetoclax resistance of cells transduced with sgRNAs targeting these candidate genes. Results were represented as mean ± SD (n = 3). (B) IC50 curves of MCL-1 inhibitor, S63845, in OCI-LY19 cells carrying only Cas9, or Cas9; sgLacZ, or Cas9; sgSETD1B single-cell clones from two independent sgRNAs. Values represent the average of three independent dose-titration curves (n = 3). (C) Representative immunoblotting of OCI-LY19; sgLacZ and OCI-LY19; sgSETD1B clones were probed with SETD1B and BCL2 family proteins. β-Actin was used as a loading control. Data representative of at least two independent experiments are shown. MW, molecular weight in kD. (D) Annexin V analysis of OCI-LY19; sgLacZ and OCI-LY19; sgSETD1B clones treated with DMSO or 2.5 μM Venetoclax. Results were represented as mean ± SD (n = 3). (E) IC50 curves of Venetoclax in OCI-LY8 cells carrying only Cas9, or Cas9; sgLacZ, or Cas9; sgSETD1B single-cell clones from two independent sgRNAs. Values represent the average of three independent dose-titration curves (n = 3). (F) Annexin V analysis of OCI-LY8; sgSETD1B and OCI-LY8; sgLacZ treated with DMSO or 2.5 μM of Venetoclax. Values represent means and SD (n = 3). (G) IC50 curves of SU-DHL-10 isogenic cell lines with (sgSETD1B clone 1 and clone 2) or without (sgLacZ) SETD1B mutations after 72 h of Venetoclax treatment. Values represent means and SD (n = 3). (H) IC50 curves of OCI-LY8 isogenic cell lines with SETD1B (sgSETD1B), KMT2D (sgKMT2D), or with SETD1B and KMT2D mutations (sgSETD1B;KMT2D) after 72 h of Venetoclax treatment. Values represent means and SD (n = 3). Source data are available for this figure: SourceData FS1.
Figure 2.
Figure 2.
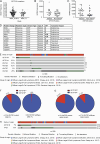
SETD1B is frequently mutated or depleted in FL and DLBCL. (A) Schematic overview illustrating SETD1B mutations in FL and DLBCL. The mutations span all functional domains of the protein, with a notable hotspot mutation resulting in a premature stop codon at amino acid 30 (H8Pfs*30). (B and C) (B) Oncoprint representation of an integrated annotation of somatic mutations and DNA copy-number changes of KMT2 family genes in 216 FL and (C) 248 DLBCL samples from MSK database. SETD1B mutations showed a propensity to co-occur with KMT2D mutations (FL, P = 0.008; DLBCL, P = 0.064). P values were calculated by two-sided Fisher Exact test. (D and E) (D) Oncoprint representation of an integrated annotation of somatic mutations and DNA copy-number changes of SETD1B and TP53 genes in 216 FL and (E) 248 DLBCL from MSK database. SETD1B mutations showed a trend (non-significant) to a mutual exclusive relationship with loss of TP53 (FL, P = 0.256; DLBCL, P = 0.126). P values were calculated by two-sided Fisher Exact test. All samples are arranged in columns with genes labeled along rows. Only samples with alterations are shown.
Figure S2.
Figure S2.
Comprehensive analysis of SETD1B mutation frequency in lymphoma across multiple studies. (A) Estimated allele frequency in tumor patient samples from MSK DLBCL and MSK FL studies. (B and C) Dot plot representing the (B) SETD1B and (C) KMT2D mRNA expression levels in altered and non-altered DLBCL patient samples (TCGA, Pan Cancer Atlas, Sanchez-Vega et al., 2018). (D) Table representing SIFT scores for SETD1B missense mutations found in TCGA, PanCancer Atlas database (Sanchez-Vega et al., 2018). (E) Oncoprint representation of mutation status of KMT2 family genes in 1,295 samples from published DLBCL sequencing studies. Samples are arranged in columns with genes labeled along rows. Only samples with alterations are shown. (F and G) Pie charts showing the frequency of SETD1B mutations in a cohort of (F) FL and (G) DLBCL patients with wild-type or mutated KMT2D. Patients with KMT2D mutations have a higher likelihood of having mutations in SETD1B in both cohorts. (H) Oncoprint representation of mutation status of SETD1B and TP53 genes in 1,295 samples from published DLBCL sequencing studies (P = 0.55). P values were calculated with two-sided Fisher Exact test.
Figure S3.
Figure S3.
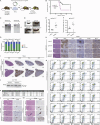
Combined loss of SETD1B and KMT2D leads to a more aggressive disease. (A) Illustration of FL adoptive transfer model based on the VavP-BCL2 transgenic and retroviral transduction of HPCs followed by reconstitution in lethally irradiated, syngeneic, female mice. (B) Survival curves for mice harboring sgRNA targeting LacZ (sgLacZ) and mice carrying sgRNA targeting Setd1b (sgSetd1b) (***P = 0.005). P value was calculated using Log-rank (Mantel–Cox) test. (C) Detection of genomic editing of Setd1b sgRNAs by T7 endonuclease I (T7E1) assay. The target fragments were amplified by PCR from genomic DNA from mouse tumors. Arrows indicate the digested fragments by T7EI. Data representative of at least two independent experiments are shown. (D) Representative spleens taken from each mouse group. Spleens from VavP-Bcl2; sgSetd1b (n = 27), VavP-Bcl2; sgKmt2d (n = 8), and VavP-Bcl2; sgkmt2d+sgSetd1b (n = 6) were enlarged compared with the control group, VavP-Bcl2; sgLacZ (n = 22). (E and F) Dot plot graph showing the percentage of positive transduced VavP-Bcl2 HSCs (prior to injection into mice) and splenic lymphoma cells (after injection and disease), indicating cells harboring (E) sgSetd1b-RFP (sgSetd1bRFP) or (F) sgKmt2d-GFP (sgKmt2dGFP) plasmids, (n = 8). (G) Stacked bar graph showing RFP and GFP-positive transduced VavP-Bcl2 HSCs (prior to injection into mice) and splenic lymphoma cells (after injection and disease), indicating cells harboring sgSetd1bRFP, sgKmt2dGFP plasmids or both sgSetd1bRFP and sgKmt2dGFP (RFP; GFP) (n = 3). (H) Additional immunohistochemistry serial micrographs of VavP-Bcl2 spleen tissues extracted from recipient mice upon sacrifice. VavP-Bcl2; sgLacZ, VavP-Bcl2; sgSetd1b, VavP-Bcl2; sgKmt2d, and VavP-Bcl2; sgSetd1b+Kmt2d were stained with H&E, B220, Ki67, PNA, TUNEL, and BCL6 of liver tissues extracted from recipient mice upon sacrifice (n = 3 per group). Insets are 3× magnified. Scale bar, 200 μm, 500 μm. (I) Representative histological micrographs of VavP-Bcl2; sgLacZ versus VavP-Bcl2; sgSetd1b, stained with H&E, B220, PNA, and Ki67 (n = 3 per group). Scale bar, 1 mm. (J) DNA gel representing Ig heavy chain variable region (IgVH) rearrangements in B220+ cells isolated from VavP-Bcl2;sgLacZ and VavP-Bcl2;sgSetd1b spleens. Data representative of two independent experiments are shown. (K) Table summarizing the results of SHM analysis in DNA collected from VavP-Bcl2;sgSetd1b to VavP-Bcl2;sgLacZ tumors. (L and M) H&E and B220 staining of kidney (M) and liver (L) tissues extracted from recipient mice upon sacrifice. n = 3 per group. (N) Flow cytometry analysis of the cellular composition of splenic tumor cells from three mice in each genotype, comparing VavP-Bcl2;sgSetd1b to VavP-Bcl2;sgLacZ. Source data are available for this figure: SourceData FS3.
Figure 3.
Figure 3.
SETD1B is a tumor suppressor for B cell lymphoma. (A) Tumor latencies in animals receiving VavP-Bcl2/Cas9 transgenic HPCs transduced with sgRNA targeting LacZ (sgLacZ, black, n = 22) or sgRNA targeting Setd1b and/or Kmt2d (sgSetd1b, green, n = 19; P = 0.011; sgKmt2d, blue n = 8, P = 0.026; sgKmt2d+sgSetd1b, red, n = 10, P < 0.0001). P values were calculated using the Log-rank (Mantel–Cox) test. *P < 0.05, ****P < 0.0001. (B) Bar graphs showing the spleen/body weight ratio of recipient mice carrying sgLacZ (n = 22) or sgSetd1b (n = 27, pooled from sg1 and sg2, P < 0.0001), sgKmt2d (n = 8, P < 0.008), and sgSetd1B+sgKmt2d (n = 6, P < 0.0009). P values were calculated by two-way ANOVA followed by Tukey’s multiple comparisons test. **P < 0.01, ***P < 0.001, ****P < 0.0001. (C) Representative immunohistochemistry serial micrographs of VavP-Bcl2 spleen tissues extracted from recipient mice upon sacrifice VavP-Bcl2;sgLacZ, VavP-Bcl2;sgSetd1b, VavP-Bcl2;sgKmt2d, and VavP-Bcl2; sgSetd1b+Kmt2d were stained with H&E, B220, Ki67, PNA, TUNEL, and BCL6 (n = 3). Scale bar, 200, 500 μm. (D) Tumor volume growth curve of xenografted OCI-LY19;sgSETD1B and OCI-LY19;sgLacZ. P values were calculated by Student’s t test. ****P < 0.0001; n = 5. (E) Graph showing tumor weight comparison of OCI-LY19; sgSETD1B and OCI-LY19; sgLacZ. P values were calculated by Student’s t test. ***P = 0.0022; n = 5.
Figure 4.
Figure 4.
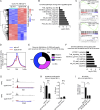
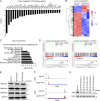
SETD1B inactivation results in dysregulation of gene expression and H3K4 trimethylation. (A) Heatmap illustrating the differential gene expression of significantly differentially expressed genes (Log2FC > 0.5, FDR < 0.05) between OCI-LY19 cells (KMT2Dmut) carrying sgLacZ (n = 3) or sgSETD1B (sg1 clone 1) (n = 3). (B) Bar graphs demonstrating the top enriched gene sets within the hallmark dataset from MsigDB. The x-axis represents the differential gene expression’s FDR between SETD1B knockout and control. (C) Enrichment plot for P53 pathway and apoptosis hallmark gene sets of GSEA comparing OCI-LY19;sgSETD1B and OCI-LY19;sgLacZ. NES, normalized enrichment score. (D) Histograms showing the average H3K4me3 read density plot of ChIP-seq from SETD1B mutant (sgSETD1B) and OCI-LY19 control (sgLacZ). (E) Doughnut chart demonstrating the genomic distribution of H3K4me3-bound peaks with at least 30% loss (P < 0.05, peak numbers n = 1,553) in OCI-LY19 sgSETD1B cells versus sgLacZ cells located at the promoter (defined as ± 2 kb windows centered on TSS), intragenic (inside gene body), and intergenic (up- or downstream of the closest gene but not overlapping with the promoter). (F) Bar graphs representing the GSEA in significantly differentially expressed genes, as compared to the hallmark dataset (MsigDB). (G) Normalized Integrative Genomics Viewer (IGV) read-density tracks of H3K4me3 ChIP-seq peaks at the loci of representative genes (BIK and CD40) from the ChIP-seq experiments. Signals are plotted on a normalized read per million (RPM) bases. (H) ChIP-qPCR analysis of H3K4me3 loss in the promoter of BIK in OCI-LY19; sgSETD1B clones compared with control cells (sgLacZ). BIK downstream locus with no detectable H3K4me3 peaks in either sgSETD1B clones or control cells (NTC). Values represent means and SD. P values were calculated by Student’s t test. ****P < 0.0001, n = 3. (I) Bar graph representing the relative expression of BIK in OCI-LY19 sgSETD1B vs. clones OCI-LY19;sgLacZ treated with either DMSO or JIB-04. Values represent means and SD. P values were calculated by two-way ANOVA followed by Tukey’s multiple comparisons test. ****P < 0.0001; n = 3.
Figure S4.
Figure S4.
Changes in gene expression and H3K4 trimethylation levels in SETD1B-deficient cells. (A) Direct TP53 targets genes derived from downregulated signatures as shown in Fig. 4 B. (B) Heatmap displaying the differential gene expression analysis of the top significantly differentially expressed genes (Log2FC > 1, FDR < 0.05) between OCI-LY8 cells carrying sgLacZ (n = 3) or sgSETD1B (sg1 clone 1) (n = 3). (C) Computed overlay of the significantly differentially expressed genes as compared with the hallmark pathways from MsigDB. (D) Enrichment plot for P53 pathway and apoptosis hallmark gene sets of GSEA comparing OCI-LY8; sgSETD1B and OCI-LY8; sgLacZ. NES, normalized enrichment score. (E) Western blots of OCI-LY19; sgLacZ and OCI-LY19; sgSETD1B (sg1 and sg2) cell lines blotted with H3K4 mono-, di- and tri-methylated and total H3 antibodies. Data representative of two independent experiments are shown. MW, molecular weight in kD. (F) Normalized IGV read-density tracks of H3K4me3 ChIP-seq peaks at the loci of representative genes (INFGR1 and CASP1) from the ChIP-seq experiments. Signals are plotted on a normalized read per million (RPM) bases. (G) Representative western blot analysis of BIK protein expression in OCI-LY19; sgLacZ and OCI-LY19; sgSETD1B clones. β-Actin was used as a loading control. Data representative of two independent experiments are shown. MW, molecular weight in kD. Source data are available for this figure: SourceData FS4.
Figure S5.
Figure S5.
Venetoclax and JIB-04 treatment in lymphoma cells with BIM and BIK deficiency. (A) Bar graph representing JIB-04 IC50 values in cell lines with or without mutations in KMT2D after 72 h of JIB-04 treatment. Each bar represents the mean ± SD of two independent experiments, each time in triplicate (n = 3). (B) Dot plot comparing JIB-04 IC50 values in cell lines with or without mutations in KMT2D. Each dot represents the mean of two independent experiments, each time in triplicate. Cell viability was measured by CellTiter-Glo assay. P values were calculated by Student’s t test. ****P < 0.0001. (C) IC50 curves at 72 h of JIB-04 in OCI-LY8; sgLacZ or OCI-LY8; sgSETD1B single-cell clones. Results were represented as mean ± SD (n = 3). (D) Western blot analysis detection of the siRNA knockdown efficiency of BIK and BIM in OCI-LY19;sgSETD1B. β-Tubulin was used as the loading control. Data representative of two independent experiments are shown. MW, molecular weight in kD. (E) Bar graph showing the percentage of cell viability in OCI-LY19;sgSETD1B cells transfected with Control-siRNA, BIK-siRNA (2 μM), and BIM-siRNA (3 μM) after 72 h treatment with Venetoclax, JIB-04, or the combination of both compounds. Cell growth was assayed using the CellTiter-Glo Luminescent Cell Viability Assay Kit. Results were represented as mean ± SD (n = 3). P values were calculated by two-way ANOVA followed by Tukey’s multiple comparisons test, ***P = 0.007, n = 3. (F) Bar graph showing the percentage of cell viability in OCI-LY19;sgSETD1B cells transfected with Control-siRNA, BIK-siRNA (2 nM), or BIM-siRNA (3 nM) after 72 h treatment with Venetoclax, JIB-04, or the combination of both compounds. Cell growth was assayed using the CellTiter-Glo Luminescent Cell Viability Assay Kit. Results were represented as mean ± SD (n = 3). P values were calculated by two-way ANOVA followed by Tukey’s multiple comparisons test, ****P < 0.0001; n.s.: non-significant; n = 3. Source data are available for this figure: SourceData FS5.
Figure 5.
Figure 5.
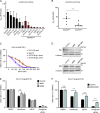
Combination benefit between BCL2 and KDM5-family inhibitors in SETD1B deficient lymphoma. (A) RT-qPCR analysis of the relative expression of BIK in OCI-LY19; sgSETD1B vs. OCI-LY19; sgLacZ cells treated with DMSO or 1 μM JIB-04 for 24 h. Results were represented as mean ± SD (n = 3). P values were calculated by two-way ANOVA followed by Tukey’s multiple comparisons test. ****P < 0.0001; n.s.: non-significant. (B) IC50 curves at 72 h of JIB-04 in OCI-LY19 cells carrying sgRNA targeting LacZ (sgLacZ) or SETD1B (sgSETD1b) knockout single-cell clone. Values represent the average of three independent dose-titration curves (n = 3). (C and D) Cell viability values in (C) OCI-LY19;sgSETD1B and (D) OCI-LY19;sgLacZ cell lines in response to Venetoclax and JIB-04 combined treatment for 72 h, as assessed by CellTiter-Glo assay. Values represent the average of three independent dose-titration curves (n = 3). Combination index at IC50 = 0.382 ± 0.014 calculated from the combination index equation algorithms (Chou, 2010) using CompuSyn software. (E and F) (E) Tumor volumes and (F) weight of OCI-LY19; sgSETD1B xenograft model treated with vehicle (p.o. QDx5); JIB-04 (50 mg/kg p.o. QDx5); Venetoclax (100 mg/kg p.o. QDx5); or with JIB-04 50 mg/kg p.o. QDx5 + Venetoclax 100 mg/kg p.o. QDx5. Treatment with JIB-04 started 5 days prior to the treatment with Venetoclax. Data represent the mean percentage ± SEM (n = 8 animal/group). P values were calculated by two-way ANOVA followed by Tukey’s multiple comparisons test. ****P < 0.0001; ***P = 0.0006.

References

    1. Agarwal, R., Chan Y.C., Tam C.S., Hunter T., Vassiliadis D., Teh C.E., Thijssen R., Yeh P., Wong S.Q., Ftouni S., et al. . 2019. Dynamic molecular monitoring reveals that SWI-SNF mutations mediate resistance to ibrutinib plus venetoclax in mantle cell lymphoma. Nat. Med. 25:119–129. 10.1038/s41591-018-0243-z - DOI - PubMed
    1. Araf, S., Okosun J., Koniali L., Fitzgibbon J., and Heward J.. 2016. Epigenetic dysregulation in follicular lymphoma. Epigenomics. 8:77–84. 10.2217/epi.15.96 - DOI - PMC - PubMed
    1. Bakhshi, T.J., and Georgel P.T.. 2020. Genetic and epigenetic determinants of diffuse large B-cell lymphoma. Blood Cancer J. 10:123. 10.1038/s41408-020-00389-w - DOI - PMC - PubMed
    1. Bledau, A.S., Schmidt K., Neumann K., Hill U., Ciotta G., Gupta A., Torres D.C., Fu J., Kranz A., Stewart A.F., and Anastassiadis K.. 2014. The H3K4 methyltransferase Setd1a is first required at the epiblast stage, whereas Setd1b becomes essential after gastrulation. Development. 141:1022–1035. 10.1242/dev.098152 - DOI - PubMed
    1. Blombery, P., Anderson M.A., Gong J.N., Thijssen R., Birkinshaw R.W., Thompson E.R., Teh C.E., Nguyen T., Xu Z., Flensburg C., et al. . 2019a. Acquisition of the recurrent Gly101Val mutation in BCL2 confers resistance to venetoclax in patients with progressive chronic lymphocytic leukemia. Cancer Discov. 9:342–353. 10.1158/2159-8290.CD-18-1119 - DOI - PubMed

MeSH terms