. 2024 Sep 5;73(11):221.
doi: 10.1007/s00262-024-03818-y.

Oncolytic virotherapy augments self-maintaining natural killer cell line cytotoxicity against neuroblastoma

Affiliations

Oncolytic virotherapy augments self-maintaining natural killer cell line cytotoxicity against neuroblastoma

Colin H Quinn et al. Cancer Immunol Immunother. .

Abstract

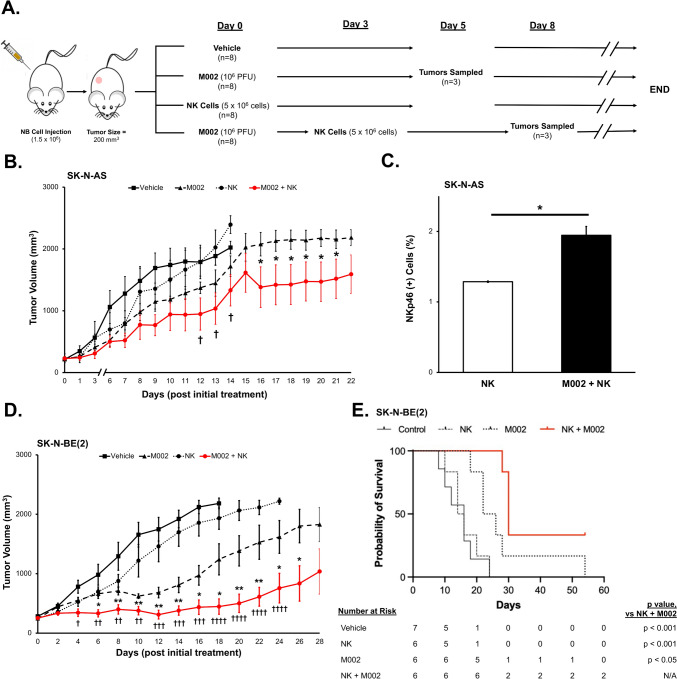
Background: Neuroblastoma is the most common extracranial solid tumor in children and accounts for 15% of pediatric cancer related deaths. Targeting neuroblastoma with immunotherapies has proven challenging due to a paucity of immune cells in the tumor microenvironment and the release of immunosuppressive cytokines by neuroblastoma tumor cells. We hypothesized that combining an oncolytic Herpes Simplex Virus (oHSV) with natural killer (NK) cells might overcome these barriers and incite tumor cell death.

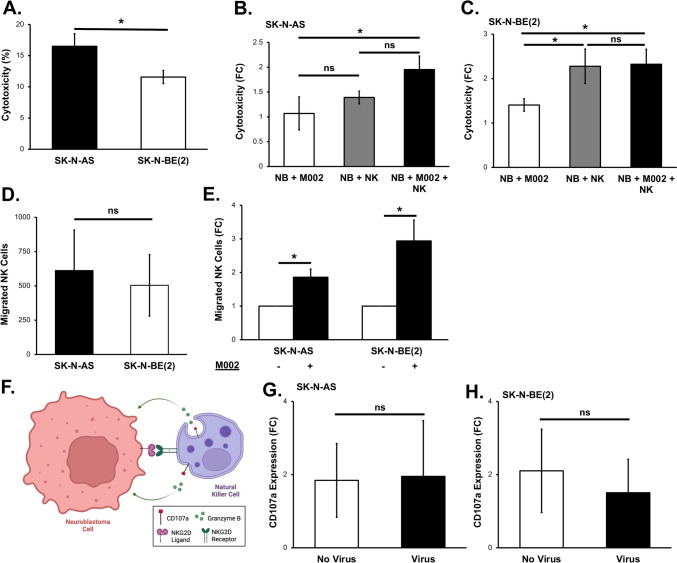
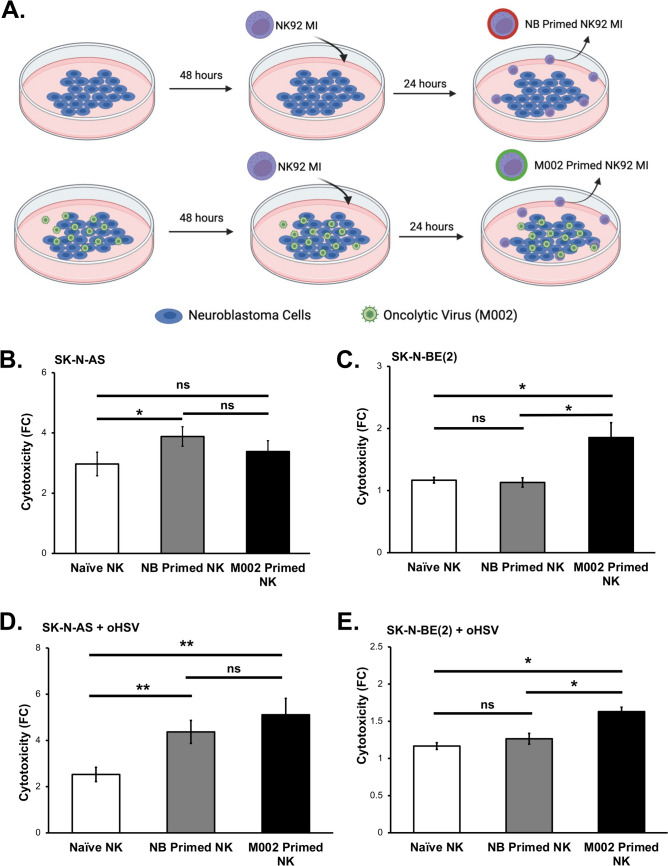
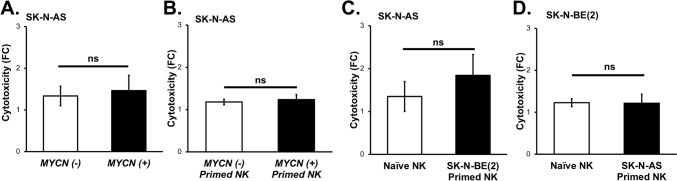
Methods: We utilized MYCN amplified and non-amplified neuroblastoma cell lines, the IL-12 expressing oHSV, M002, and the human NK cell line, NK-92 MI. We assessed the cytotoxicity of NK cells against neuroblastoma with and without M002 infection, the effects of M002 on NK cell priming, and the impact of M002 and priming on the migratory capacity and CD107a expression of NK cells. To test clinical applicability, we then investigated the effects of M002 and NK cells on neuroblastoma in vivo.

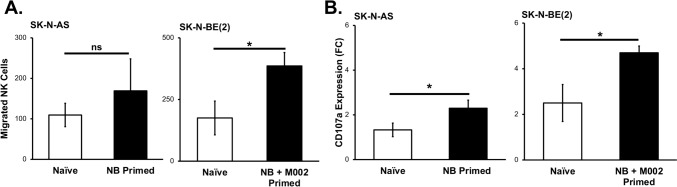
Results: NK cells were more attracted to neuroblastoma cells that were infected with M002. There was an increase in neuroblastoma cell death with the combination treatment of M002 and NK cells both in vitro and in vivo. Priming the NK cells enhanced their cytotoxicity, migratory capacity and CD107a expression.

Conclusions: To the best of our knowledge, these investigations are the first to demonstrate the effects of an oncolytic virus combined with self-maintaining NK cells in neuroblastoma and the priming effect of neuroblastoma on NK cells. The current studies provide a deeper understanding of the relation between NK cells and neuroblastoma and these data suggest that oHSV increases NK cell cytotoxicity towards neuroblastoma.

Keywords: Immunotherapy; Natural killer cells; Neuroblastoma; Oncolytic virus; Translational research.


Conflict of interest statement

Dr J.M. Markert holds equity in Aettis, Inc. (< 8%), a company that holds stocks of oncolytic virus and Treovir, Inc. (25%), a company holding intellectual property and funding clinical trials of oncolytic virus for pediatric brain tumors. A company that Dr J.M. Markert formerly held equity in (< 8%) Catherex, Inc., was purchased in a structured buyout. Dr J.M. Markert has served as a consultant for Imugene. He also holds a fraction of the IP associated with oncolytic virus C134, which is licensed by Mustang Biotech.

Figures

Fig. 1
Fig. 1
NK cells are cytotoxic and migrate toward neuroblastoma cells infected with oncolytic virus. A NK-92 MI (NK) cells (10:1, effector: target ratio, E:T) were added to SK-N-AS and SK-N-BE(2) neuroblastoma cells (5 × 105) and cytotoxicity assessed as described in Supplemental Fig. 1. NK-92 MI cells were significantly more cytotoxic toward SK-N-AS than SK-N-BE(2) cells (16.5 ± 2.0% vs. 11.6 ± 1.1%, SK-N-AS vs. SK-N-BE(2), p ≤ 0.05). B NK cells (10:1, E:T) were added to M002 (0.1 PFU/cell) infected or non-infected SK-N-AS cells and the fold change (FC) in cytotoxicity was compared to cells infected with virus alone. NK cell cytotoxicity was significantly greater in the SK-N-AS cells that were infected with M002 than those cells treated with NK cells alone. Viability was not affected by virus treatment. C NK cells (20:1, E:T) were added to M002 (0.5 PFU/cell) infected or non-infected SK-N-BE(2) cells (5 × 105) for 24 h and cytotoxicity measured. NK cell cytotoxicity was significantly increased in the SK-N-BE(2) cells with and without M002 infection. Virus infection did not significantly affect viability. D To study NK cell migration, NK cells were stained with CMFDA allowed to migrate through 3 µm pore inserts for 24 h toward plated neuroblastoma cells. The NK cells were collected from the bottom well and quantified with flow cytometry. There was no significant difference in NK cell migration between the SK-N-AS and SK-N-BE(2) cells (612 ± 296 vs. 504 ± 224 cells, SK-N-AS vs. SK-N-BE(2), p = 0.78). E Neuroblastoma cells were not infected (-, white bar) or infected (+ , black bar) with 1 PFU/cell of M002 for 24 h, and NK cell migration was measured as described in (D). Cell migration is reported as fold change. There was a significant increase in NK cells attracted to M002 infected SK-N-AS (left) and SK-N-BE(2) (right) cells compared to non-infected cells. F A diagram depicting NK cell-mediated cytotoxicity directed at neuroblastoma, demonstrates the rationale for using CD107a expression as a surrogate measure for granzyme B degranulation of NK cells. (G, H) Neuroblastoma cells were infected with M002 (0.1 PFU/cell for SK-N-AS, 0.5 PFU/cell for SK-N-BE(2)) for 24 h, co-cultured with NK cells (10:1, E:T) with CD107a for one hour and analyzed with flow cytometry. Negative controls included samples without anti-CD107a antibody and a sample of NK cells not in co-culture with neuroblastoma for baseline CD107a expression. There was no significant difference between CD107a expression in NK cells exposed to neuroblastoma or neuroblastoma infected with M002 for both SK-N-AS (G) or SK-N-BE(2) (H). Data represent results of at least three biologic replicates reported as mean ± SEM. Student’s t-test was used for statistical analysis. NB = neuroblastoma; NK = NK-92 MI natural killer cells; FC = fold change; ns = not significant. *p ≤ 0.05. Cartoon created with BioRender.com
Fig. 2
Fig. 2
Priming enhances natural killer cell directed cytotoxicity towards neuroblastoma. A Schema depicting methods of NK cell priming with neuroblastoma cells ± infection with M002. (B, C). Neuroblastoma cells were treated with either PBS or M002 (0.1 PFU/cell, SK-N-AS) (0.5 PFU/cell, SK-N-BE(2)) for 48 h then co-cultured with NK-92 MI cells (10:1, E:T, SK-N-AS) (20:1, E:T, SK-N-BE(2)) for 24 h. After priming, NK cells were collected and then co-cultured with neuroblastoma cells (24 h, SK-N-AS) (4 h, SK-N-BE(2)). B NK cells that were primed with SK-N-AS cells had a significant increase in cytotoxicity compared to naïve, non-primed NK cells. NK cells primed with M002 infected SK-N-AS cells were not significantly more cytotoxic than naïve or SK-N-AS primed NK cells. C NK cells primed with SK-N-BE(2) cells were not more cytotoxic than naïve, non-primed NK cells. NK cells primed with M002 infected SK-N-BE(2) were more cytotoxic than naïve, non-primed NK cells or NK cells primed with non-infected SK-N-BE(2) cells. (D, E) We investigated the ability of primed NK cells to attack neuroblastoma cells infected with M002. NK cells were primed as previously described (B, C) but NK cells were co-cultured with neuroblastoma cells that had been infected with M002 (0.1 PFU/cell, SK-N-AS) (0.5 PFU/cell, SK-N-BE(2)) for 24 h. D SK-N-AS primed and SK-N-AS + M002 primed NK cells demonstrated more cytotoxicity towards SK-N-AS infected with M002 than naïve NK cells. E SK-N-BE(2) primed NK cells did not have significantly increased cytotoxicity towards M002 infected SK-N-BE(2) cells. NK cells primed with SK-N-BE(2) + M002 demonstrated an increase in cytotoxicity towards M002 infected SK-N-BE(2) cells. Data represent at least three biologic replicates reported as mean ± SEM. Student’s t-test was used for statistical analysis. NB = neuroblastoma; NK = NK-92 MI natural killer cells; FC = fold change; ns = not significant. *p ≤ 0.05, **p ≤ 0.01. Cartoon created with BioRender.com
Fig. 3
Fig. 3
Priming increases NK cell migration and CD107a expression. A NK cells (10:1, E:T) were primed with SK-N-AS cells for 24 h, collected, and stained.These stained NK cells were added at an E:T of 10:1 in 100 μL of the media in which they had been primed, placed in the top of 3 µm pore inserts, and allowed to migrate for 24 h to SK-N-AS cells plated in the bottom of the well. The collected samples were analyzed for the number of migrated NK cells via flow cytometry. There was no significant increase in migration of NK cells that were primed compared to naïve, unprimed NK cells (left panel). For SK-N-BE(2) NK migration, NK cells (20:1, E:T) were primed with M002 infected (0.5 PFU/cell for 48 h) SK-N-BE(2) cells for 24 h and migration assessed as described. There was a significant increase in migration of NK cells primed with SK-N-BE(2) + M002 towards SK-N-BE(2) versus naïve NK cells (271 ± 61 cells vs. 175 ± 69 cells, M002 Primed NK vs. Naïve NK, p ≤ 0.05) (right panel). We next investigated whether there were changes in CD107a expression following priming. B NK cells were primed with SK-N-AS as previously described. NB primed NK and naïve (non-primed) NK cells (E:T, 10:1) were plated with SK-N-AS cells. After 1 h, CD107a cell surface expression was assessed with flow cytometry. Significantly more primed NK cells had cell surface expression of CD107a compared to naïve NK cells (left panel). NK cells were primed with SK-N-BE(2) + M002 as previously described. CD107a expression was assessed as per SK-N-AS, with the exception that NK cells were co-cultured at an E:T of 20:1. Significantly more primed NK cells expressed CD107a on their surface compared to naïve NK cells (right panel). Data represent at least three biologic replicates reported as mean ± SEM. Student’s t-test was used for statistical analysis. NB = neuroblastoma; NK = NK-92 MI natural killer cells; FC = fold change; ns = not significant. *p ≤ 0.05
Fig. 4
Fig. 4
MYCN does not affect NK priming. To determine if observed differences between SK-N-AS and SK-N-BE(2) cells could be attributed to MYCN amplification, we overexpressed MYCN in SK-N-AS cells. SK-N-AS cells (2 × 105) were transfected with an empty vector (EV) plasmid or a MYCN plasmid (OE) for 48 h. A SK-N-AS EV (MYCN (-)) and OE (MYCN ( +)) cells were stained, co-cultured for 24 h with NK cells (10:1, E:T), and cytotoxicity assessed with flow cytometry. There was no difference in NK cell cytotoxicity between MYCN (-) versus MYCN ( +) cells. B SK-N-AS EV (MYCN (-)) and OE (MYCN ( +)) cells were used to prime NK-92 MI cells (10:1, E:T) for 24 h. Primed NK cells were co-cultured for 24 h with non-transfected SK-N-AS cells, and cytotoxicity assessed with flow cytometry. There was no significant difference in cytotoxicity. C NK cells were primed with SK-N-BE(2) cells, co-cultured (10:1, E:T) with SK-N-AS cells, cytotoxicity assessed via flow cytometry. There was no significant change in cytotoxicity of SK-N-BE(2) primed NK cells compared to naïve NK cells towards SK-N-AS cells. D NK cells were primed with SK-N-AS cells, co-cultured (20:1, E:T) with SK-N-BE(2) cells, and cytotoxicity assessed via flow cytometry. There was no significant difference in cytotoxicity of SK-N-AS primed NK cells compared to naïve NK cells towards SK-N-BE(2) cells. Data represent at least three biologic replicates reported as mean ± SEM. Student’s t-test was used for statistical analysis. NB = neuroblastoma; NK = NK-92 MI natural killer cells; FC = fold change; ns = not significant
Fig. 5
Fig. 5
The combination of M002 and NK-92 MI significantly inhibits tumor growth in vivo. A A diagram of the in vivo experiment timeline. Mice were injected with SK-N-AS cells (1.5 × 106 cells in 25% Cultrex/RPMI). When tumors reached 200 mm3 each group (n = 8 animals per group) received intratumoral injection of (i) vehicle (50 μL of 10% glycerol in PBS) or (ii) M002 (106 PFU/50 μL), or (iii) peritumoral injection of NK cells (5 × 106 cells/100 μL of PBS). The combination treatment group (iv) received an initial intratumoral injection of M002 (106 PFU/50 μL) followed 72 h later with a peritumoral injection of NK cells (5 × 106 cells/100 μL of PBS). B Mice that received combination treatment with M002 and NK cells had significantly smaller tumors compared to mice that received monotherapy with NK cells (†p ≤ 0.05) or M002 (*p ≤ 0.05). C From each group, a random selection of mice (n = 3) was euthanized 5 days after the last treatment to evaluate NKp46 expression as a measure of NK cells within the tumor. Tumors were dissociated, a 100 μL sample from each tumor was stained anti-NKp46 antibody and samples analyzed via flow cytometry. Compared to the group receiving NK cells only (other groups correctly had no NKp46 signal), there was a significant increase in NKp46 expression of the group that received both M002 and NK cells. D Mice were injected with SK-N-BE(2) cells (1.5 × 106 cells in 25% Cultrex/RPMI). When tumors reached 200 mm3, mice were randomized to receive intratumoral injection of (i) vehicle (50 μL of 10% glycerol in PBS, n = 7) or (ii) M002 (106 PFU/50 μL, n = 6), or (iii) peritumoral injection of NK cells (5 × 106 cells/100 μL of PBS, n = 6). The combination treatment group (iv) received an initial intratumoral injection of M002 (106 PFU/50 μL) followed 72 h later with a peritumoral injection of NK cells (5 × 106 cells/100 μL of PBS, n = 6). Mice that received combination treatment with M002 and NK cells had significantly smaller tumors compared to mice that received monotherapy with NK cells (p ≤ 0.05, ††p ≤ 0.01, †††p ≤ 0.001, ††††p ≤ 0.0001) or M002 (*p ≤ 0.05, **p ≤ 0.01) E Kaplan–Meier graph of animal survival. By day 54 post-treatment, all mice in control, NK, and M002 groups had expired. Animals that received M002 + NK cells had significantly higher odds of survival compared to those that received vehicle, M002, or NK cells alone. Data reported as mean ± SEM and a Student’s t-test was used for statistical analysis. NK = NK-92 MI natural killer cells; FC = fold change; *p ≤ 0.05

References

    1. Siegel RL et al (2022) Cancer statistics, 2022. CA Cancer J Clin 72(1):7–33 - PubMed
    1. Irwin MS et al (2021) Revised neuroblastoma risk classification system: a report from the children’s oncology group. J Clin Oncol 39(29):3229–3241 - PMC - PubMed
    1. Yogev O et al (2019) In vivo modeling of chemoresistant neuroblastoma provides new insights into chemorefractory disease and metastasis. Cancer Res 79(20):5382–5393 - PubMed
    1. Senzer NN et al (2009) Phase II clinical trial of a granulocyte-macrophage colony-stimulating factor-encoding, second-generation oncolytic herpesvirus in patients with unresectable metastatic melanoma. J Clin Oncol 27(34):5763–5771 - PubMed
    1. Brandetti E et al (2017) MYCN is an immunosuppressive oncogene dampening the expression of ligands for NK-cell-activating receptors in human high-risk neuroblastoma. Oncoimmunology 6(6):e1316439 - PMC - PubMed

LinkOut - more resources