. 2024 Sep 1;5(9):1238-1250.
doi: 10.34067/KID.0000000000000516. Epub 2024 Sep 5.

Aryl Hydrocarbon Receptor Pathway Augments Peritoneal Fibrosis in a Murine CKD Model Exposed to Peritoneal Dialysate

Affiliations

Aryl Hydrocarbon Receptor Pathway Augments Peritoneal Fibrosis in a Murine CKD Model Exposed to Peritoneal Dialysate

Saran Lotfollahzadeh et al. Kidney360. .

Abstract

Key Points:

  1. CKD and high glucose–containing peritoneal dialysate alter peritoneal membrane contributing to peritoneal dialysis failure, with a poorly understood mechanism.

  2. CKD milieu activates the aryl hydrocarbon receptor pathway in the subperitoneal vasculature, increasing the peritoneal fibrosis and collagen deposition in humans and mice.

  3. An aryl hydrocarbon receptor inhibitor mitigates CKD and peritoneal dialysis–mediated peritoneal fibrosis, collagen deposition, and vasculogenesis in a mouse model.

Background: CKD is a proinflammatory and profibrotic condition and can independently alter the peritoneal membrane structure. Peritoneal dialysis (PD) results in profound alterations in the peritoneal membrane. The mechanisms contributing to the alterations of the peritoneal membrane structure in CKD milieu, along with PD, are poorly understood.

Methods: Here, we show that human CKD induces peritoneal membrane thickening, fibrosis, and collagen deposition and activates the aryl hydrocarbon receptor (AHR) pathway in the subperitoneal vasculature. Leveraging a novel model of PD in CKD mice, we confirm these CKD-induced changes in the peritoneal membrane, which are exacerbated on exposure to the peritoneal dialysate. Peritoneal dialysate further augmented the AHR activity in endothelial cells of peritoneal microvasculature in CKD mice.

Results: Treatment of CKD mice with an AHR inhibitor in peritoneal dialysate for 2 weeks resulted in a seven-fold reduction in AHR expression in the endothelial cells of subperitoneal capillaries, a five-fold decrease in subperitoneal space, and a nine-fold decrease in fibrosis and collagen deposition compared with vehicle-treated CKD mice. AHR inhibition reduced inflammation, subperitoneal neovascular areas, and its downstream target, tissue factor. The AHR inhibitor treatment normalized the peritoneal dialysate-induced proinflammatory and profibrotic cytokines, such as IL-6, monocyte chemoattractant protein-1, and macrophage inflammatory protein 1 levels, in CKD mice.

Conclusions: This study uncovers the activation of the AHR-cytokine axis in the endothelial cells of subperitoneal vessels in humans and mice with CKD, which is likely to prime the peritoneal membrane to peritoneal dialysate–mediated alterations. This study supports further exploration of AHR as a potential therapeutic target to preserve the structural and functional integrity of the peritoneal membrane in PD.


Conflict of interest statement

Disclosure forms, as provided by each author, are available with the online version of the article at http://links.lww.com/KN9/A610.

Figures

None
Graphical abstract
Figure 1
Figure 1
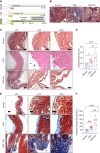
CKD induces profound changes in the human peritoneum. Paraffin-embedded sections of the peritoneum of non-CKD patients (A) and CKD (B) were stained with H&E. Representative images taken at different magnifications are shown. The scale bar shows 100 μm. (C and D) Representative images of paraffin-embedded sections of the peritoneum from non-CKD (C) and CKD patients (D) stained with modified Masson trichrome stain at different magnifications are shown. The scale bar shows 100 μm. (E and F) Representative images of paraffin-embedded sections of the peritoneum from non-CKD (E) and CKD (F) patients stained with Sirius red stain at different magnifications are shown. The scale bar shows 100 μm. (G) The peritoneal membrane was measured on H&E-stained slides using ImageJ at six to seven random areas per patient. The average peritoneal membrane thickening is shown. Error bar=SEM. Student's t test was used to compare two groups. ****P < 0.001. (H) The subperitoneal fibrosis was measured using trichrome stained slides at six to seven random areas per patient by defining a region of interest, and the integrated density was measured using ImageJ. The average integrated density of fibrosis normalized to area is shown. Error bar=SEM. The Student t test was used to compare two groups. ****P < 0.001. (I) The collagen deposition was measured using Sirius red stained slides at six to seven random areas per patient by defining a region of interest and integrated density was measured using ImageJ. The average integrated density of collagen normalized to area is shown. Error bar=SEM. The Student t test was used to compare two groups. ****P < 0.001. (J) Immunofluorescence staining of the peritoneum from CKD and non-CKD patients stained with CD31 and AHR primary antibodies. Alex Fluro secondary antibodies were used. Representative images at ×400 magnification are shown. The scale bar shows 100 μm. (K) Averages of the integrated density of AHR from three randomly selected images per patient. Error bars=SEM. The Student t test was used to compare two groups. **P = 0.0025. AHR, aryl hydrocarbon receptor; H&E, hematoxylin and eosin.
Figure 2
Figure 2
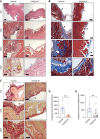
CKD induces profound changes in the peritoneum of a rodent model, which are further exacerbated by dialysate. (A) A group of 8- to 12-week-old female C57BL/6J mice were randomized to three groups (n=5/group). (B) Paraffin-embedded sections of kidneys harvested from the mice from three different groups were stained with modified Masson trichrome stain. Representative images taken at ×100 magnification are shown. Scale bar=100 μm. (C) Representative images of paraffin-embedded sections of peritoneum stained with H&E are shown. The black arrowheads point to peritoneal inflammation, and the black asterisk denotes an increase in the subperitoneal space. Scale bar=100 μm. (D) Averages of subperitoneal space of different mice detected from H&E images at ×100 magnification. Two randomly selected images per mouse were used. Error bars=SEM. ANOVA was used to compare all the groups (P = 0.003). The Student t test was used to compare two groups. *P = 0.0020, **P = 0.0084, ****P < 0.001. (E) Representative images of paraffin-embedded sections of peritoneum stained with modified Masson trichrome stain at different magnifications are shown. Scale bar=100 μm. (F) Averages of integrated density of peritoneal fibrosis of mice detected using Masson trichrome stained images at ×100 magnification. Two randomly selected images per mouse were used. Error bars=SEM. ANOVA was used to compare all the groups (P < 0.001). The Student t test was used to compare two groups. ***P = 0.0055, ****P < 0.001, ###P < 0.001.
Figure 3
Figure 3
CKD induces collagen deposition in the subperitoneal space and activates AHR signaling in the peritoneal vessels. (A) Representative images of paraffin-embedded sections of peritoneum stained with Sirius red stain at different magnifications are shown. Scale bar=100 μm. (B) Averages of integrated density of collagen deposition of mice detected using Masson trichrome stained images at ×100 magnification. Two randomly selected images per mouse were used. Error bars=SEM. ANOVA was used to compare all the groups (P = 0.004). The Student t test was used to compare two groups. **P < 0.001, ***P = 0.0355, ****P = 0.0071. (C) Paraffin-embedded sections of the peritoneum from two groups were stained with an AHR and CD31 (a marker for endothelial cells). Alex Fluro secondary antibodies were used. Representative images at ×400 magnification are shown. The scale bar shows 100 μm. (D) Averages of integrated density of AHR from two randomly selected images per mouse. Error bars=SEM. The Student t test was used to compare two groups. *P < 0.1, ***P = 0.0236.
Figure 4
Figure 4
AHR inhibition suppresses dialysate-induced peritoneal membrane alterations in CKD mice. (A) Representative images of paraffin-embedded sections of peritoneum stained with H&E stain from two groups. Scale bar=100 μm. Averages of integrated density of AHR from two randomly selected images per mouse. Error bars=SEM. The Student t test was used to compare two groups. (B) Representative images of paraffin-embedded sections of peritoneum stained with a Masson trichrome stain from two groups. Scale bar=100 μm. (C) Representative images of paraffin-embedded sections of peritoneum stained with a Sirius red stain at different magnifications are shown. Note that the skeletal muscles are cut in coronal and sagittal sections. Scale bar=100 μm. (D) Averages of the integrated density of subperitoneal fibrosis of mice detected using Masson trichrome-stained images at ×100 magnification. Two randomly selected images per mouse were used. Error bars=SEM. The Student t test was used to compare two groups. ***P = 0.003. (E) Averages of the integrated density of collagen deposition of mice detected using Sirius red stained images at ×100 magnification. Two randomly selected images per mouse were used. Error bars=SEM. The Student t test was used to compare two groups. **P = 0.00216.
Figure 5
Figure 5
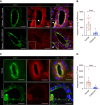
CH223191 suppresses AHR activity and its downstream target TF in the endothelial cells of peritoneal vascular of CKD mice exposed to peritoneal dialysate. Paraffin-embedded sections of the peritoneum from two groups (n=5 mice/group) were stained with AHR and CD31 antibodies (A) and TF and CD31 antibodies (C). Alex Fluro secondary antibodies were used. Representative images at ×400 magnification are shown. The scale bar shows 100 μm. (B and D) Averages of integrated density of AHR and TF from two randomly selected images per mouse. Error bars=SEM. The Student t test was used to compare two groups. ****P < 0.001. TF, tissue factor.
Figure 6
Figure 6
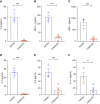
CH223191 downregulates the level of a host of proinflammatory and profibrotic cytokines. Averages of specific cytokine from the peritoneum of mice from both groups are shown. Error bars=SEM. The Student t test was used to compare the groups. (A) ***P = 0.0006. (B) ***P < 0.0009. (C) ***P = 0.0018. (D) ***P < 0.002. (E) ***P < 0.0087. (F) *P = 0.0009.

References

    1. Centers for Disease Control and Prevention. Chronic Kidney Disease in the United States, 2019. US Department of Health and Human Services, Centers for Disease Control and Prevention; 2019.
    1. Morelle J, Lambie M, Oberg CM, Davies S. The peritoneal membrane and its role in peritoneal dialysis. Clin J Am Soc Nephrol. 2024;19(2):244–253. doi:10.2215/CJN.0000000000000282 - DOI - PMC - PubMed
    1. Krediet RT. The peritoneal membrane in chronic peritoneal dialysis. Kidney Int. 1999;55(1):341–356. doi:10.1046/j.1523-1755.1999.00264.x - DOI - PubMed
    1. Yanez-Mo M Lara-Pezzi E Selgas R, et al. . Peritoneal dialysis and epithelial-to-mesenchymal transition of mesothelial cells. N Engl J Med. 2003;348(5):403–413. doi:10.1056/NEJMoa020809 - DOI - PubMed
    1. Flessner MF Credit K Henderson K, et al. . Peritoneal changes after exposure to sterile solutions by catheter. J Am Soc Nephrol. 2007;18(8):2294–2302. doi:10.1681/ASN.2006121417 - DOI - PubMed

MeSH terms

Substances