. 2024 Oct 22;9(20):e182469.
doi: 10.1172/jci.insight.182469.

Acquired immunostimulatory phenotype of migratory CD103+ DCs promotes alloimmunity following corneal transplantation

Acquired immunostimulatory phenotype of migratory CD103+ DCs promotes alloimmunity following corneal transplantation

Tomás Blanco et al. JCI Insight. .

Abstract

After transplantation, Th1-mediated immune rejection is the predominant cause of graft failure. Th1 cell sensitization occurs through complex and context-dependent interaction among antigen-presenting cell subsets, particularly CD11b+ DCs (DC2) and CD103+ DCs (DC1). This interaction necessitates further investigation in the context of transplant immunity. We used well-established preclinical models of corneal transplantation and identified distinct roles of migratory CD103+ DC1 in influencing the outcomes of the grafted tissue. In recipients with uninflamed corneal beds, migratory CD103+ DC1 demonstrate a tolerogenic phenotype that modulates the immunogenic capacity of CD11b+ DC2 primarily mediated by IL-10, suppressing alloreactive CD4+ Th1 cells via the PD-L1/PD-1 pathway and enhancing Treg-mediated tolerance via αvβ8 integrin-activated TGF-β1, thus facilitating graft survival. Conversely, in recipients with inflamed and vascularized corneal beds, IFN-γ produced by CD4+ Th1 cells induced migratory CD103+ DC1 to adopt an immunostimulatory phenotype, characterized by the downregulation of regulatory markers, including αvβ8 integrin and IL-10, and the upregulation of IL-12 and costimulatory molecules CD80/86, resulting in graft failure. The adoptive transfer of ex vivo induced tolerogenic CD103+ DC1 (iDC1) effectively inhibited Th1 polarization and preserved the tolerogenic phenotype of their physiological counterparts. Collectively, our findings underscore the essential role played by CD103+ DC1 in modulating host alloimmune responses.

Keywords: Dendritic cells; Immunology; Ophthalmology; Organ transplantation; Tolerance.


Figures
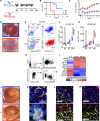
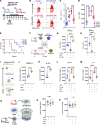
Figure 1
Figure 1. DC1 infiltration at the graft site.
(A) Experimental schematic. Allogeneic (C57BL/6J) or syngeneic (BALB/C) corneal grafts were transplanted into HR or LR BALB/C recipient mice (n = 8/group). Mice were followed up for 8 weeks by slit lamp examination. (B) Graft survival was determined by opacification score (score: 0–5). (C) Neovascularization (NV) score (score: 0–8). Additionally, graft recipients (n = 6/group/time point) were euthanized on days 3, 7, and 14, and the grafted corneas were harvested, digested, and analyzed by flow cytometry. (D) Representative slit lamp images of accepted graft (LR) upper part, and rejected graft (HR) lower part. (EG) The gate on CD103+CD11c+ was set for CD103+ DC. Mean (± SEM) of frequencies and numbers of CD103+ DC in the grafted corneas were measured. (H) Gating strategy for sorting CD103+ DC and CD11b+ DC from the grafted cornea following previous gating (Supplemental Figure 1). Gate B220 versus CD11c+ was set to exclude pDC. The gate on CD11c+CD24+ cells was set to exclude contaminating macrophages/monocytes. The gate on CD11bCD103+ cells was set for CD103+ DC. The gate on CD11b+CD103 cells was set for CD11b+ DC. (I) Transcriptional programs expressed by DC subsets sorted by FACS were analyzed by qPCR assay, showing expression average of most differentially in CD103+ DC1 (relative to their expression in CD11b+ DC2 from pooled allografted corneas; n = 6 mice/group). (J) Representative slit lamp photography of LR and HR grafted corneas at 2 weeks after transplantation. The grafted corneas were excised, incubated in 20 nM EDTA to remove the epithelium, fixed with ice-cold acetone (n = 5), and stained. (K) Representative immunofluorescence of CD11c+ cells (red), CD11c+CD103+ (white arrows) represents CD103+ DC1, and single-positive (green) represents other CD103+ subsets (Tregs). (L and M) Representative sections of the host bed (L) and donor graft (M). Each symbol (F and G) indicates an individual mouse. *P < 0.05 (2-tailed t test). LR, low risk; HR, high risk. Scale bars: 1 mm (K), 100 µm (L and M). All results are of 1 experiment, with no repetitions in animal numbers.
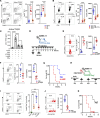
Figure 2
Figure 2. Migratory CD103+ DC1 in the DLN.
DLN from graft recipients (n = 6/group/time point; same mice as from Figure 1) were analyzed by flow cytometry (gating strategy for evaluating CD103+ DC1 in the DLN shown in Supplemental Figure 2). (A) Gate on lineageMHC-II+ was set to include mature lineage cells, and the gate on CD103+CD11c+ cells was set for frequencies of DC1. (B and C) Mean (± SEM) of frequency (B) and numbers (C) of CD103+CD11b in the ipsilateral DLN of graft recipient mice were measured (gating strategy for sorting DC1 from DC2 in the DLN at 2 weeks after transplant shown in Supplemental Figure 2, A and B). (D and E) Transcriptional programs and markers expressed by DC subsets sorted by FACS from the DLN of allograft recipient mice at 2 weeks after transplant were analyzed by qPCR assay and show expression average of most differentially in DC1 relative to their expression in DC2 from pooled DLN (n = 6 mice/group, same mice as from Figure 1; gating strategy for evaluating DC1 and DC2 phenotypic markers in the DLN shown in Supplemental Figure 2, A and B). (FI) The median fluorescence intensity (MFI) of regulatory markers was measured and compared in DC1 form either LR or HR recipients at 2 weeks after transplant (n = 6/group, gating from above). Each symbol in FI indicates an individual mouse. Additionally, sorted DC1 and DC2 were cultured and challenged with irradiated apoptotic corneal cells, stimulated with PMI and ionomycin. (J and K) ELISA assessed the supernatant for IL-10 (J) and IL-12 (K) secretion. Results are of 2 sets of triplicates with cells pooled from 3 mice on each set. *P < 0.05, **P < 0.01, ****P < 0.0001 (2-tailed t test). All results are of 1 experiment with no repetitions in animal numbers.
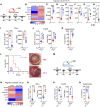
Figure 3
Figure 3. Immunostimulatory profile of migratory CD103 DC1.
(A) Experimental schematic. Allogeneic (C57BL/6J) corneal grafts were transplanted into BALB/C LR and HR RAG–/– recipient mice. Two weeks after transplantation, CD103+ DC1 were sorted from the migratory compartment, as described above. CD103+ DC1 from LR recipients were incubated with IFN-γ, and those from HR RAG–/– were left untreated. (BE, F, and G) After 12 hours, cells were analyzed by flow cytometry for the expression of regulatory markers (BE) and supernatant for the secretion of IL-10 (F) and IL-12 (G). Each symbol in BE indicates an individual mouse. (H) iDC1 (Supplemental Figure 2) were sorted by FACS and preincubated with or without IFN-γ and then cocultured with in vitro–differentiated Th1 CD4+ T cells with or without anti–PD-L1 blocking antibodies. (I and J) The intracellular expression of IFN-γ by CD4+ T cells was analyzed by flow cytometry, and the mean (± SEM) of frequencies (I) and expression (MFI) (J) were measured. Results show 2 sets of triplicates. (K) iDC1 (Supplemental Figure 3, A and B) were sorted by FACS and preincubated with or without IFN-γ. iDC1 were transwell plated (upper) with in vitro–differentiated Th1 CD4+ T cells (lower). Additionally, mouse recombinant IL-12 or anti-IL-10 were added. (L and M) The intracellular expression of IFN-γ by CD4+ T cells was analyzed by flow cytometry, and the mean (± SEM) of frequency (L) and expression (MFI) (M) was measured. Results show 2 sets of triplicates. **P < 0.01, ***P < 0.001, ****P < 0.0001 (1-way ANOVA with Bonferroni correction). All results are of one experiment with no repetitions. Experimental schematics created with Biorender.com.
Figure 4
Figure 4. The effect of migratory CD103+ DC1 on corneal transplant immunity.
(A) BALB/C LR or HR recipients were transplanted as above. Allograft recipient mice were then randomized; 1 group was i.p. injected with anti–M290-SAP, while the other group was treated with anti–IgG-SAP. (BD) Two weeks after transplantation, mice were euthanized (n = 6/group), the intracellular expression of IFN-γ by CD4+ T cells from the DLN was analyzed by flow cytometry (B), frequency (C), and expression (MFI) (D) were measured. (E) Additional mice were followed(n = 8/group) for 8 weeks to evaluate graft opacity, and Kaplan-Meier curves were plotted to evaluate graft survival. (F) Two weeks after transplantation, CD103+ DC1 were sorted by FACS from the migratory compartment of the DLN of HR recipient mice. BMDC-derived CD11b+ DC2 (iDC2) were generated with GM-CSF and stimulated with LPS. Naive CD4+CD25 T cells were sorted by MACS from the spleen of naive BALB/C mice. (G and H) Cells were cocultured for 3 days, and intracellular expression of IFN-γ by CD4+ T cells was analyzed by flow cytometry, ELISA, and MFI, and protein concentration in the supernatant was measured. (IK) Gated CD4CD11b+ DC2 were separated from CD103+ DC1 and analyzed by flow cytometry for MHC-II and IL-12 expression. Similar MLR was performed with iDC1 pretreated with or without IFN-γ. (L and M) CD4CD11b+ DC2 were separated from CD103+ DC1 and analyzed by flow cytometry for MHC-II (L) and IL-12 (M) expression. (N) iDC2 and naive CD4+CD25 T cells were cocultured in the lower and iDC1 pretreated with or without IFN-γ were plated in the upper chamber of transwell system. (O and P) Gates on CD4CD11b+ DC2 were separated from CD103+ DC1 and analyzed by flow cytometry for CD86 (O) and IL-12 (P) expression. Results are of 2 sets of triplicates with cells pooled from 3 mice on each set. Plots represent the mean(± SEM). **P < 0.01, ****P < 0.0001 (2-tailed t test [C, D, J, and K] or 1-way ANOVA [G, H, L, M, O, P] with Bonferroni correction).
Figure 5
Figure 5. The effect of migratory CD103+ DC1 on tolerance.
Migratory CD103+ DC1 from either LR or HR recipients were sorted as above, synchronized by starvation, and then cocultured with CD4+CD25 T cells harvested from BABL/C naive mice. (A) On day 5, cells were harvested, and expression of FoxP3 in CD4+T cells was analyzed by flow cytometry. (B) iDC1 were treated with or without IFN-γ and were then synchronized by starvation and cultured with CD4+CD25 T cells in SFM supplemented with latent-TGF-β1, IL-2, and with or without anti-αvβ8 blocking antibody. (B and C) On day 5, cells were harvested and the expression of FoxP3 in CD4+T cells was analyzed (B), and soluble active TGF-β1 in the supernatant was assessed (C). (D) LR graft recipient mice were treated with ADWA-11 antibody or IgG-control on the day of the transplantation and once a week. (E and F) Two weeks after transplantation, DLN CD4+ T cell intracellular expression of IFN-γ (E) and FoxP3 (F) was analyzed. (G) Additional mice were followed (n = 8/group) for 8 weeks through slit lamp examination to evaluate graft opacity, and graft survival was evaluated. (H) Syngeneic naive CD4+CD25 T cells were transferred i.v. at the time of the transplantation into HR Rag–/– recipient mice. Mice were treated with ADWA-11 antibody or IgG control on the day of the transplant and once a week. (I and J) On day 21 after transplantation, DLN were harvested, and expression of FoxP3 in CD4+ T cells (I) and their suppressive capacity in proliferation CFSE-labeled CD4+ T cell (J) was analyzed by flow cytometry. Tregs from the DLN of mice treated with IgG control were sorted by FACS and adopted into newly transplanted HR recipient mice, and control mice received PBS (n = 8/group). (K) Mice were followed for 8 weeks for evaluating graft opacity and graft survival. Results (B and C) are of 2 sets of triplicates. Plots represent the mean (± SEM). *P < 0.05, **P < 0.01, ***P < 0.001, ****P < 0.0001 (2-tailed t test [E, F, and J] or 1-way ANOVA [A, B, C, and I] with Bonferroni correction).
Figure 6
Figure 6. The effect of antigen-loaded iDC1 adoptively transferred in corneal transplant immunity.
(A) BALB/C HR recipients were transplanted as above. Immediately after transplantation, allograft recipient mice received 2 × 10⁴ of CMTMR-labeled iDC1 or PBS via SC injection. (B) Two weeks after transplantation, CMTMR migratory CD103+ DC1 were sorted by FACS from the DLN and analyzed by qPCR assay, showing the expression average of most differentially functional regulatory markers. (CH) The MFI of regulatory markers was measured by flow cytometry (CF) or ELISA (G and H) and compared with DC2 from HR recipients (previous gating from above; Figure 1A). (I and J) Intracellular expression of IFN-γ by Th1 and FoxP3+CD25+ gated on CD3+CD4+ T cells from the DLN of graft recipient mice. (K and L) Ex vivo Treg suppressive capacity on proliferating CD4+ T cells was measured. Corneal grafts were monitored for up to 8 weeks after transplant (n = 8 group), and Kaplan-Meier curves were plotted to evaluate graft survival. Representative slit lamp photography from either LR or LR are presented. BALB/C LR recipients were transplanted as above. Immediately after transplantation, allograft recipient mice received 2 × 10⁴ CMTMR-labeled iDC1 pretreated with IFN-γ or PBS (vehicle internal control) via SC injection. Two weeks after transplantation, mice were euthanized (n = 6 group). (M and N) CMTMR migratory CD103+ DC1 were sorted by FACS and analyzed by qPCR assay as above. (O and P) Intracellular expression of IFN-γ by Th1 (O) and FoxP3+CD25+ gated on CD3+CD4+ T cells (P) from the DLN of graft recipient mice was measured. (Q) Ex vivo Treg suppressive capacity on proliferating CD4+ T cells was measured. Additional mice were followed up (n = 8/group) for 8 weeks with slit lamp examination to evaluate graft opacity, and Kaplan-Meier curves were plotted to evaluate graft survival. Plots represent the mean (± SEM). *P < 0.05, **P < 0.01, ***P < 0.001, ****P < 0.0001 (2-tailed t test). All results are of 1 experimental set of animals with no repetitions.
Figure 7
Figure 7. The effect of migratory CD103+ DC1 in modulating CD11b+ DC2 in the DLN and graft site.
CD11b+ DC2 were analyzed by flow cytometry (gating strategy for grafted cornea and conjunctiva shown in Supplemental Figure 1 and for DLN shown in Supplemental Figure 2). (AC) Expression of CD86 and IL-12 in the DLN of LR and HR transplanted mice treated with either anti–M290-SAP or anti–IgG-SAP (A), HR WT treated with either iDC1 or PBS and RAG–/– transplanted mice (B), and LR WT and RAG–/– transplanted mice treated with ADWA-11 antibody or IgG control (C) are shown. (DI) In parallel, flow cytometry was performed on single-cell suspensions from the grafted corneas (DF) and conjunctivae (GI) of the same mice as described in AC. Each symbol (AI) indicates an individual mouse. Plots represent the mean (± SEM). One-way ANOVA with Bonferroni correction was used. All results are of 1 experimental set of animals with no repetitions.

References

    1. Dana MR, et al. Twenty-five-year panorama of corneal immunology: emerging concepts in the immunopathogenesis of microbial keratitis, peripheral ulcerative keratitis, and corneal transplant rejection. Cornea. 2000;19(5):625–643. doi: 10.1097/00003226-200009000-00008. - DOI - PubMed
    1. Niederkorn JY. Immunology and immunomodulation of corneal transplantation. Int Rev Immunol. 2002;21(2-3):173–196. doi: 10.1080/08830180212064. - DOI - PubMed
    1. Amouzegar A, et al. Alloimmunity and tolerance in corneal transplantation. J Immunol. 2016;196(10):3983–3991. doi: 10.4049/jimmunol.1600251. - DOI - PMC - PubMed
    1. Gomez-Benlloch A, et al. Causes of corneal transplant failure: a multicentric study. Acta Ophthalmol. 2021;99(6):e922–e928. doi: 10.1111/aos.14708. - DOI - PubMed
    1. Mathias CB, McAleer JP. Transplantation: Immunologic principles and pharmacologic agents. In: Mathias CB, et al, eds. Pharmacology of Immunotherapeutic Drugs. Springer; 2019:251–274.

MeSH terms