. 2024 Sep 24;43(9):114706.
doi: 10.1016/j.celrep.2024.114706. Epub 2024 Sep 4.

Acute and persistent responses after H5N1 vaccination in humans

Affiliations

Acute and persistent responses after H5N1 vaccination in humans

Richard Apps et al. Cell Rep. .

Abstract

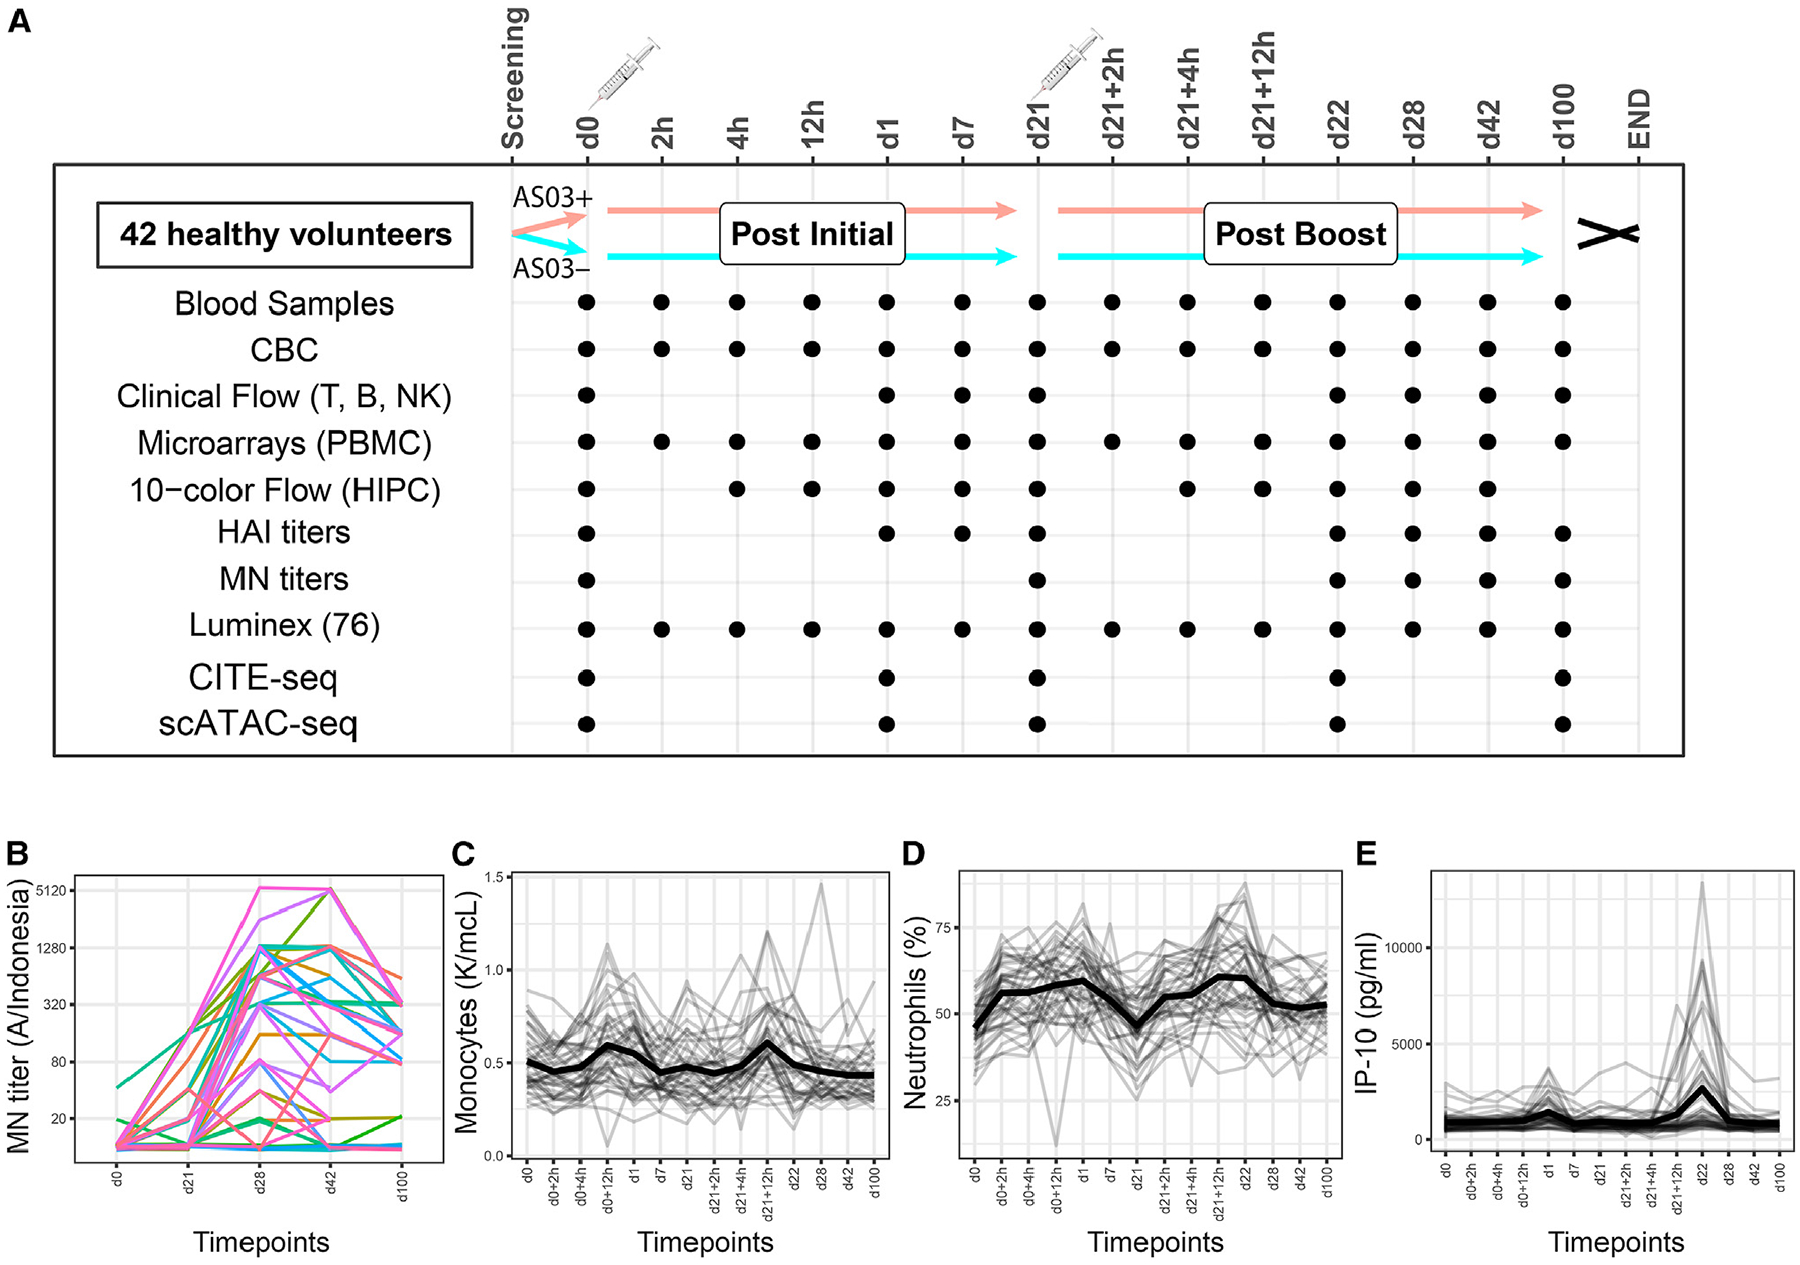
To gain insight into how an adjuvant impacts vaccination responses, we use systems immunology to study human H5N1 influenza vaccination with or without the adjuvant AS03, longitudinally assessing 14 time points including multiple time points within the first day after prime and boost. We develop an unsupervised computational framework to discover high-dimensional response patterns, which uncover adjuvant- and immunogenicity-associated early response dynamics, including some that differ post prime versus boost. With or without adjuvant, some vaccine-induced transcriptional patterns persist to at least 100 days after initial vaccination. Single-cell profiling of surface proteins, transcriptomes, and chromatin accessibility implicates transcription factors in the erythroblast-transformation-specific (ETS) family as shaping these long-lasting signatures, primarily in classical monocytes but also in CD8+ naive-like T cells. These cell-type-specific signatures are elevated at baseline in high-antibody responders in an independent vaccination cohort, suggesting that antigen-agnostic baseline immune states can be modulated by vaccine antigens alone to enhance future responses.

Keywords: CP: Immunology; CP: Microbiology; adjuvant; antigen-agnostic memory; baseline immune state; immune response dynamics; single cell analysis; systems immunology; trained immunity; vaccine.


Conflict of interest statement

Declaration of interests R.G.v.d.M. is a former employee of and holds shares in the GSK group of companies. B.S. is a former SomaLogic, Inc. (Boulder, CO, USA), employee and a company shareholder. J.S.T. serves on the scientific advisory boards of CytoReason, Immunoscape, and the Human Immunome Project.

Figures

Figure 1.
Figure 1.
Study design and monitoring of known vaccine response markers (A) A schematic of the study design indicating the pre- and post-vaccination blood collections and the specific assays performed at each time point. Each subject was vaccinated on day 0 and day 21 (boost). A dot represents a time point on which a particular assay was performed. For more detailed information see Table S1. (B–E) Known markers of vaccine response that were monitored throughout the study. Microneutralization (MN) H5N1 titer responses to the vaccine are shown for all subjects in log2 scale. Total monocyte concentrations or neutrophil percentages from complete blood count (CBC) tests, or IP-10 concentration determined by Luminex, are shown for all subjects, with mean values marked in bold.
Figure 2.
Figure 2.
Discovery of high-dimensional dynamic response patterns using gene expression and flow cytometry data (A) A methodological schematic depicting response pattern (RP) discovery. In the leftmost image, patterns are extracted from a matrix where columns are time points and rows are subject and parameter/feature combinations (e.g., transcript level in subject s01), where features are expression of a gene or frequency of a cell population. The middle images illustrate that patterns (p) can be inferred by searching for correlated features present in distinct or overlapping groups of subjects, and once RPs are uncovered, the rightmost image illustrates subject-level (rows) scoring for each pattern (columns). (B) Profiles of the 14 RPs discovered using gene expression data (Gp01 to Gp14). Dashed vertical lines indicate day 1 (red) and day 7 (blue) after initial and boost vaccinations. Numbers on the top left corner of the subplots represent the number of subject-gene combinations comprising each RP profile before the gene lists were expanded using relaxed selection criteria. (C) RPs Gp01 to Gp08 were significantly enriched for the blood transcription modules shown. (D) Profiles of the eight RPs discovered using cell population frequency data (Fp01 to Fp08), with marked vertical lines as described above for (B). (E) The component cell populations for RPs Fp01–08. (F) All 42 subjects clustered by scores for the gene expression RPs Gp01–14. Also shown are MN titers to H5N1 at day 28 (in log2 space), subject sex, and cell frequency RP scores (Fp01–08). Expression of the component genes is shown as an example for Gp02 in subjects s11 and s24, individuals with high and low scores for this RP.
Figure 3.
Figure 3.
Prediction of adjuvant signature using response patterns identified in blinded analyses and analyses of these patterns as predictors of antibody responses (A) A flowchart of the procedure followed to generate a signature for adjuvant status prediction. (B) Cross-validation-based regularized linear predictive modeling of MN titer responses to H5N1 strain A/Indonesia/5/2005 using elastic net. Input features include response patterns (RPs) discovered from both gene expression and flow cytometry data, sex, and age. Shown are the correlation between out-of-bag predicted titer and actual observed values over multiple iterations of cross validation (see STAR Methods). The top selected features are shown on the right, with the percentage of iterations in which a feature was selected during cross validation and its average coefficient in the linear model. Red bars indicate mean and error bars depict standard deviation across iterations of randomly sampled training and test sets. Gray bars correspond to the result from null model runs in which the same cross-validation procedure was applied to the data with random permutation of sample labels. (C) Principal-component analysis (PCA) of all subjects using the candidate RPs (Gp01, Gp02, Gp03, Fp01, and Fp05) predicted to be associated with the adjuvant based on the approach in (A). Points on the plot are colored according to the two clusters determined by k-means clustering (k = 2). (D) Boxplot of circulating IP-10 responses in the two subject clusters after the primary (day 1–day 0) or boost (day 22–day 0) vaccinations. (E) Heatmap showing RP score profiles. All 42 subjects were clustered by scores for the final adjuvant signature involving Gp01, Gp02, Gp03, Fp01, Fp05, and IP-10. A horizontal dashed black line marks the separation between those predicted to have received the adjuvant (POS) versus not (NEG). MN titer responses to H5N1 at day 28 (in log2 space) and sex are also shown. (F) Predicted versus actual adjuvant status shown for all 42 subjects using a confusion matrix. (G and H) Similar to (B), but here, prediction with cross-validation analysis is performed separately for the now unblinded adjuvanted (G) and non-adjuvanted (H) subjects.
Figure 4.
Figure 4.
Multimodal single-cell analysis of persistent signatures and assessment in an independent vaccination study (A) Genes in the response patterns (RPs) that displayed persistent alteration at day 100 are shown in a volcano plot with day 100 versus day 0 gene expression fold changes (x axis) versus statistical significance (y axis). Genes in Gp04, 06, 07, 08, 10, 11, and 12 are included, and those with adjusted p < 0.01 are colored by their corresponding RP. Red indicates genes shared among Gp04, 06, 07, and 08 (RPs that displayed a persistently elevated trend by day 100); dark blue are genes in any of Gp10–12 (RPs that displayed a persistently depressed trend by day 100). The Venn diagram shows gene overlaps among the elevated RPs. (B) Hypergeometric test assessing enrichment of BTMs in the persistently elevated genes (those with p < 0.01 and positive fold change in A). Statistical significance of the hypergeometric enrichment is shown (x axis), with dot size denoting the gene ratio as defined by the clusterProfiler package. (C) For n = 6 adjuvanted subjects, single-cell CITE-seq analysis was performed for PBMC samples from days 0 and 100. A UMAP shows the major clusters identified, with protein expression reported in Figure S7A. (D) Enrichment analysis of persistent genes in specific cell types using the CITE-seq shown in (C). Within each cell population identified, “pseudo bulk” gene expression was used to rank all genes by t statistics from a mixed-effect linear model comparing day 100 versus baseline. This was followed by GSEA of the persistent genes with elevated expression from the indicated RPs. Here, persistent genes were determined from the day 100 versus day 0 comparison in (A), where adjusted p < 0.01 and fold change is positive—i.e., colored dots with positive fold changes in (A). (E) For n = 3 non-adjuvanted subjects, enrichment analyses show that the same RPs and cell types also demonstrate persistent effects in the absence of adjuvant. A further 13 subjects were analyzed by CITE-seq, of which 10 were adjuvanted and showed persistent effects of Gp04 and 06–08, similar to those that had been observed for the first 6 adjuvanted subjects studied in (D). Leading-edge genes from the enrichment of Gp04 and 06–08 in specific cell types in the 10 new adjuvanted subjects (Figure S7B) were then used for GSEA in the 3 non-adjuvanted subjects and for the selected cell populations now shown here. For this set of 13 individuals, CITE-seq assessed persistent effects at day 100 compared to day 21 rather than day 0, which was justified, as for Gp04 and 06–08 these patterns had previously been determined to decline to day 0 levels by the time of dose 2 on day 21 (Figure 2B). (F) scATAC-seq was generated for the 10 adjuvanted and 3 non-adjuvanted subjects described in (E) and identified transcription factors with similar differential accessibility both at the persistent time point (day 100 versus 21) and immediately after dose 2 (day 22 versus 21). Differential accessibility is shown for motifs enriched near the day 100 leading-edge genes, which had been observed for CD14 monocytes in (D), identified using centrimo with an e-value cutoff of 1e–10. The differential accessibility of these motifs was then determined by computing chromVAR accessibility scores and linear mixed-effect models. Shown is the scaled effect size and 95% confidence interval (1.96 × SE). (G) Assessing cell-type-specific persistent signatures for association with antibody response using baseline single-cell CITE-seq data from the 2009 flu vaccination cohort. Leading-edge genes from each of the persistent RPs (Gp04 and 06–08) enriched in classical monocytes and CD8+ naive-like T cells in (D) were tested. Boxplots compare average relative expression of these genes at baseline, between high and low antibody responders in the 2009 flu cohort, for the indicated gene patterns (Gp04 and 06) and cell types (monocytes or CD8+ naive-like cells). Additional results, including for dendritic cells, are in Figure S8C.

References

    1. Pulendran B, and Ahmed R (2011). Immunological mechanisms of vaccination. Nat. Immunol 12, 509–517. - PMC - PubMed
    1. Schijns VEJC (2003). Mechanisms of vaccine adjuvant activity: initiation and regulation of immune responses by vaccine adjuvants. Vaccine 21, 829–831. - PubMed
    1. Shi S, Zhu H, Xia X, Liang Z, Ma X, and Sun B (2019). Vaccine adjuvants: Understanding the structure and mechanism of adjuvanticity. Vaccine 37, 3167–3178. - PubMed
    1. Pulendran B, S Arunachalam P, and O’Hagan DT (2021). Emerging concepts in the science of vaccine adjuvants. Nat. Rev. Drug Discov 20, 454–475. - PMC - PubMed
    1. Givord C, Welsby I, Detienne S, Thomas S, Assabban A, Lima Silva V, Molle C, Gineste R, Vermeersch M, Perez-Morga D, et al. (2018). Activation of the endoplasmic reticulum stress sensor IRE1α by the vaccine adjuvant AS03 contributes to its immunostimulatory properties. NPJ Vaccines 3, 20. - PMC - PubMed

Publication types