. 2024 Sep 5;20(9):e1012409.
doi: 10.1371/journal.pcbi.1012409. eCollection 2024 Sep.

MVST: Identifying spatial domains of spatial transcriptomes from multiple views using multi-view graph convolutional networks

Affiliations

MVST: Identifying spatial domains of spatial transcriptomes from multiple views using multi-view graph convolutional networks

Hao Duan et al. PLoS Comput Biol. .

Abstract

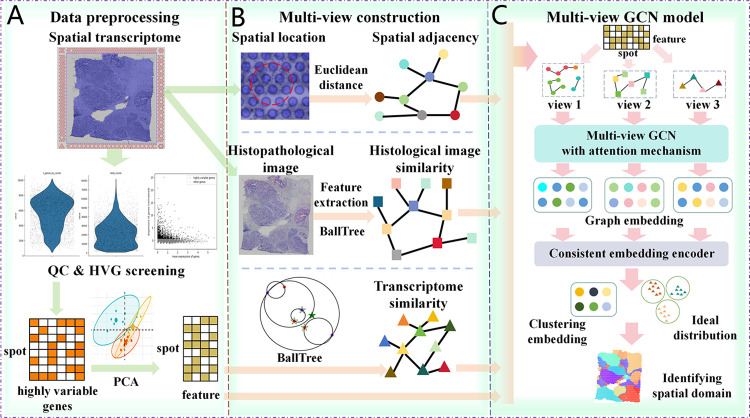
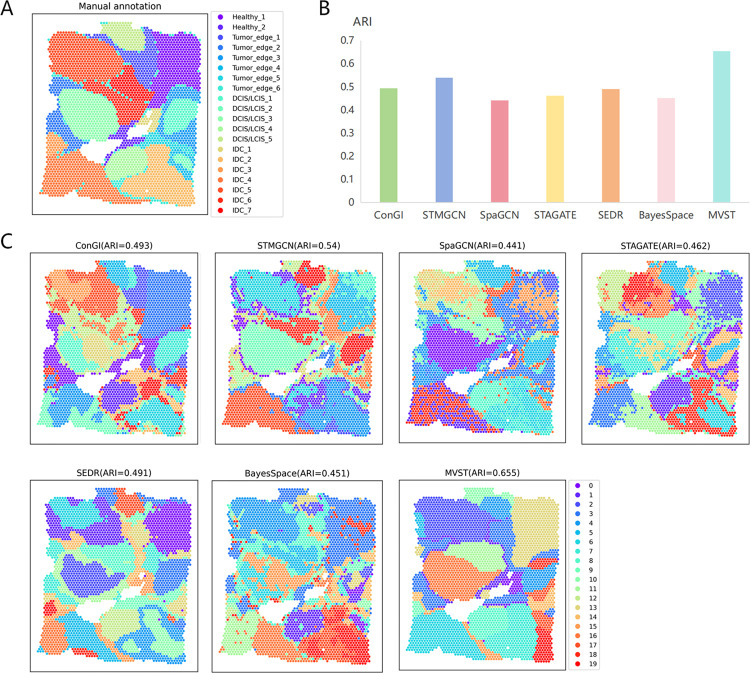
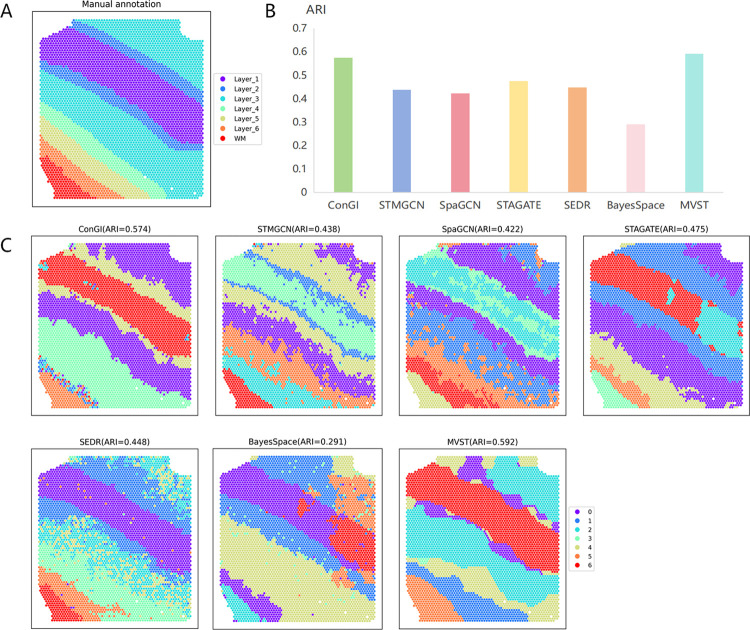
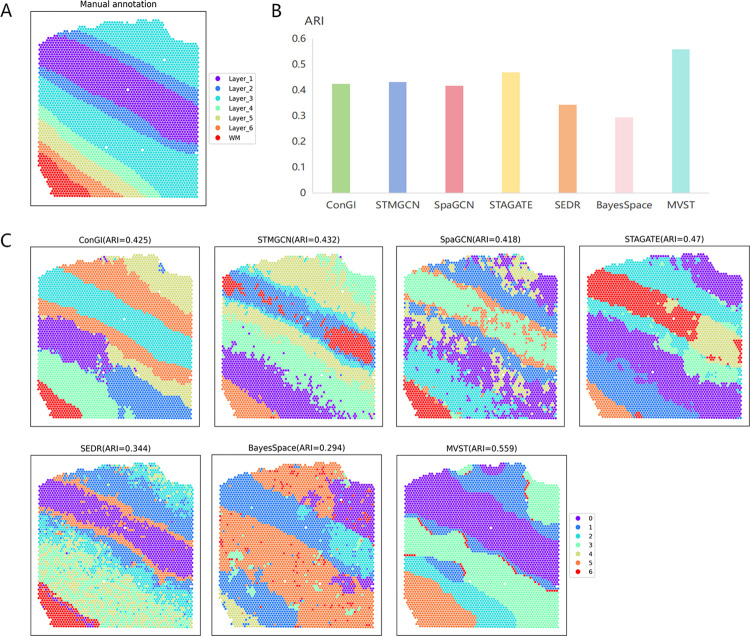
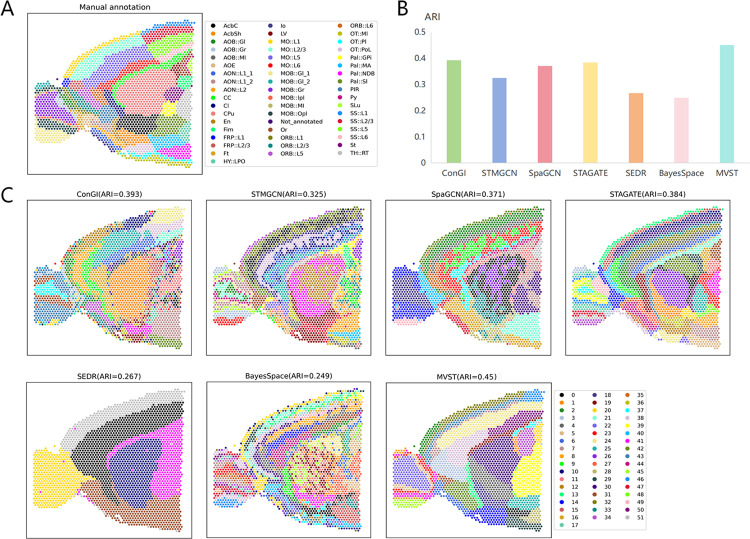
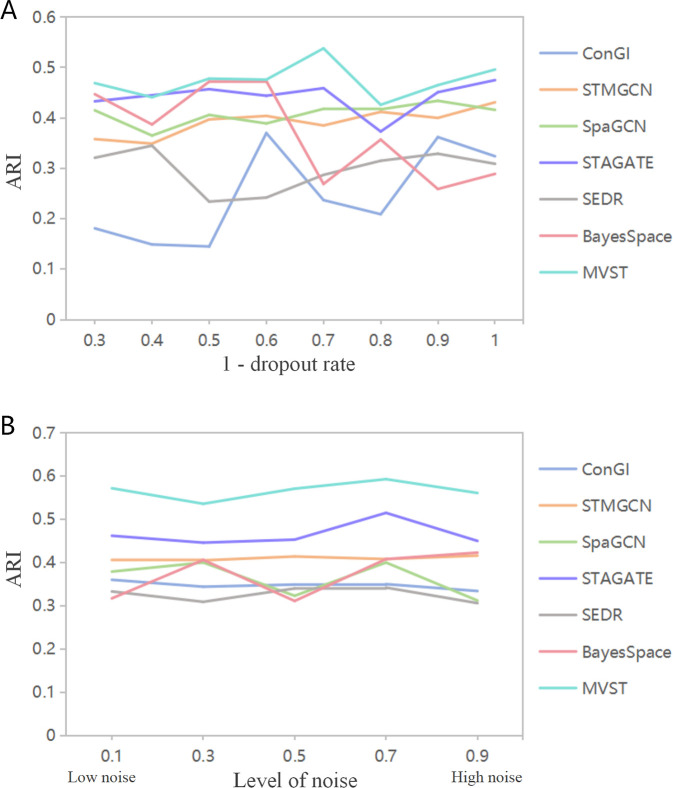
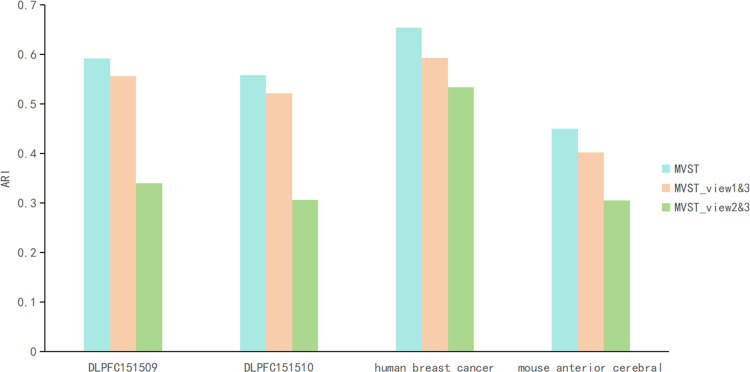
Spatial transcriptome technology can parse transcriptomic data at the spatial level to detect high-throughput gene expression and preserve information regarding the spatial structure of tissues. Identifying spatial domains, that is identifying regions with similarities in gene expression and histology, is the most basic and critical aspect of spatial transcriptome data analysis. Most current methods identify spatial domains only through a single view, which may obscure certain important information and thus fail to make full use of the information embedded in spatial transcriptome data. Therefore, we propose an unsupervised clustering framework based on multiview graph convolutional networks (MVST) to achieve accurate spatial domain recognition by the learning graph embedding features of neighborhood graphs constructed from gene expression information, spatial location information, and histopathological image information through multiview graph convolutional networks. By exploring spatial transcriptomes from multiple views, MVST enables data from all parts of the spatial transcriptome to be comprehensively and fully utilized to obtain more accurate spatial expression patterns. We verified the effectiveness of MVST on real spatial transcriptome datasets, the robustness of MVST on some simulated datasets, and the reasonableness of the framework structure of MVST in ablation experiments, and from the experimental results, it is clear that MVST can achieve a more accurate spatial domain identification compared with the current more advanced methods. In conclusion, MVST is a powerful tool for spatial transcriptome research with improved spatial domain recognition.


Conflict of interest statement

The authors have declared that no competing interests exist.

Figures

Fig 1
Fig 1. Workflow of MVST.
(A) MVST uses SCANPY to perform routine data preprocessing operations such as quality control and highly variable gene screening on spatial transcriptome gene expression data. PCA is used to downscale highly variable gene expression data to obtain a relatively low-dimensional feature representation of spot gene expression data. (B) The graph construction process of MVST reflects its multi-perspective feature, constructing graphs based on distance similarity, histopathological image similarity, and gene expression similarity. The spatial adjacency, histological image similarity, and gene expression similarity networks are obtained through this process. (C) The multi-view graph convolution model of MVST includes a multi-view graph convolution encoder with an attention mechanism and a coherent embedding encoder, in which the multi-view graph convolution encoder learns the spot features from each of the three views, and the coherent embedding encoder integrates the features of the spot in each view to obtain the final clustered embedding.
Fig 2
Fig 2. MVST improves spatial domain recognition of human breast cancer tissues.
(A) Manual annotation of the spatial domain of the human breast cancer dataset by dividing the tissue slices into 20 regions. (B) Histogram of the performance of spatial domain recognition of human breast cancer dataset using MVST and existing state-of-the-art algorithms (ConGI, STMGCN, SpaGCN, STAGATE, SEDR, and BayesSpace), with the X-axis showing the names of the algorithms and the Y-axis showing the ARI value of the spatial domain recognition results of each algorithm. This is used to compare the results of the predicted spatial domains of each algorithm to the similarity of manually annotated regions. (C) ARI values and visualizations of spatial domain recognition results from MVST and other algorithms for the human breast cancer dataset.
Fig 3
Fig 3. MVST enhances spatial domain recognition of human dorsolateral prefrontal cortex tissue slice 151509.
(A) Manual annotation of the spatial domain of human dorsolateral prefrontal cortex tissue slice 151509 dataset by dividing the tissue slice into seven layers. (B) Histogram of the performance of spatial domain recognition of human dorsolateral prefrontal cortex tissue slices 151509 dataset using MVST and existing state-of-the-art algorithms (ConGI, STMGCN, SpaGCN, STAGATE, SEDR, and BayesSpace), with the X-axis showing the names of the algorithms, and the Y-axis showing the ARI of the spatial domain recognition results value of each algorithm, which is used to compare the similarity between the spatial domains predicted by each algorithm and the manually annotated layers. (C) ARI values and visual presentation of the spatial domain recognition results of MVST and other algorithms for the human dorsolateral prefrontal cortex tissue slice 151509 dataset.
Fig 4
Fig 4. MVST enhances spatial domain recognition of human dorsolateral prefrontal cortex tissue slice 151510.
(A) Manual annotation of the spatial domain of human dorsolateral prefrontal cortex tissue slice 151510 dataset by dividing the tissue slice into seven layers. (B) Histogram of the performance of spatial domain recognition of the human dorsolateral prefrontal cortex tissue slices 151510 dataset using MVST and existing state-of-the-art algorithms (ConGI, STMGCN, SpaGCN, STAGATE, SEDR, and BayesSpace), with the X-axis showing the name of each algorithm, and the Y-axis showing the ARI of the spatial domain recognition results of each algorithm value, which is used to compare the similarity between the spatial domains predicted by each algorithm and the manually annotated layers. (C) ARI values and visual presentation of spatial domain recognition results from MVST and other algorithms for the human dorsolateral prefrontal cortex tissue slice 151510 dataset.
Fig 5
Fig 5. MVST improves the spatial domain recognition of mouse anterior brain tissue slices.
(A) Manual annotation of the spatial domains of the mouse anterior brain tissue slice dataset by dividing the tissue slices into 52 regions. (B) Histogram of the performance of spatial domain recognition of the mouse anterior brain tissue slices dataset using MVST and existing state-of-the-art algorithms (ConGI, STMGCN, SpaGCN, STAGATE, SEDR, and BayesSpace), with the X-axis showing the names of the algorithms, and the Y-axis showing the ARI value of the spatial domain recognition results of each algorithm, which is used to compare the similarity between the spatial domains predicted by each algorithm and the manually annotated layers. (C) ARI values and visual presentation of spatial domain recognition results of MVST and other algorithms on the mouse anterior brain tissue slice dataset.
Fig 6
Fig 6. Performance comparison between MVST and six comparison methods on simulated data.
(A) Performance comparison between MVST and six comparison methods when facing different sparsities of gene expression matrix; the X-axis represents different sparsities of gene expression matrix and the Y-axis represents ARI values. (B) Performance comparison between MVST and the six comparative methods when facing simulated data with different levels of added noise. The X-axis represents the level of added noise and the Y-axis represents the ARI value.
Fig 7
Fig 7. Comparison of the performance of MVST with its two variants (MVST_view1&3 and MVST_view2&3) on the human dorsolateral prefrontal cortex, mouse anterior cerebral slice, and human breast cancer datasets, with the X-axis representing the different datasets and the Y-axis representing the ARI values.

Similar articles

Cited by

References

    1. Moses L, Pachter L: Museum of spatial transcriptomics. Nature Methods 2022, 19(5):534–546. doi: 10.1038/s41592-022-01409-2 - DOI - PubMed
    1. Liao J, Lu X, Shao X, Zhu L, Fan X: Uncovering an Organ’s Molecular Architecture at Single-Cell Resolution by Spatially Resolved Transcriptomics. Trends in Biotechnology 2021, 39(1):43–58. doi: 10.1016/j.tibtech.2020.05.006 - DOI - PubMed
    1. Zhang Z, Cui F, Su W, Dou L, Xu A, Cao C, Zou Q: webSCST: an interactive web application for single-cell RNA-sequencing data and spatial transcriptomic data integration. Bioinformatics 2022, 38(13):3488–3489. doi: 10.1093/bioinformatics/btac350 - DOI - PubMed
    1. Marx V: Method of the Year: spatially resolved transcriptomics. Nature Methods 2021, 18(1):9–14. doi: 10.1038/s41592-020-01033-y - DOI - PubMed
    1. Larsson L, Frisén J, Lundeberg J: Spatially resolved transcriptomics adds a new dimension to genomics. Nature Methods 2021, 18(1):15–18. doi: 10.1038/s41592-020-01038-7 - DOI - PubMed

LinkOut - more resources