. 2024 Sep 5;20(9):e1012330.
doi: 10.1371/journal.pcbi.1012330. eCollection 2024 Sep.

Unveiling inter-embryo variability in spindle length over time: Towards quantitative phenotype analysis

Affiliations

Unveiling inter-embryo variability in spindle length over time: Towards quantitative phenotype analysis

Yann Le Cunff et al. PLoS Comput Biol. .

Abstract

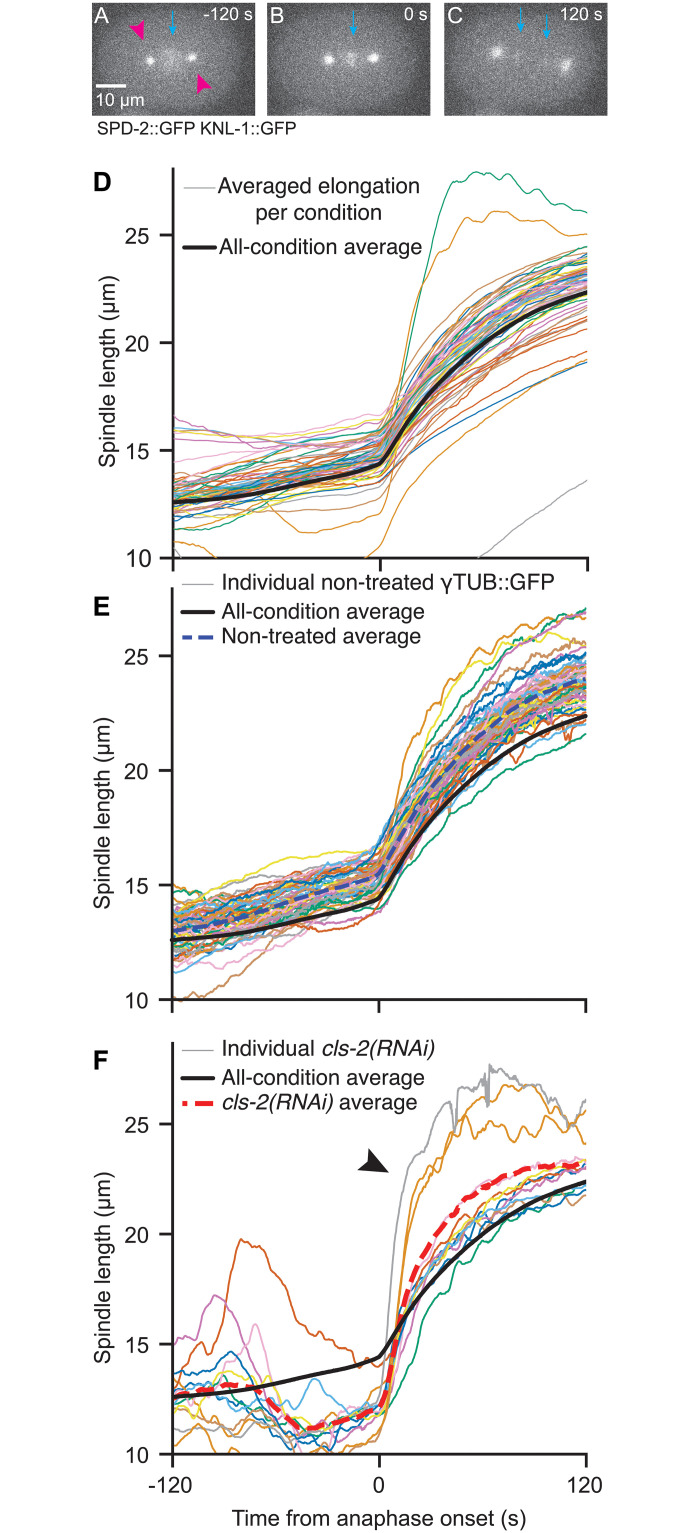
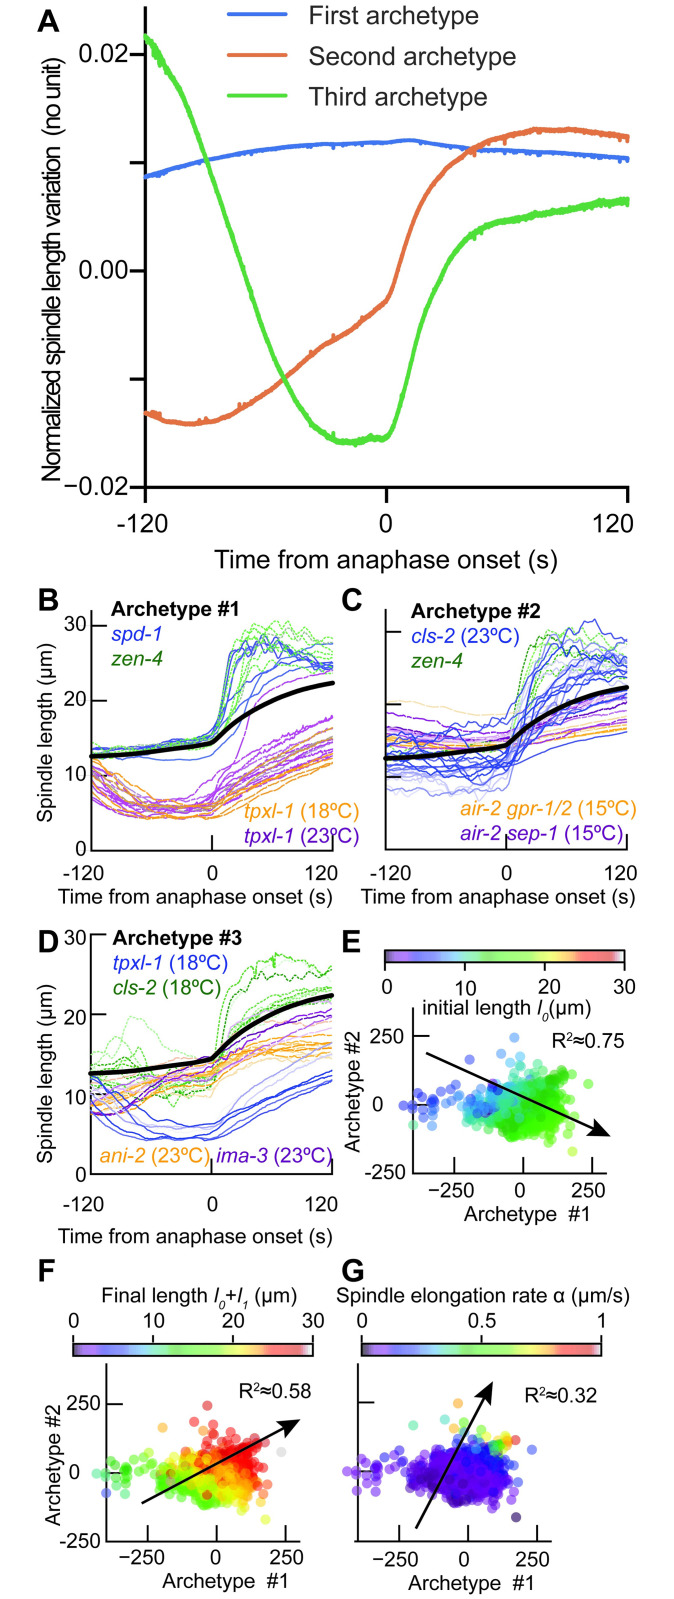
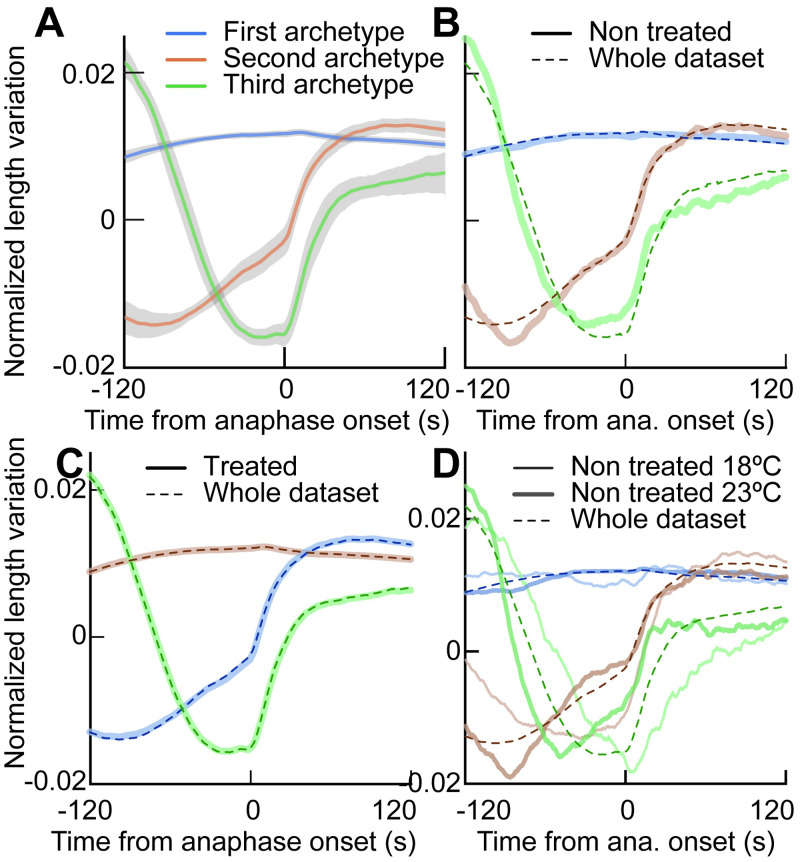
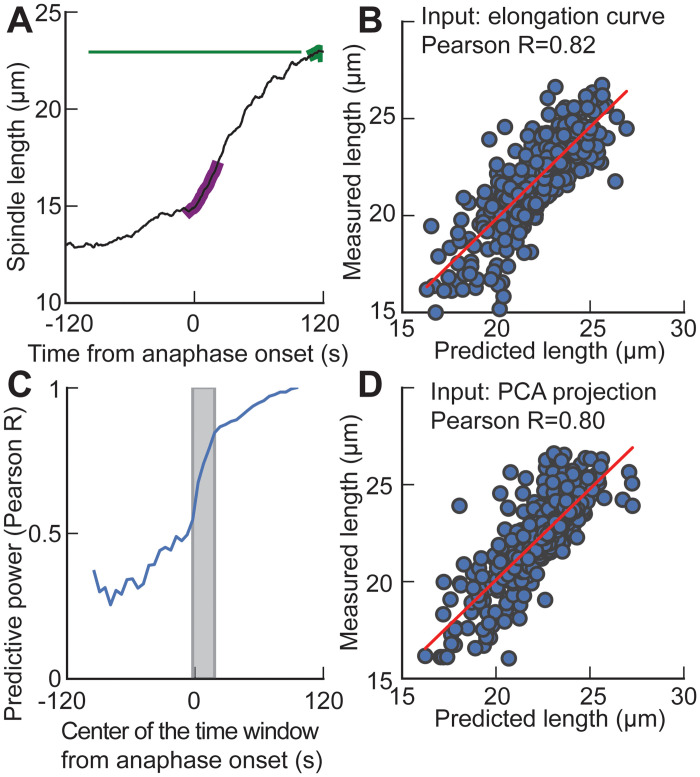
How can inter-individual variability be quantified? Measuring many features per experiment raises the question of choosing them to recapitulate high-dimensional data. Tackling this challenge on spindle elongation phenotypes, we showed that only three typical elongation patterns describe spindle elongation in C. elegans one-cell embryo. These archetypes, automatically extracted from the experimental data using principal component analysis (PCA), accounted for more than 95% of inter-individual variability of more than 1600 experiments across more than 100 different conditions. The two first archetypes were related to spindle average length and anaphasic elongation rate. The third archetype, accounting for 6% of the variability, was novel and corresponded to a transient spindle shortening in late metaphase, reminiscent of kinetochore function-defect phenotypes. Importantly, these three archetypes were robust to the choice of the dataset and were found even considering only non-treated conditions. Thus, the inter-individual differences between genetically perturbed embryos have the same underlying nature as natural inter-individual differences between wild-type embryos, independently of the temperatures. We thus propose that beyond the apparent complexity of the spindle, only three independent mechanisms account for spindle elongation, weighted differently in the various conditions. Interestingly, the spindle-length archetypes covered both metaphase and anaphase, suggesting that spindle elongation in late metaphase is sufficient to predict the late anaphase length. We validated this idea using a machine-learning approach. Finally, given amounts of these three archetypes could represent a quantitative phenotype. To take advantage of this, we set out to predict interacting genes from a seed based on the PCA coefficients. We exemplified this firstly on the role of tpxl-1 whose homolog tpx2 is involved in spindle microtubule branching, secondly the mechanism regulating metaphase length, and thirdly the central spindle players which set the length at anaphase. We found novel interactors not in public databases but supported by recent experimental publications.


Conflict of interest statement

The authors have declared that no competing interests exist.

Figures

Fig 1
Fig 1. Diversity of the spindle length phenotypes at 18°C.
(A-C) Exemplar stills of a typical embryo of strain JEP29, 120 s before, at anaphase onset and 120 s after. (magenta arrowheads) Centrosomes were labelled through SPD-2::GFP and (cyan arrow) kinetochores through KNL-1::GFP. The scale bar represents 10 μm. (D) (thin coloured lines) Pole-pole distance (spindle length) averaged per condition and plotted during metaphase and anaphase for each of the 67 conditions, including 3 non-treated distinct strains, one control, and 63 gene depletions/mutations. All included embryos were imaged at 18°C (S1 Table). Conditions with less than 6 embryos were not represented. Multiple conditions treating the same gene by RNAi or mutating it are merged. (E) The thin coloured lines depict the spindle lengths for individual non-treated TH27 embryos (N = 58), and the thick blue dashed line is the average of all embryos of this condition. (F) (thin lines) Spindle length for individual cls-2(RNAi) treated embryos (N = 12). The thick red dashed line corresponds to the average spindle length over these embryos. Arrowhead indicates the tracks showing fast spindle elongation revealing “spindle weakening”. In panels D-F, individual embryos and averaged tracks were smoothed using a 1.5 s-running-window median. The black thicker line corresponds to the average over the whole dataset, including all conditions.
Fig 2
Fig 2. Principal component analysis of the spindle elongation and corresponding archetypes (eigenvectors).
(A) The three main archetypes extracted by PCA over all conditions account for more than 95% of cell-cell variability in spindle elongation (see main text for their plausible interpretation). (B) Spindle elongations from individual experiments for the two conditions resulting in the highest coefficients for archetype 1 averaged over the condition (C1¯), namely GFP::ɣTUB (TH27) embryos treated with spd-1(RNAi) (N=7, C1¯96.6) and zen-4(RNAi) (N=7, C1¯116). The lowest coefficients for archetype 1 were obtained by treating the same strain with tpxl-1(RNAi) and imaging at 23°C (N=12, C1¯-327) or 18°C (N=7,C1¯-366). (C) Similar assay for archetype 2. Highest values were obtained with GFP::ɣTUB (TH27) embryos treated with cls-2(RNAi), imaged at 23°C (N=21, C2¯81.2) and zen-4(RNAi) imaged at 18°C (N=7, C2¯101). The lowest coefficients for archetype 2 were obtained treating the air-2(or207) mutant labelled with KNL-1::GFP and SPD-2::GFP (JEP31 strain) either with sep-1(RNAi) (N=11, C2¯-95.2) or gpr-1/2(RNAi) (N=9, C2¯-114), and imaging at 15°C. (D) Similar assay for archetype 3. Highest values were obtained with GFP::ɣTUB (TH27) embryos treated with tpxl-1(RNAi) (N=7, C3¯62.2) and cls-2(RNAi) (N=12, C3¯50.6) while lowest coefficients resulted from treating with ima-3(RNAi) (N=5, C3¯-41.2) and ani-2(RNAi) (N=13, C3¯-48.2). All considered embryos in panels (B-D) were imaged at 18°C except otherwise stated. (E-G) Fit of spindle elongation curves after [23] and mapping the corresponding parameters on the PCA plane (see main text and S1 Text): (E) Average spindle length in early metaphase l0 and (F) in anaphase l0 + l1, and (G) elongation rate α. These three values are colour-coded, and an arrow depicts the axis along which these quantities vary (gradient) while we plotted the values of the two first coefficients of the PCA for embryos from the whole dataset except 16/1618 embryos whose elongation cannot be fitted. 14 additional fits were excluded because of aberrant values. The adjusted R-squared is reported for the multilinear fits, and the corresponding p-values are below 10−15) (S1 Methods).
Fig 3
Fig 3. Variations of the archetypes upon dataset changes.
(A) (lines) Average of the three first PCA archetypes (eigenvectors) ±(shading) two times their standard deviations, computed over a 500 embryos subset of the data (disregarding conditions). We repeated this bootstrapping 500 times to obtain standard deviations. (B) (thick lines) Three first PCA archetypes were computed considering only the non-treated conditions (N=129) and compared to (dashed lines) archetypes extracted from the whole set of conditions (N=1618). (C) (thick lines) Three first PCA archetypes computed considering only the treated conditions (N=1308), meaning RNAi or mutant without L4440 controls, and compared to (dashed lines) archetypes extracted from the whole set of conditions. D) Three first PCA archetypes computed considering only the non-treated conditions at (thick lines) 23°C (N=71) and (thin lines) 18°C (N=58), compared to (dashed lines) archetypes extracted from the whole set of conditions. In all panels, the elongation curves were smoothed with a 1.5 s running-median filtering before computing PCA. Explained variances are reported in S5 Table.
Fig 4
Fig 4. Machine learning (ML) predicts the spindle late-anaphase length lLA.
(A) (black line) Elongation of an exemplar non-treated GFP::ɣTUB embryo, imaged at 18°C, highlighting (purple) the (−5, 20) s interval used as input of algorithm and (green) the (111.7, 120) s interval from anaphase-onset to compute the average spindle length at late-anaphase. (B) Using embryos in the testing set (32%, i.e. 576), we plotted the measured spindle late-anaphase length versus the predicted final length and obtained a high correlation (R = 0.82, p < 10−15) when inputting an elongation curve over the (-5, 20) s interval as input to the ML network. (C) We slid this 25 s interval by 5 s starting at −120 s and ending at 120 s, and computed the Pearson coefficient, as above, denoted predictive power. The grey shading region corresponds to the interval used in other panels. (D) Using embryos in the testing set, we plotted the measured spindle late-anaphase length versus the predicted final length and obtained a high correlation (R = 0.80, p < 10−15) when inputting the PCA projection (coefficient) computed on the elongation curve over the (-5, 20) s interval as input to the ML network. Details about the algorithmic approach are provided in §3 in S1 Methods.
Fig 5
Fig 5. PCA coefficients depend on the penetrance of RNAi.
(A) Average spindle elongation trajectories for the depletion of KLP-7MCAK in KLP-7::mNG background (strain LP447) in three conditions: (dotted lines) N=18 klp-7(RNAi)) treated embryos; (dashed lines) N=8 control embryos (L4440 treated); and (plain lines) N=11 non-treated embryos. Individual embryos elongation are reported in S8 Fig. (B) Projection of these conditions on the PCA established on the whole dataset. We plotted the coefficients corresponding to the two first archetypes. The black arrow depicts the axis along which this fluorescence varies (gradient), computed similarly to Fig 2E, 2F and 2G. The three conditions reported here were not included in the initial dataset used to generate PCA archetypes. Acquisitions were performed at 18°C. The marker colour encodes the fluorescence level of KLP-7::mNG (Methods).
Fig 6
Fig 6. PCA coefficients as a quantitative phenotype.
Each experiment is projected by PCA, and then a median is computed per condition. The resulting scatter plot is attached as an interactive plot (S1 File). (A, C, E) report on the coefficients 1 and 2, 2 and 3, 1 and 3 respectively. We colour-coded the conditions depending on their functional group as reported in (S1 Table). (B, D, F) depict the corresponding coefficients for each group computed as the median of the values per conditions plotted on the left-hand side panels. The corresponding spindle elongations are reported at S7 Fig. The colour code for the group is shown in the bottom part, together with the abbreviated group within parentheses.

Similar articles

Cited by

References

    1. Fonseca CL, Malaby HLH, Sepaniac LA, Martin W, Byers C, Czechanski A, et al.. Mitotic chromosome alignment ensures mitotic fidelity by promoting interchromosomal compaction during anaphase. J Cell Biol. 2019;218(4):1148–1163. doi: 10.1083/jcb.201807228 - DOI - PMC - PubMed
    1. Farhadifar R, Ponciano JM, Andersen EC, Needleman DJ, Baer CF. Mutation is a sufficient and robust predictor of genetic variation for mitotic spindle traits in Caenorhabditis elegans. Genetics. 2016;203(4):1859–1870. doi: 10.1534/genetics.115.185736 - DOI - PMC - PubMed
    1. Bouvrais H, Chesneau L, Pastezeur S, Fairbrass D, Delattre M, Pecreaux J. Microtubule Feedback and LET-99-Dependent Control of Pulling Forces Ensure Robust Spindle Position. Biophys J. 2018;115(11):2189–2205. doi: 10.1016/j.bpj.2018.10.010 - DOI - PMC - PubMed
    1. Snijder B, Pelkmans L. Origins of regulated cell-to-cell variability. Nature Reviews Molecular Cell Biology. 2011;12(2):119–125. doi: 10.1038/nrm3044 - DOI - PubMed
    1. Niepel M, Molloy KR, Williams R, Farr JC, Meinema AC, Vecchietti N, et al.. The nuclear basket proteins Mlp1p and Mlp2p are part of a dynamic interactome including Esc1p and the proteasome. Mol Biol Cell. 2013;24(24):3920–38. doi: 10.1091/mbc.E13-07-0412 - DOI - PMC - PubMed

MeSH terms

Substances