. 2024 Sep 5;20(9):e1012346.
doi: 10.1371/journal.pcbi.1012346. eCollection 2024 Sep.

pyPAGE: A framework for Addressing biases in gene-set enrichment analysis-A case study on Alzheimer's disease

Affiliations

pyPAGE: A framework for Addressing biases in gene-set enrichment analysis-A case study on Alzheimer's disease

Artemy Bakulin et al. PLoS Comput Biol. .

Abstract

Inferring the driving regulatory programs from comparative analysis of gene expression data is a cornerstone of systems biology. Many computational frameworks were developed to address this problem, including our iPAGE (information-theoretic Pathway Analysis of Gene Expression) toolset that uses information theory to detect non-random patterns of expression associated with given pathways or regulons. Our recent observations, however, indicate that existing approaches are susceptible to the technical biases that are inherent to most real world annotations. To address this, we have extended our information-theoretic framework to account for specific biases and artifacts in biological networks using the concept of conditional information. To showcase pyPAGE, we performed a comprehensive analysis of regulatory perturbations that underlie the molecular etiology of Alzheimer's disease (AD). pyPAGE successfully recapitulated several known AD-associated gene expression programs. We also discovered several additional regulons whose differential activity is significantly associated with AD. We further explored how these regulators relate to pathological processes in AD through cell-type specific analysis of single cell and spatial gene expression datasets. Our findings showcase the utility of pyPAGE as a precise and reliable biomarker discovery in complex diseases such as Alzheimer's disease.


Conflict of interest statement

The authors have declared that no competing interests exist.

Figures

Fig 1
Fig 1. Bias in gene-set annotations.
(A) Comparison between the theoretical and empirical degree distributions of gene-set membership in gene-set annotations. The red line represents the curve-fitting of the power law function to the observed distribution. (B) Scatter plots representing major sources of bias in biological annotations. The left panel represents the association between the protein abundance and the number of interactions a gene has in the STRING database. The right panel represents the association between the citation index of a particular gene and its gene-set membership in an annotation of biological pathways. For each association, we also report correlation between values. (C) Characteristics of gene-set membership degree distribution within TF regulon annotations are depicted. The top plot displays the observed distribution with a power law function fitted to it, including reporting the gamma parameter and the R^2 value. The bottom plot illustrates the deviation of the observed distribution from the expected power law.
Fig 2
Fig 2. pyPAGE is a novel framework for inference of differentially regulated gene-sets.
(A) Schematic of the pipeline we propose for the analysis of bulk RNA-seq data using pyPAGE. The pipeline starts with preprocessing of RNA-seq data and then diverges into two branches: one for the analysis of transcriptional regulation and the other for the analysis of post-transcriptional regulation. (B) Precision-recall curves demonstrating the performance of pyPAGE and benchmarking it against iPAGE and fgsea. The analysis was made in 4 simulated scenarios with and without added biases and with or without dual regulation patterns. As a general metric of performance we report PR-AUC score, also cross glyphs mark the performance at p-value threshold equal to 0.01. (C) Graphical representation of pyPAGE’s robustness to variations in input data quality. The analysis incorporates two distinct curves illustrating the effects of: 1) subsampling the data from 5% to 100% in increments of 5%, and 2) adjusting the parameter that dictates the fraction of deregulated genes within each regulon (note that the default value for this parameter is 0.5 which explains divergence of two curves at 1.0).
Fig 3
Fig 3. Transcription factors associated with gene expression changes in Alzheimer’s Disease.
(A) Regulons of TFs differentially expressed between AD and non-AD samples discovered by pyPAGE. In this representation the rows correspond to TFs and columns to gene bins of equal size ordered by differential expression, the cells are colored according to the enrichment of genes from regulons in a corresponding bin. The leftmost column of the heatmap depicts the differential expression of the regulator itself. (B) The barplot representing Pearson correlations between the expression of TFs and of their regulons, as measured by median TPM of its members. Asterix indicated significant correlation (p-value<0.05). (C) The scatter plot demonstrating association between the expression of the well-known AD regulator KDM5A with the expression of its regulon. (D) The association between the expression of another AD regulator ATF4 with the expression of its regulon. (E) Biological roles of the identified TFs inferred based on the functions of the genes controlled by these TFs. In these heatmap colored cells correspond to TFs whose regulons are significantly (p-value<0.05) enriched with genes from a corresponding biological pathway based on PantherDB. (F) Plot showcasing how robust are predictions of three different methods to subsampling of expression data. To measure consistency of the predictions we computed intersection over union (IoU) of the method’s output with and without subsampling of genes.
Fig 4
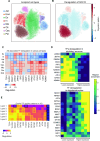
Fig 4. Cell type and regional specific differential activity patterns of transcriptional factors in AD.
(A) Cells from the analyzed ROSMAP dataset represented on a force-directed graph embedding. The clusters are colored according to cell-types: excitatory neurons (Ex), inhibitory neurons (In), astrocytes (Ast), oligodendrocytes (Oli), oligodendrocyte progenitor cells (Opc), microglia (Mic), endothelial cells (End), pericytes (Per). (B) The same cell-type clusters colored according to differential activity of SOX10 between cells from non-AD and AD samples estimated using pyPAGE. The magnitude of the regulation pattern was calculated as scaled conditional mutual information multiplied by the factor representing the direction of deregulation. (C) Summary of the cell-type specific deregulation patterns of the TFs identified in the analysis of the bulk data. Heatmap cells with significant associations (p-value<0.05) are framed. The regulation is calculated as the normalized conditional mutual information of the relationship multiplied by the sign of the log fold change. (D) Heatmap representations of concordant expression changes in expression of TF target genes in inhibitory neurons and oligodendrocytes. Here rows correspond to TFs and columns to gene bins of equal size ordered by differential expression, the cells are colored according to the enrichment of genes from regulons in a corresponding bin. (E) This heatmap summarizes deregulation patterns in various cortical layers of TFs that we previously identified in the analysis of bulk data. Heatmap cells with significant associations (p-value<0.05) are framed. Regulation pattern is estimated as normalized conditional mutual information of the association multiplied by the sign of log fold change.
Fig 5
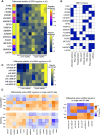
Fig 5. Deregulation of post-transcriptional regulatory programs in AD.
(A) Heatmap representation of RBP regulons that are differentially expressed between AD and non-AD which we identified using pyPAGE. Here rows correspond to RBPs and columns to gene bins of equal size ordered by differential stability, the cells are colored according to the enrichment of genes from regulons in a corresponding bin. The leftmost column of this heatmap represents the differential expression of RBPs themselves. (B) Various roles performed by the identified RBPs based on the analysis of scientific literature. In this representation colored cells represent a recorded association between a protein and corresponding mechanism of action. (C) Deregulation patterns of the miRNA target gene-sets identified by pyPAGE. *miR-506 targets with GTGCCTT in their 3’ untranslated region. (D) Differential activity of RBP and miRNA regulons in various brain cell types. The codes for the analyzed cell-types: neurons (Neur), astrocytes (Ast), oligodendrocytes (Oli), oligodendrocyte progenitor cells (Opc), microglia (Mic). Differential activity of RBP regulons was estimated based on differential rates of RNA splicing and degradation. miRNA regulons were analyzed using only estimates of degradation rates. In these heatmaps significant associations (p-value<0.05) are marked by colored frames. Regulation pattern is estimated as normalized conditional mutual information of the association multiplied by the sign of log fold change.
Fig 6
Fig 6. Association of activation of post-transcriptional regulation programs with survival of patients with AD.
(A) Heatmap representing differences in the activity of the previously identified post-transcriptional regulons in AD samples. Factors which activity is significantly associated with survival are underscored. The dendrogram reflects the results of unsupervised clustering of samples based on activity of factors associated with survival. (B) Kaplan-Meier curve representing the difference in survival between two groups of patients stratified based on the activity of post-transcriptional regulons. (C) Comparison of the activity of selected RBP regulons in healthy samples and samples from two AD clusters. (D) Summary of the Cox regression analysis.

References

    1. Goodarzi H, Elemento O, Tavazoie S. Revealing global regulatory perturbations across human cancers. Mol Cell. 2009. Dec 11;36(5):900. doi: 10.1016/j.molcel.2009.11.016 - DOI - PMC - PubMed
    1. Curtis C, Shah SP, Chin SF, Turashvili G, Rueda OM, Dunning MJ, et al. The genomic and transcriptomic architecture of 2,000 breast tumours reveals novel subgroups. Nature. 2012. Apr 18;486(7403):346–52. doi: 10.1038/nature10983 - DOI - PMC - PubMed
    1. Subramanian A, Tamayo P, Mootha VK, Mukherjee S, Ebert BL, Gillette MA, et al. Gene set enrichment analysis: A knowledge-based approach for interpreting genome-wide expression profiles. Proc Natl Acad Sci. 2005. Oct 25;102(43):15545–50. doi: 10.1073/pnas.0506580102 - DOI - PMC - PubMed
    1. Puente-Santamaria L, Wasserman WW, del Peso L. TFEA.ChIP: a tool kit for transcription factor binding site enrichment analysis capitalizing on ChIP-seq datasets. Bioinformatics. 2019. Dec 15;35(24):5339–40. doi: 10.1093/bioinformatics/btz573 - DOI - PubMed
    1. Park PJ. ChIP–seq: advantages and challenges of a maturing technology. Nat Rev Genet. 2009. Oct;10(10):669–80. doi: 10.1038/nrg2641 - DOI - PMC - PubMed