. 2024 Sep 5;20(9):e1012516.
doi: 10.1371/journal.ppat.1012516. eCollection 2024 Sep.

ATRX restricts Human Cytomegalovirus (HCMV) viral DNA replication through heterochromatinization and minimizes unpackaged viral genomes

Affiliations

ATRX restricts Human Cytomegalovirus (HCMV) viral DNA replication through heterochromatinization and minimizes unpackaged viral genomes

Ryan M Walter et al. PLoS Pathog. .

Abstract

ATRX limits the accumulation of human cytomegalovirus (HCMV) Immediate Early (IE) proteins at the start of productive, lytic infections, and thus is a part of the cell-intrinsic defenses against infecting viruses. ATRX is a chromatin remodeler and a component of a histone chaperone complex. Therefore, we hypothesized ATRX would inhibit the transcription of HCMV IE genes by increasing viral genome heterochromatinization and decreasing its accessibility. To test this hypothesis, we quantitated viral transcription and genome structure in cells replete with or depleted of ATRX. We found ATRX did indeed limit viral IE transcription, increase viral genome chromatinization, and decrease viral genome accessibility. The inhibitory effects of ATRX extended to Early (E) and Late (L) viral protein accumulation, viral DNA replication, and progeny virion output. However, we found the negative effects of ATRX on HCMV viral DNA replication were independent of its effects on viral IE and E protein accumulation but correlated with viral genome heterochromatinization. Interestingly, the increased number of viral genomes synthesized in ATRX-depleted cells were not efficiently packaged, indicating the ATRX-mediated restriction to HCMV viral DNA replication may benefit productive infection by increasing viral fitness. Our work mechanistically describes the antiviral function of ATRX and introduces a novel, pro-viral role for this protein, perhaps explaining why, unlike during infections with other herpesviruses, it is not directly targeted by a viral countermeasure in HCMV infected cells.


Conflict of interest statement

The authors have declared that no competing interests exist.

Figures

Fig 1
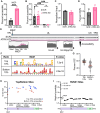
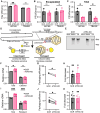
Fig 1. Depletion of ATRX in fibroblasts increases IE transcript accumulation during HCMV lytic infections.
A) Representative western blot of human foreskin fibroblasts (HFF) transduced with pLKO lentivirus expressing either a scrambled (SCR) shRNA control sequence or an shRNA sequence targeting ATRX (ATRX-KD). Values represent protein levels normalized to tubulin and relative to SCR. B) Quantification of multiple biological replicates of the experiment in panel A. ATRX and DAXX signals were normalized to tubulin and are reported relative to SCR. C) Schematic for targeting of sgRNA to the ATRX coding sequence to generate ATRX knockout cells. D) TIDE analysis from the polyclonal population of sgRNA transfected HFF cells. Total cutting efficiency is the percentage of Sanger sequencing signal with predicted indels at the Cas9 cut site. E) Clonal populations of cells (n = 200) were screened by Sanger sequencing for indels and plotted for the percentage of cells with indicated indels at the Cas9 cut site. F) Western blot for ATRX protein in wild-type (WT) positive control HFF cells, ATRX knockout cells (AKO), and negative control U-2 OS cells. Values represent ATRX protein level normalized to tubulin and relative to HFF-WT. G) HFF cells were infected with AD169 at an MOI of 0.1 and total RNA was harvested at 3 hpi, quantified by RT-qPCR, and normalized to GAPDH. Plotted values are relative to respective control cells. All experiments were performed with a minimum of 3 biological replicates. Error bars represent standard deviation and statistically significant differences are indicated with asterisks (* = P<0.05, ** = P<0.01, *** = P<0.001; Wilcoxon rank sum).
Fig 2
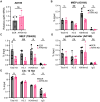
Fig 2. ATRX knockdown increases IE transcript and Early and Late protein accumulation during HCMV lytic infections.
A) HFF cells were infected with TB40/E at an MOI of 0.1 and total RNA was harvested at 3 hpi, quantified by RT-qPCR, normalized to GAPDH, and reported relative to SCR. B) Experiments performed as in panel A with a UL82-null strain of HCMV (AD169-Δpp71). C) HFF cells were infected with AD169 at an MOI of 0.1 and quantified by RT-qPCR at 3 hpi. Reported values are normalized to GAPDH and relative to SCR-IE1/2. D) HFF SCR (scr) and ATRX-KD (atrx) cells were infected with AD169 at an MOI of 0.1, harvested at the indicated time points, and cell lysates were analyzed by western blotting. Representative images are shown. E) Quantification of blots from experiments shown in panel D for IE1, UL44, and pp150 at 6, 24, and 96 hpi respectively. Reported values are normalized to tubulin and plotted relative to SCR. All experiments were performed with a minimum of 3 biological replicates. Error bars represent standard deviation and statistically significant differences are indicated with asterisks (* = P<0.05, ** = P<0.01, *** = P<0.001; t-test).
Fig 3
Fig 3. ATRX knockdown does not affect the number of cells initiating lytic viral IE and E gene expression.
A) The indicated HFF cells were mock infected (left) or infected with AD169 at an MOI of 0.1 (right), fixed at 6 hpi, and analyzed by immunofluorescence for IE1. B) The percentage of cells positive for IE1 at 6 hpi. C) The indicated HFF cells were mock infected (left) or infected with AD169 at an MOI of 0.1 (right), fixed at 24 hpi, and analyzed by immunofluorescence for UL44. D) The percentage of cells positive for UL44 at 24 hpi. Representative images of the indicated viral protein (red) and DAPI-stained nuclei (blue) are shown. Yellow scale bars represent 10μm. Experiments were performed with a minimum of 3 biological replicates. Each replicate represents a minimum of 100 cells. Error bars represent standard deviation and statistically significant differences are indicated with asterisks (* = P<0.05, ** = P<0.01, *** = P<0.001; t-test).
Fig 4
Fig 4. ATRX knockdown increases the accessibility of infecting HCMV genomes.
A) HFF cells were infected with AD169 at an MOI of 0.1 and harvested at 3 hpi. Accessible DNA was extracted from infected HFF cells by FAIRE and analyzed by qPCR for the HCMV MIEP. Plotted values are normalized to a reversed crosslinked input control sample. B) Experiments as in panel A were analyzed for control cellular loci. Experiments were performed with a minimum of 3 biological replicates. Error bars represent standard deviation and statistically significant differences are indicated with asterisks (* = P<0.05, ** = P<0.01, *** = P<0.001; t-test). C) HFF cells were infected with AD169 at an MOI of 0.1 and harvested at 3 hpi. Accessible DNA was extracted by ATAC and analyzed by Illumina sequencing (2x150bp). Input viral genomes were analyzed by qPCR (MIEP), normalized to cellular DNA (Chr.12), and reported relative to SCR. D) Percentage of ATAC-seq reads mapping to the HCMV genome relative to reads mapping to the human genome. E) Normalized coverage bigwig files from ATAC-seq are displayed using IGV, with zoomed-in coverage on promoter regions. F) The HCMV genome was split into 200bp fragments and the top 10% and bottom 10% were analyzed by MEME. Motifs are displayed with their indicated E-values. G) G/C content of the top and bottom 10% of the differentially accessible features between SCR and ATRX-KD cells (see also Table 1). H) The top (blue) and bottom (red) 10% of sites identified in Table 1 are plotted according to their location on the HCMV genome (x-axis) and their %GC (y-axis). I) The 200bp surrounding 59 putative RUNX1 motif sites were plotted according to their position on the HCMV genome (x-axis) and analyzed for their relative accessibility between ATRX-KD and SCR (y-axis).
Fig 5
Fig 5. ATRX-knockdown decreases the deposition of heterochromatin on incoming HCMV genomes.
A) HFF cells were infected with AD169 at an MOI of 0.1 and total RNA was harvested at 3 hpi, quantified by RT-qPCR, normalized to GAPDH, and reported relative to SCR. B) HFF cells were infected with AD169 at an MOI of 0.1 and harvested at 3 hpi. ChIP was performed with the indicated antibodies and analyzed by qPCR for the MIEP. Total H3, H3.3, H3K9me3, and IgG are plotted as percent input. C) Experiments performed as in panel B with the TB40/E strain of HCMV. D) Experiments performed as in panel B for the viral pp28 promoter. E) Experiments performed as in panel B for a control cellular locus. All experiments were performed with a minimum of 3 biological replicates. Error bars represent standard deviation and statistically significant differences are indicated with asterisks (* = P<0.05, ** = P<0.01, *** = P<0.001; t-test).
Fig 6
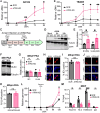
Fig 6. Depletion of ATRX increases HCMV viral DNA replication independent of the increase in IE gene expression.
A) HFFs were infected with AD169 at an MOI of 0.1 and harvested at the indicated time points. Total DNA was analyzed by qPCR for viral genomes (MIEP) and normalized to cellular DNA (GAPDH). Plotted values are relative to respective inputs (3h). B) Experiments performed as in panel A with the TB40/E strain of HCMV. C) Summary of experimental approach for PAA experiments. HFF cells were either mock infected or infected with AD169 at an MOI of 0.1 and treated with PAA at 100ug/mL. 48 hpi after infection PAA was washed out and cells were not treated (NT) with any drug for the remaining time points. Total DNA was harvested at indicated time points. D and F) Western blot in HFF SCR (scr) and ATRX-KD (atrx) for the indicated proteins in mock-infected and cells infected with AD169 for the indicated time in the presence of 100μg/mL PAA. E) Quantification of blots from panel D for IE1 or UL44 at 6 hpi or 24 hpi respectively. Values are normalized to tubulin and plotted relative to SCR. G) Quantification of blots from 48 hpi in panel F for IE1 or UL44 normalized to tubulin and plotted relative to SCR. H-K) HFF cells were infected with AD169 at an MOI of 0.1 in the presence of PAA, fixed at 48 hpi, and analyzed by immunofluorescence. H and J) Representative images of viral proteins (red) and DAPI-stained nuclei (blue) are shown. Yellow scale bars represent 10μm. I and K) The percentage of cells positive for the indicated HCMV protein at 48 hpi in the presence of PAA. Each replicate represents a minimum of 100 cells. L) Total DNA was analyzed as described in panel C by qPCR for viral genomes (MIEP) and normalized to cellular DNA (GAPDH) at the time points indicated. Plotted values are relative to respective inputs (3h). M) HFF cells were infected with AD169 at an MOI of 0.1 for 48 hours in the presence of 100ug/mL PAA. ChIP was performed with the indicated antibodies and analyzed by qPCR. Total H3, H3.3, H3K9me3, and IgG are plotted as percent input. All experiments were performed with a minimum of 3 biological replicates. Error bars represent standard deviation and statistically significant differences are indicated with asterisks (* = P<0.05, ** = P<0.01, *** = P<0.001; t-test).
Fig 7
Fig 7. ATRX knockdown increases the initiation of viral DNA replication.
A) HFF cells were infected with AD169 at an MOI of 0.1 for 3hpi. Total DNA was harvested and absolute quantification by qPCR was performed for viral genomes (IE1) per two copies of cellular DNA (GAPDH). B) HFF cells infected with AD169 at an MOI of 0.1 were fixed at 48 hpi and analyzed by immunofluorescence. Representative images of UL44 foci (red) and DAPI-stained nuclear DNA (blue) are shown. Yellow scale bars represent 10μm. C) The percentage of HCMV-infected cells with UL44 foci as imaged in panel B is shown. D) The number of UL44 foci per HCMV infected cells as imaged in panel B is shown. Each point represents an individual nucleus with a minimum of 50 nuclei per replicate. The mean is represented by a blue line. The number of cells is indicated next to the data points. All experiments were performed with a minimum of 3 biological replicates. Error bars represent standard deviation and statistically significant differences are indicated with asterisks (* = P<0.05, ** = P<0.01, *** = P<0.001; t-test (panel A and C) or Mann Whitney (panel D)).
Fig 8
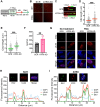
Fig 8. Depletion of ATRX in fibroblasts increases the rate of HCMV DNA replication.
A) Schematic for single-molecule DNA fiber analysis. HFF cells were fully contact inhibited and then infected with AD169 at an MOI of 0.1 for 48hr in the absence (NT) or presence of 100μg/mL PAA. Cells were then labeled with IdU (red) and CldU (green). B) Representative images of DNA fibers in the indicated samples with or without PAA. C) Representative images of individual DNA fibers. Values represent measured fiber lengths in μm. D) Each point represents the length of a single IdU-labeled DNA fiber. At least 140 individual fibers were measured for each condition. Similar results were obtained for three independent biological replicates of HCMV infection. E) CldU fiber analysis as in panel D. F) Mean fiber lengths determined as in panels D and E are plotted as DNA base pairs per minute (bp/min) for each biological replicate. G-I) HFF cells infected with AD169 at an MOI of 0.1 and either untreated or PAA treated. Cells were then labeled with EdU at 48hpi, fixed and EdU was labeled with Alexa Fluor 488 by a click reaction. Cells were then analyzed by immunofluorescence. G) Representative images of UL44 foci (red), EdU-labeled DNA (green), and DAPI-stained nuclear DNA (blue) are shown. Yellow scale bars represent 10μm. H and I) Zoomed-in representative images of nuclei from panel G of indicated cell type. Yellow bars represent 10μm and white bars represent a 25μm path of fluorescent intensity analysis across a lateral section. All experiments were performed with a minimum of 3 biological replicates. Error bars represent standard deviation and statistically significant differences are indicated with asterisks (* = P<0.05, ** = P<0.01, *** = P<0.001; Mann Whitney (panel D and E) or t-test (panel F)).
Fig 9
Fig 9. Depletion of ATRX in fibroblasts decreases the efficiency of viral genome packaging.
A) HFF cells were infected with the indicated strain of HCMV at an MOI of 0.1 and viral progeny collected at 96 hpi were quantified by plaque assay. B) Encapsidated viral DNA from cell-free viral progeny collected as in panel A was harvested by DNAzol extraction and absolute quantitation by qPCR (IE1) was performed. The ratio of PFU per encapsidated viral genome was analyzed and reported relative SCR. C) HFFs were infected as in panel A. At 96 hpi total DNA was harvested and analyzed by qPCR for viral genomes (MIEP) and normalized to cellular DNA (GAPDH). The ratio of PFU per total viral DNA was analyzed and reported relative SCR. D) Schematic model of HCMV DNA packaging assays. Concatemeric viral DNA genomes are susceptible to DNase-I digestion, whereas packaged DNA is protected. The HCMV terminase complex (UL56/UL89) cleaves concatemeric HCMV genomes into single units during capsid packaging, which is inhibited by Letermovir treatment. The pac sequence is recognized by the terminase complex which cleaves the genome at the terminus. A zoomed-in view of the terminus is depicted with surrounding KpnI restriction sites. Following KpnI restriction enzyme digestion, concatemeric viral DNA yields an ~8.4-kb fragment, whereas cleaved/packaged DNA results in a shortened ~4-kb fragment. Both fragments are recognized by the digoxigenin-labeled probe. E) Representative image of Southern blot analysis of HFF cells infected with AD169 at an MOI of 0.1 for 96 hpi and either mock-treated (DMSO) or treated with Letermovir (Let). Blotting was carried out using the terminal DNA probe depicted in panel D. F) Blots from panel E were quantified for total (8.4kb + 4kb) and cleaved (4kb). Plotted values are relative to SCR-Total. G) Data from panel F were used to calculate percent packaged by the ratio of the signal intensity of the cleaved (4kb) band over the total (8kb+4kb). H) Fold decrease is calculated as the negative fold change of percent packaged DNA between DMSO and Letermovir treatment. SCR and ATRX were statistically compared to their respective DMSO control. I) HFFs were infected with AD169 at an MOI of 0.1 and harvested at 96hpi. Lysates were either mock-treated or treated with DNase-I. DNA was then harvested and analyzed by qPCR for viral genomes (MIEP) and normalized to mock-treated cellular DNA (GAPDH). Plotted values are relative to SCR-Total. J) Data from panel I for the percent packaged is calculated by the ratio of resistant DNA to total. K) Fold decrease is calculated as the negative fold change of percent packaged DNA between DMSO and Letermovir treatment. SCR and ATRX were statistically compared to their respective DMSO control. All experiments were performed with a minimum of 3 biological replicates. Error bars represent standard deviation and statistically significant differences are indicated with asterisks (* = P<0.05, ** = P<0.01, *** = P<0.001; t-test).
Fig 10
Fig 10. Model for anti- and pro-viral effects of ATRX on HCMV lytic replication.
Top. ATRX heterochromatinizes viral genomes and restricts viral transcription at immediate early (IE) times acting in an anti-viral manner unless inactivated by the pp71-mediated degradation of Daxx. However, at early times HCMV capitalizes on ATRX heterochromatinization to prevent the over-replication of viral genomes. Here, ATRX acts in a pro-viral manner to allow for efficient viral genome packaging into capsids at Late times. Bottom. In ATRX-depleted cells, viral IE transcription and DNA replication are both enhanced, but viral genomes are packaged less efficiently.

Similar articles

Cited by

References

    1. Saffert RT, Kalejta RF. Promyelocytic leukemia-nuclear body proteins: herpesvirus enemies, accomplices, or both? Future Virology. 2008. May;3(3):265–77. doi: 10.2217/17460794.3.3.265 - DOI - PMC - PubMed
    1. Lukashchuk V, Everett RD. Regulation of ICP0-Null Mutant Herpes Simplex Virus Type 1 Infection by ND10 Components ATRX and hDaxx. Journal of Virology. 2010. Apr 15;84(8):4026–40. doi: 10.1128/JVI.02597-09 - DOI - PMC - PubMed
    1. Jurak I, Silverstein LB, Sharma M, Coen DM. Herpes Simplex Virus Is Equipped with RNA- and Protein-Based Mechanisms To Repress Expression of ATRX, an Effector of Intrinsic Immunity. J Virol. 2012. Sep 15;86(18):10093–102. doi: 10.1128/JVI.00930-12 - DOI - PMC - PubMed
    1. Cabral JM, Oh HS, Knipe DM. ATRX promotes maintenance of herpes simplex virus heterochromatin during chromatin stress. eLife. 2018. Nov 22;7:e40228. doi: 10.7554/eLife.40228 - DOI - PMC - PubMed
    1. Tsai K, Chan L, Gibeault R, Conn K, Dheekollu J, Domsic J, et al.. Viral Reprogramming of the Daxx Histone H3.3 Chaperone during Early Epstein-Barr Virus Infection. Longnecker RM, editor. J Virol. 2014. Dec 15;88(24):14350–63. doi: 10.1128/JVI.01895-14 - DOI - PMC - PubMed

MeSH terms