. 2024 Oct 18;386(6719):eadn9083.
doi: 10.1126/science.adn9083. Epub 2024 Oct 18.

In vivo dendritic cell reprogramming for cancer immunotherapy

Affiliations

In vivo dendritic cell reprogramming for cancer immunotherapy

Ervin Ascic et al. Science. .

Abstract

Immunotherapy can lead to long-term survival for some cancer patients, yet generalized success has been hampered by insufficient antigen presentation and exclusion of immunogenic cells from the tumor microenvironment. Here, we developed an approach to reprogram tumor cells in vivo by adenoviral delivery of the transcription factors PU.1, IRF8, and BATF3, which enabled them to present antigens as type 1 conventional dendritic cells. Reprogrammed tumor cells remodeled their tumor microenvironment, recruited, and expanded polyclonal cytotoxic T cells; induced tumor regressions; and established long-term systemic immunity in multiple mouse melanoma models. In human tumor spheroids and xenografts, reprogramming to immunogenic dendritic-like cells progressed independently of immunosuppression, which usually limits immunotherapy. Our study paves the way for human clinical trials of in vivo immune cell reprogramming for cancer immunotherapy.


Conflict of interest statement

Competing interests: F.F.R., C.F.P., and C.-F.P. have equity interest and serve in management positions, and F.Å, A.R., X.H., and E.R. are employees at Asgard Therapeutics AB, which develops cancer immunotherapies based on in vivo DC reprogramming technologies. F.F.R., C.F.P., and C.-F.P. are inventors on granted patents U.S. 11,345.891, JP 7303743, CN ZL201880005047.3, patent application WO 2018/185709, and patent application WO 2022/243448 (together with O.Z. and E.A.) held by Asgard Therapeutics that cover the cel reprogramming approach described here.

Figures

Fig. 1
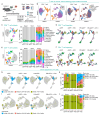
Fig. 1. In vivo cDC1 reprogramming elicits systemic and durable antitumor immunity.
(A) Experimental strategy to induce cDC1 reprogramming in vivo employing a polycistronic lentiviral vector encoding the transcription factors PU.1, IRF8, and BATF3 (PIB) followed by IRES-eGFP. First, in vivo cDC1 reprogramming was tested by implantation of a mixture of transduced cancer cells and untransduced parental cells to assess antitumor immunity. Secondly, human cancer cells were reprogrammed in spheroids with immunosuppressive cells and in xenografts. Third, lentiviral (LV), adenoviral (Ad), and adeno-associated viral (AAV) vectors were tested to deliver PIB to tumors in situ as a cancer gene therapy. (B) C57BL/6J mice were injected subcutaneously with melanoma cells (B16, YUMM1.7, B2905) after transduction with PIB-eGFP or control eGFP and mixing 1:1 with parental cells (measured percentages by flow cytometry at day 3 are indicated) to induce tumor cell reprogramming in vivo along with tumor establishment. Anti-PD-1, anti-CTLA-4 or isotype control antibodies were administered by intraperitoneal injection at days 7, 10 and 13. Tumor growth and survival are shown (n=5). (C) Flow cytometry quantification of tumor antigen-specific IFNγ+CD8+ or IFNγ+CD4+ T cells from peripheral blood at day 14. T cells were isolated and re-stimulated in vitro using an antigen-agnostic approach with IFNγ-stimulated melanoma cell lines. Data indicate mean ± SD of 4-5 biological replicate experiments. (D) Tumor growth and survival of BATF3KO mice after injection with PIB-eGFP- or eGFP-transduced BRAFV600ECOX1/2KO melanoma cells (n=5-6). (E) Quantification of tumor-antigen specific IFNγ+CD8+ or IFNγ+CD4+ T cells from peripheral blood with the antigen-agnostic approach applied in (C). Data indicate mean ± SD of 4-6 biological replicate experiments. (F) Survivor C57BL/6J mice that remained tumor-free for 100 days were re-challenged with YUMM1.7 cells. Age-matched naïve mice were used as controls and tumor growth and survival are shown (n=5). (G) Bilateral YUMM1.7 tumor growth after injection of 1:1 mixtures into the treated flank (right) and untransduced cells into the non-treated flank (left), as monotherapy (PIB-eGFP) or in combination with anti-PD-1 or anti-CTLA-4 (n=10). (H) Control Lewis lung adenocarcinoma (LLC) tumor growth within the same animals. Data in panel G and H indicate mean ± SD of 10 biological replicate experiments. (I) Representative pictures of animals with bilateral YUMM1.7 (treated and non-treated) and LLC tumors. Arrows indicate tumor locations and dashed lines tumor sizes. Survival analyses in panel B, D and F were performed by log-rank Mantel-Cox test. Comparisons in panels C, E, G and H were analyzed using the Mann-Whitney test. ns - non-significant, *p<0.05, **p<0.01, ***p<0.001, ****p<0.0001.
Fig. 2
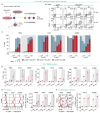
Fig. 2. cDC1 reprogramming remodels the tumor microenvironment.
(A) Hematoxylin and eosin (H&E) staining (top) and immunofluorescence (bottom) analysis of paraffin-embedded YUMM1.7 tumors 9 days after subcutaneous implantation of PIB-eGFP- or control eGFP-transduced cells (1:2 ratio of transduced to parental cells). Tumor sections were stained for eGFP (green, transduced cells), CD45 (purple, immune cells) and nuclei (blue, Syto 13) (n=3). Arrows indicate TLS-like structures. Scale bars are 500μm. (B) H&E (left) and immunofluorescence (right) of a TLS in PIB-eGFP tumors stained for CD19 (B cells), CD4 (CD4+T cells), CD8 (CD8+T cells) and PDPN (podoplanin+ stromal cells). Dashed lines indicate TLS border. Scale bars are 100μm. (C) Volumes of YUMM1.7 tumors 21 days after establishment and treatment with anti-PD-1 (grey and blue) or isotype control (black and red) antibodies at days 7, 10, and 13 (n=8-10). (D) Flow cytometry quantification of the percentages of tumor-infiltrating CD45+ cells and (E) CD19+ B cells, CD49b+CD3- NK cells and CD8+ and CD4+ T cells. (F) Quantification of PD-1+CD8+ and PD-1+CD4+ T cells. (G) Percentages of CD44+CD62L- effector memory and CD44+CD62L+ central memory CD8+ and CD4+ T cells. (H) Quantification of Ki-67+ proliferative, (I) TCF-1+CD8+and TCF-1+CD4+ T cells, (J) PD-1+CD25+ regulatory CD8+ T cells, and (K) CD25+CD4+ Tregs. (L) Percentages of CD8+ and CD4+ T cells in the tumor-draining lymph nodes. Data in panel C-L indicate mean ± SD of 8-10 biological replicate experiments. (M) Mice were subjected to antibody-mediated depletion of CD8+ T cells (αCD8), CD4+ T cells (αCD4), NK cells (αNK1.1) or isotype controls and tumors established with a mixture of transduced and untransduced YUMM1.7 cells. Tumor growth (left) and survival (right) are shown (n=10). Comparisons in panel C-L were analyzed using the Mann-Whitney test. *p<0.05, **p<0.01, ***p<0.001, ****p<0.0001.
Fig. 3
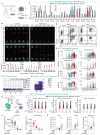
Fig. 3. In vivo reprogrammed melanoma cells expand polyclonal CD4+ T cells.
(A) Experimental design for 5’ single cell RNA-seq with TCR enrichment. YUMM1.7 tumors were established with a 1:1 mixture of PIB-eGFP or control eGFP-transduced and untransduced cells. Peripheral blood, tumor-draining lymph nodes (tdLN) and tumors were isolated 21 days after tumor establishment and CD45+CD3+ T cells were FACS-purified before loading on a 10x Chromium. Additional groups received intraperitoneally anti-PD-1 at days 7, 10 and 13 (n=5). (B) Principal component analysis of CD8+ and CD4+ T cells visualized by Uniform manifold approximation and projection (UMAP) plots from tumors, tdLN and blood (left) across treatment conditions (right). (C) UMAP plot showing color-coded CD8+ T cell subsets (left). Bar plots show the percentages of each CD8+ T cell subset in blood, tdLN and tumors (right). CD8+ T cell subsets are numbered from 0 to 8. (D) Trajectory analysis (black line) of CD8+ T cells across treatment conditions. (E) UMAP plot showing color-coded CD4+ T cell subsets (left). Bar plots (right) show the percentages of each CD4+ T cell subset in blood, tdLN and tumors. CD4+ T cell subsets are numbered from 0 to 11. (F) Trajectory analysis (black line) of CD4+ T cells across treatment conditions. (G) CD8+ T cells isolated from tumors, tdLN and blood were color-coded by clonotype size into small (between 1 and 5 cells), medium (between 5 and 20 cells), and large (>20 cells) clones and projected onto UMAP plots across treatment conditions. TCR sequences detected in only one single cell were excluded from this analysis. (H) Bar plots showing percentages of CD8+ T cells in blood, tdLN and tumors and their clonotype distribution. The numbers of unique clones are indicated within the bars. (I) Tumor, tdLN and blood-derived CD4+ T cell clonotype sizes projected onto UMAP plots and (J) bar plots showing percentages of CD4+ T cells and their clonotype distribution. Comparisons in C and E were performed using the exact Binomial test. Relevant statistical comparisons between intratumoral T cells for the conditions eGFP vs. PIB-eGFP and eGFP+anti-PD-1 vs. PIB-eGFP+anti-PD-1 are shown. All statistical comparisons can be found in data S1. **p<0.01, ****p<0.0001.
Fig. 4
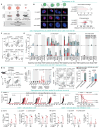
Fig. 4. Induction of a cDC1 phenotype in human cancer cells.
(A) Experimental design to assess phenotypic cDC1 reprogramming in vivo. Human cancer cell lines were transduced with PIB-eGFP, implanted in NSG mice and isolated at days 3, 5, and 9 for phenotypic profiling by flow cytometry. eGFP-transduced cells were used as controls and in vitro reprogrammed cells for comparison. Reprogramming efficiency was evaluated by flow cytometry as the percentage of CD45+HLA-DR+ cells (completely reprogrammed) and CD45+HLA-DR- or CD45-HLA-DR+ cells (partially reprogrammed) gated in eGFP+ transduced cancer cells. (B) Representative flow cytometry plots and (C) quantification of reprogramming kinetics in vitro and in vivo of the glioblastoma cell line T98G (gated in CD44+eGFP+ cells), and melanoma lines A375 and A2058 cells (gated in CD44+MCSP+eGFP+ cells) (n=3). (D) Percentages of XCR1+ (left), CLEC9A+ (middle) and CD226+ (right) cells after 5 days of in vitro or in vivo reprogramming in CD44+eGFP+ cells for T98G and CD44+MCSP+eGFP+ for melanoma A375 and A2058. (E) Histograms (left) and quantification (right) of surface HLA-ABC molecules per cell gated in CD44+eGFP+ cells for T98G and CD44+MCSP+eGFP+ for melanoma A375 and A2058 (n=3). (F) Histograms (left) and quantification (right) of the percentages of cells expressing CD40 (n=3). Data in panels C-F indicate mean ± SD of 3 biological replicate experiments.
Fig. 5
Fig. 5. Reprogramming progresses on spheroids and in immunosuppressive tumor environments.
(A) Experimental design to evaluate cDC1 reprogramming in human cancer spheroids. Cancer cells were transduced with PIB-eGFP or PIB-mCherry and used to form spheroids (3D) or cultured in monolayer (2D). (B) Confocal microscopy images and quantification of microtissue area and percentages of CD45+ and HLA-DR+ cells in T98G-derived spheroids after 9 days of reprogramming with PIB-mCherry at increasing multiplicities of infection (MOI). Data indicate mean ± SD of 2-10 biological replicate experiments. (C) Flow cytometry quantification of cDC1 reprogramming efficiency in 12 human cancer cell lines in 2D and 3D at day 9 of reprogramming gated in transduced eGFP+ cells. Reprogramming efficiency was evaluated by flow cytometry as the percentage of CD45+HLA-DR+ cells (completely reprogrammed) and CD45+HLA-DR- or CD45- HLA-DR+ cells (partially reprogrammed). Data indicate mean ± SD of 4-12 biological replicate experiments. (D) Representative flow cytometry plots showing phenotype of reprogrammed T98G and A375 cells in 2D and 3D compared to eGFP-transduced cells. (E) Reprogrammed and partially reprogrammed T98G cells were purified at reprogramming days 3, 7, and 9 and profiled by scRNA-seq. Violin plots show mRNA expression of endogenous transcription factors and cDC1 genes along the reprogramming time course in 2D and 3D. eGFP-transduced cells were used as day 0; donor peripheral blood cDC1s served as reference. (F) Integration of scRNA-seq data with data from published DC subsets (GSE94820) (54). Heatmap shows the percentage of cells transcriptionally affiliated with individual DC subsets. (G) Heatmap showing percentage of tumor-APC gene signature activation (23). (H) Experimental design to evaluate the effect of immunosuppression in cDC1 reprogramming using spheroids containing T98G-eGFP+ cells combined with cancer-associated fibroblasts (CAFs), myeloid-derived suppressor cells (MDSCs) or pericytes at indicated ratios. (I) Reprogramming efficiency gated in T98G-eGFP+ mCherry+ cells in spheroids with increasing proportions of CAFs (n=3-9, left), MDSC (n=3, middle), and pericytes (n=6-7, right). CAF07 and MDSC1 refer to cells from one individual donor. Data indicate mean ± SD of 3-9 biological replicate experiments. (J) Spheroid sizes as a measure of T cell cytoxicity against T98G-eGFP+ containing CAFs after 7 days of co-culture with non-activated HLA-A2-matched PBMCs, pre-activated with anti-CD3 and anti-CD28 antibodies, or stimulated with IL-2 and IL-7. Relative fluorescence units (RFU) were quantified by the eGFP+ fluorescence area by imaging. Data indicate mean ± SD of 14-18 biological replicate experiments. (K) Quantification of cytokine release 24 hours after co-culture of non-activated HLA-A2-matched PBMCs from three donors with T98G-eGFP+ spheroids containing CAFs. Data indicate mean ± SD of 9-12 biological replicate experiments. Comparisons in panels C and I were analyzed using two-way ANOVA and in panels J and K using one-way ANOVA followed by Tukey’s multiple comparison test, ns - non-significant; **p<0.01; ***p<0.001; ****p<0.0001.
Fig. 6
Fig. 6. Efficient delivery of cDC1 reprogramming factors with adenoviral vectors.
(A) Experimental design to prioritize a viral vector for delivery of PIB factors to tumors. Lentiviral (LV), adenoviral (Ad), and adeno-associated viral (AAV) transduction and reprogramming efficiencies were quantified using mouse and human cancer cell lines and patient-derived cancer cells in monolayer (2D), spheroids (3D), and tumors in vivo. (B) Light sheet microscopy pictures (left) and quantification (right) of T98G tumor spheroid transduction and penetration with eGFP-encoding LV, Ad and AAV vectors. Fixed tumor spheroids were stained against eGFP (red) and nuclei with DAPI (blue). The illustration (upper) visualizes the 3D image construction of the spheroid below. 3D image construction was performed by imaging and stacking of planes. Illustrated axes indicate the direction of the imaged planes. Viral surface coverage and penetrance were quantified by Zeiss Arivis image analysis software. Scale bar is 200 μm. Data indicate mean ± SD of 2-3 biological replicate experiments. (C) Representative flow cytometry plots and (D) quantification of reprogramming efficiency in patient-derived cancer cells 9 days post transduction in 2D or 3D with PIB-encoding LV, Ad and AAV vectors (LV-PIB-eGFP, Ad-PIB-eGFP, AAV-PIB-eGFP). H&N, head and neck cancer. Data indicate mean ± SD of 2-3 biological replicate experiments. (E) Experimental design to evaluate transduction efficiency in situ using subcutaneous B16 tumors in C57BL/6J mice. Tumors were injected with 3 doses of LV-eGFP, Ad-eGFP, AAV-eGFP vectors or PBS at day 7 and 9 and isolated at day 12 for analysis. (F) Representative flow cytometry plots with transduction efficiency of Ad-eGFP when compared to PBS gated in CD45-CD44+ cells and (G) quantification of eGFP+ cells of tumors transduced with the 3 viral vectors or PBS. Quantification of viral particles is shown. Data indicate mean ± SD of 9-25 biological replicate experiments. (H) Human SKLMS1 and A2058 tumors were established in NXG mice and injected 4 times intratumorally with Ad-PIB-eGFP or Ad-Stuffer-eGFP at day 7, 9,11 and 13 and analyzed at day 16 by flow cytometry. Representative flow cytometry plots (left) and quantification (right) of reprogramming efficiency gated in eGFP+ cells. Comparisons between CD45+HLA-DR+ populations (red) were used for statistical analysis. Data indicate mean ± SD of 8-10 biological replicate experiments. (I) YUMM1.7 tumors were established with decreasing doses of PIB-eGFP-transduced cells mixed with parental cell line. Percentages of reprogrammed cells (CD45+ and MHC-II+) in cell mixtures were quantified by flow cytometry at day 9 post transduction from parallel in vitro cultures. Tumor growth (left) and survival (right) are shown (n=10). The number of complete responses (CR) over the total number of mice per group is indicated. (J) Quantification of CD8+ T cell numbers (left), and percentages of effector CCR7-CD45RA-CD8+ (middle) and cytotoxic CD95+CD8+ T cells (right) after 8 days of co-culture with Ad-eGFP or Ad-PIB-eGFP transduced M2778 cells with (50%) or without (100%) CAFs in 2D. (K) Quantification of CD8+ T cell numbers within spheroids (left), and percentages of effector CCR7-CD45RA- CD8+ (middle) and cytotoxic CD95+CD8+ T cells (right). Data in panel J and K indicate mean ± SD of 3-4 biological replicate experiments. Comparisons in panels B were analyzed using One-Way ANOVA followed by Dunn’s multiple comparison test. Comparisons in panels H, J and K were analyzed using Mann Whitney test. Survival analysis in panel I was performed by log-rank Mantel-Cox test, ns - non-significant; **p<0.01; ***p<0.001; ****p<0.0001.
Fig. 7
Fig. 7. cDC1 reprogramming gene therapy elicits systemic and long-term antitumor immunity.
(A) Experimental design to assess antitumor efficacy of Ad-PIB gene therapy in C57BL/6J mice with subcutaneous B16 melanoma tumors. Tumors were injected 4 times with Ad-PIB (red), non-coding Ad vector control (Ad-Stuffer, gray), or PBS (black) at day 7, 9, 11, and 13 after tumor establishment. Anti-PD-1 and anti-CTLA-4 (ICB) were administered intraperitoneally at day 7,10, and 13. Survivor mice were further subcutaneously re-challenged with B16 cells at day 100 and intravenously at day 160. Gray box indicates the time of treatment. (B) Tumor growth (left) and survival (right) (n=8-10). The number of complete responses (CR) over the total number of mice per group is indicated. (C) Flow cytometry quantification of tumor-infiltrating lymphoid cells at day 16. Data indicate mean ± SD of 7-10 biological replicate experiments. (D) Correlation of CD8+ T cell infiltration and tumor size. (E) Percentages of intratumoral T-bet+PD-1- effector, T-bet+PD-1+ exhausted, and T-bet- PD-1+ terminally exhausted CD8+ T cells. Comparisons between the indicated color-coded populations were used for statistical analysis. (F) Ratio of intratumoral T-bet+CD44+CD4+ T helper (Th) cells and CD44+CD25+ T regulatory (Treg) cells. (G) PD-L1 expression in myeloid cells measured by mean fluorescence intensity (MFI). (H) Flow cytometry quantification of tumor antigen p15E-specific CD8+ T cells in tumor-draining lymph nodes (tdLN) and non-draining lymph nodes. (I) Percentages of CD44+CD62L- effector memory and CD44+CD62L+ central memory CD8+ T cells in tdLN. Data in panel E-l indicate mean ± SD of 6-10 biological replicate experiments. (J) Survivor mice and naïve control mice were re-challenged subcutaneously with B16 cells. Tumor growth (left) and survival (right) are shown (n=4-5). (K) Flow cytometry quantification of tumor antigen-specific T cells from peripheral blood at day 14 after in vitro re-stimulation with peptides TRP-2-, PMEL- and p15E. Percentages of TRP-2-, PMEL- and p15E-specific IFNγ+CD44+CD62L- effector memory CD8+ T cells. Data indicate mean ± SD of 4-5 biological replicate experiments. (L) Survivor mice were further re-challenged intravenously with B16 cells. Images of lungs from survivor and naïve mice 14 days after rechallenge (n=4). Comparisons in panel C, E, G, and I were analyzed using One-Way ANOVA followed by Dunn’s multiple comparison test. Comparisons in panels H and K were analyzed using the Mann Whitney test. Survival analyses in panel B and J was performed by log-rank Mantel-Cox test. *p<0.05, **p<0.01; ***p<0.001.

Comment in

References

    1. Sharma P, Hu-Lieskovan S, Wargo JA, Ribas A. Primary, adaptive, and acquired resistance to cancer immunotherapy. Cell. 2017;168:707–723. doi: 10.1016/j.cell.2017.01.017. - DOI - PMC - PubMed
    1. Puig-Saus C, Sennino B, Peng S, Wang CL, Pan Z, Yuen B, Purandare B, An D, Quach BB, Nguyen D, Xia H, et al. Neoantigen-targeted CD8+ T cell responses with PD-1 blockade therapy. Nature. 2023;615:697–704. doi: 10.1038/s41586-023-05787-1. - DOI - PMC - PubMed
    1. Bawden EG, Wagner T, Schröder J, Effern M, Hinze D, Newland L, Attrill GH, Lee AR, Engel S, Freestone D, de Lima Moreira M, et al. CD4+ T cell immunity against cutaneous melanoma encompasses multifaceted MHC II-dependent responses. Sci Immunol. 2024;9:eadi9517. - PubMed
    1. Larkin J, Chiarion-Sileni V, Gonzalez R, Grob J-J, Rutkowski P, Lao CD, Cowey CL, Schadendorf D, Wagstaff J, Dummer R, Ferrucci PF, et al. Five-year survival with combined nivolumab and ipilimumab in advanced melanoma. N Engl J Med. 2019;381:1535–1546. - PubMed
    1. Adams S, Loi S, Toppmeyer D, Cescon DW, De Laurentiis M, Nanda R, Winer EP, Mukai H, Tamura K, Armstrong A, Liu MC, et al. Pembrolizumab monotherapy for previously untreated, PD-L1-positive, metastatic triple-negative breast cancer: Cohort B of the phase II KEYNOTE-086 study. Ann Oncol. 2019;30:405–411. - PubMed

Publication types

MeSH terms

Substances