. 2024 Sep 6;385(6713):eadi1650.
doi: 10.1126/science.adi1650. Epub 2024 Sep 6.

The use of ectopic volar fibroblasts to modify skin identity

Affiliations

The use of ectopic volar fibroblasts to modify skin identity

Sam S Lee et al. Science. .

Abstract

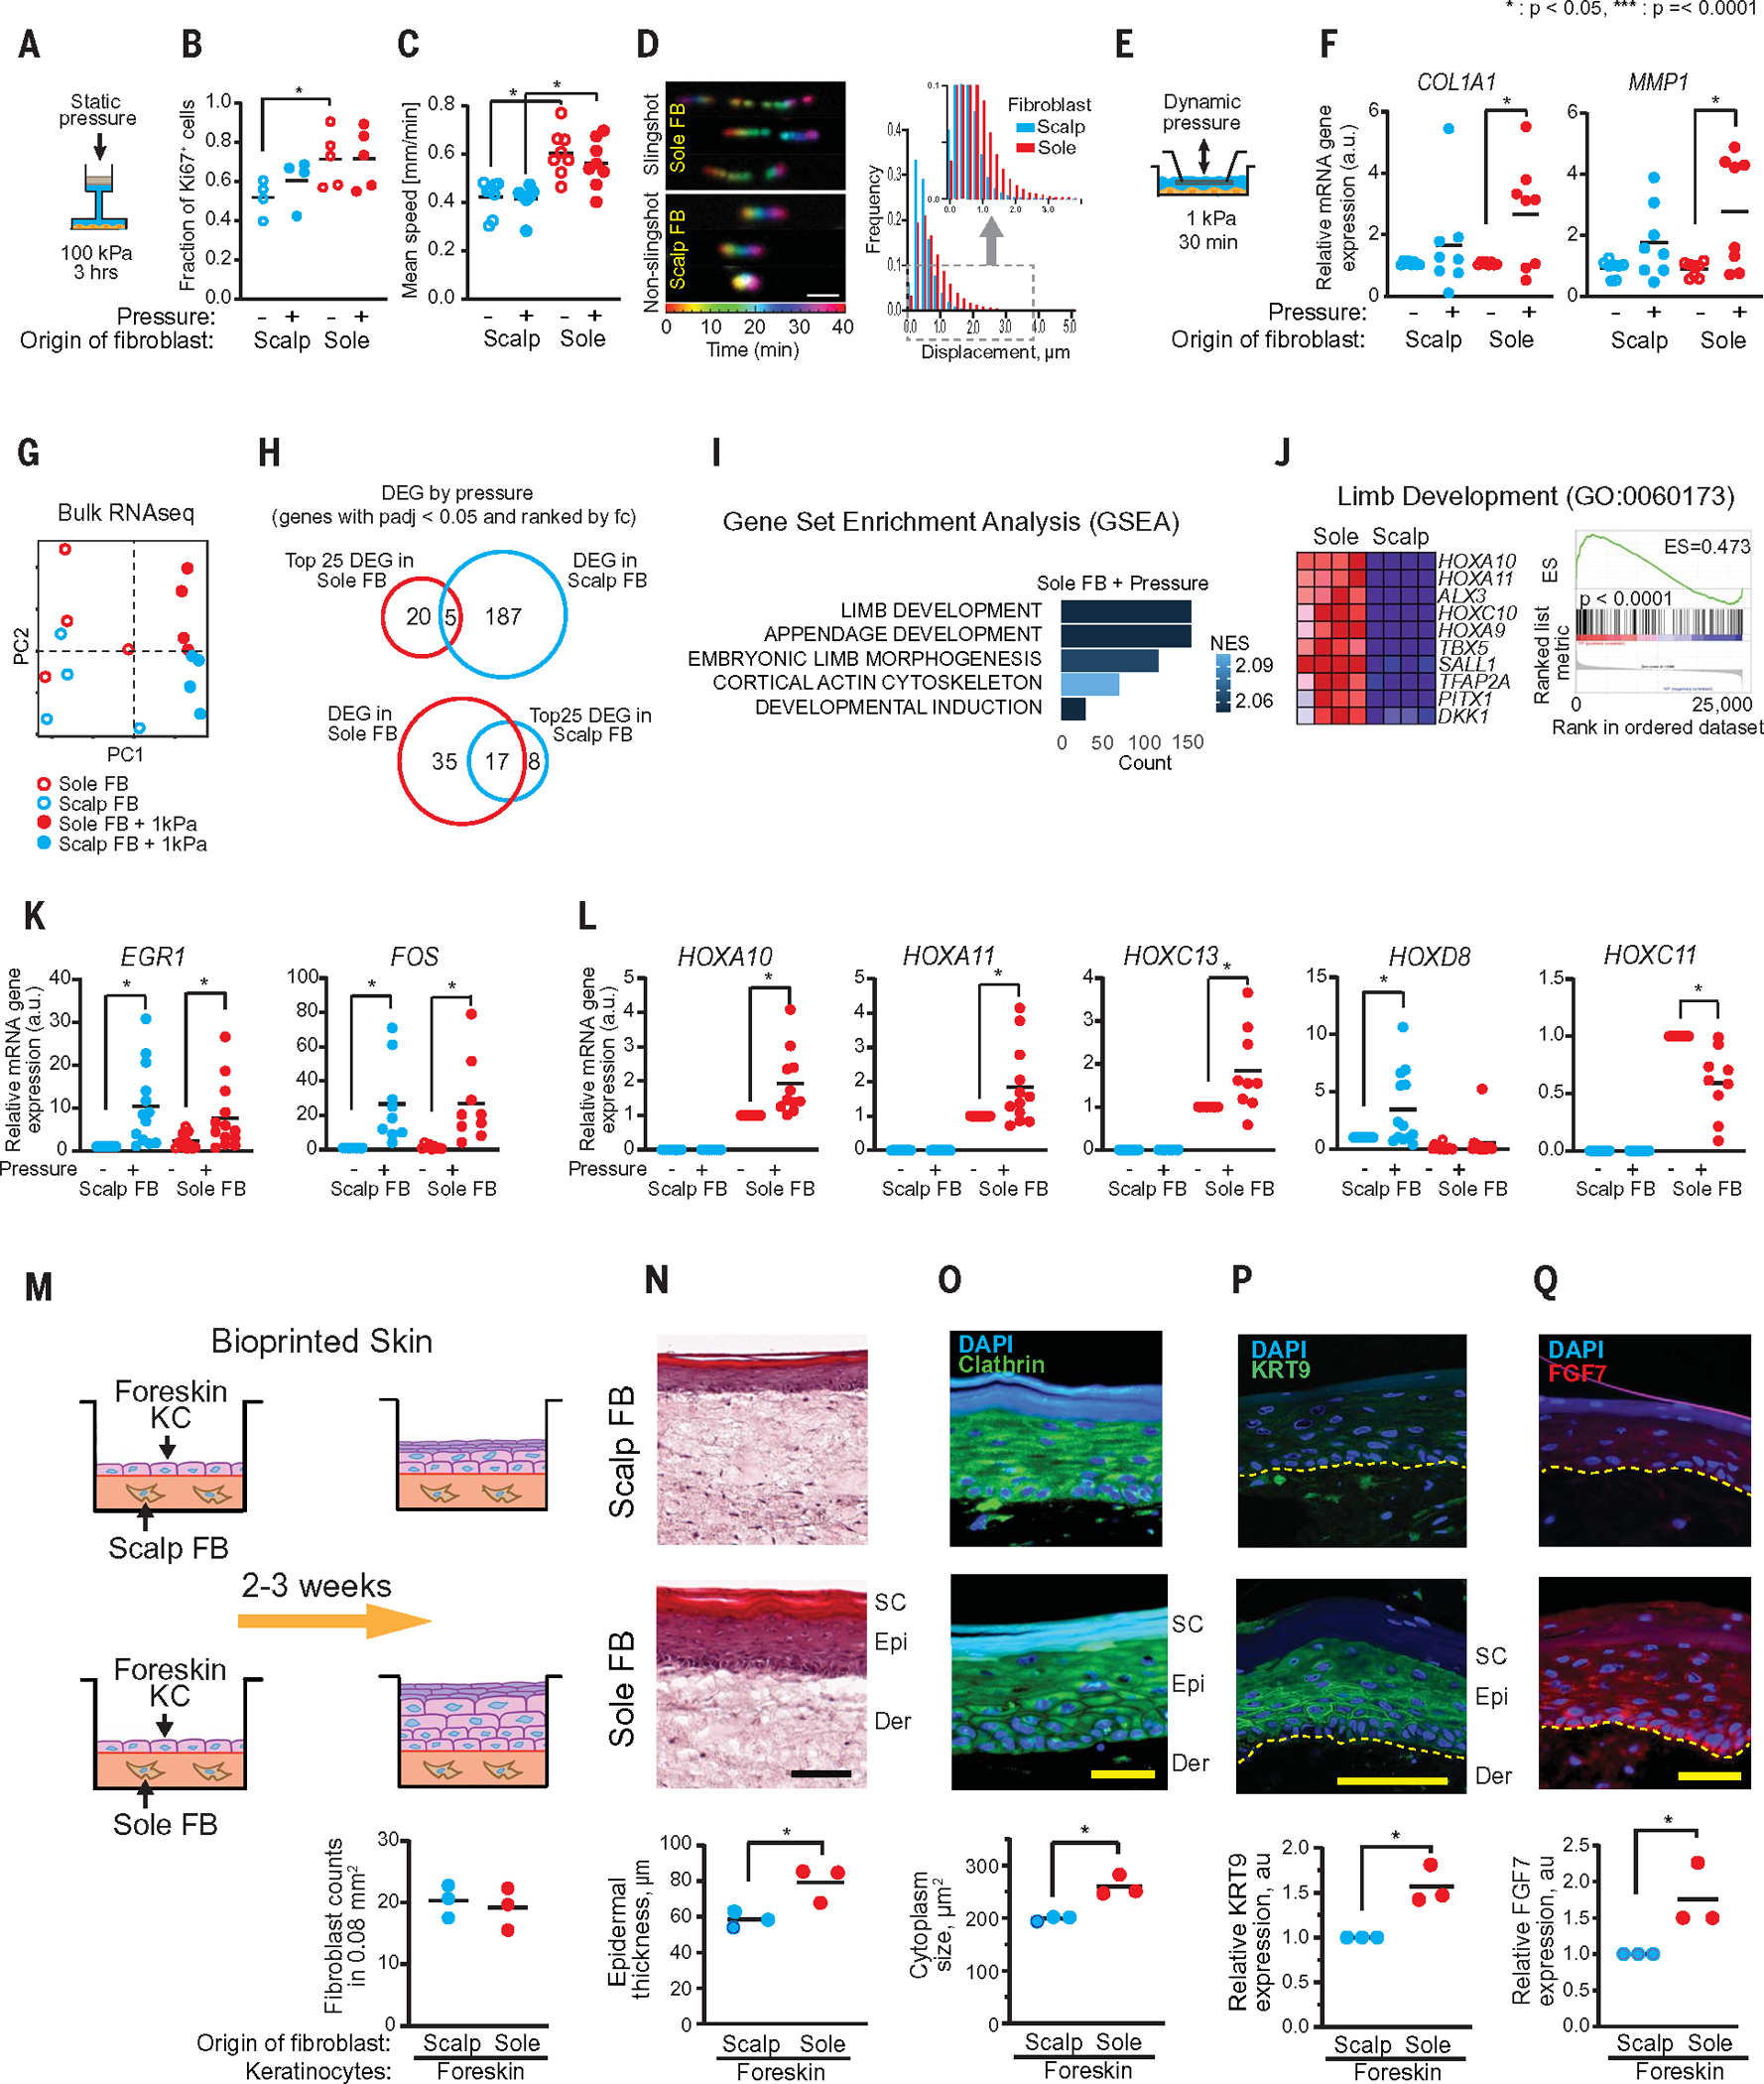
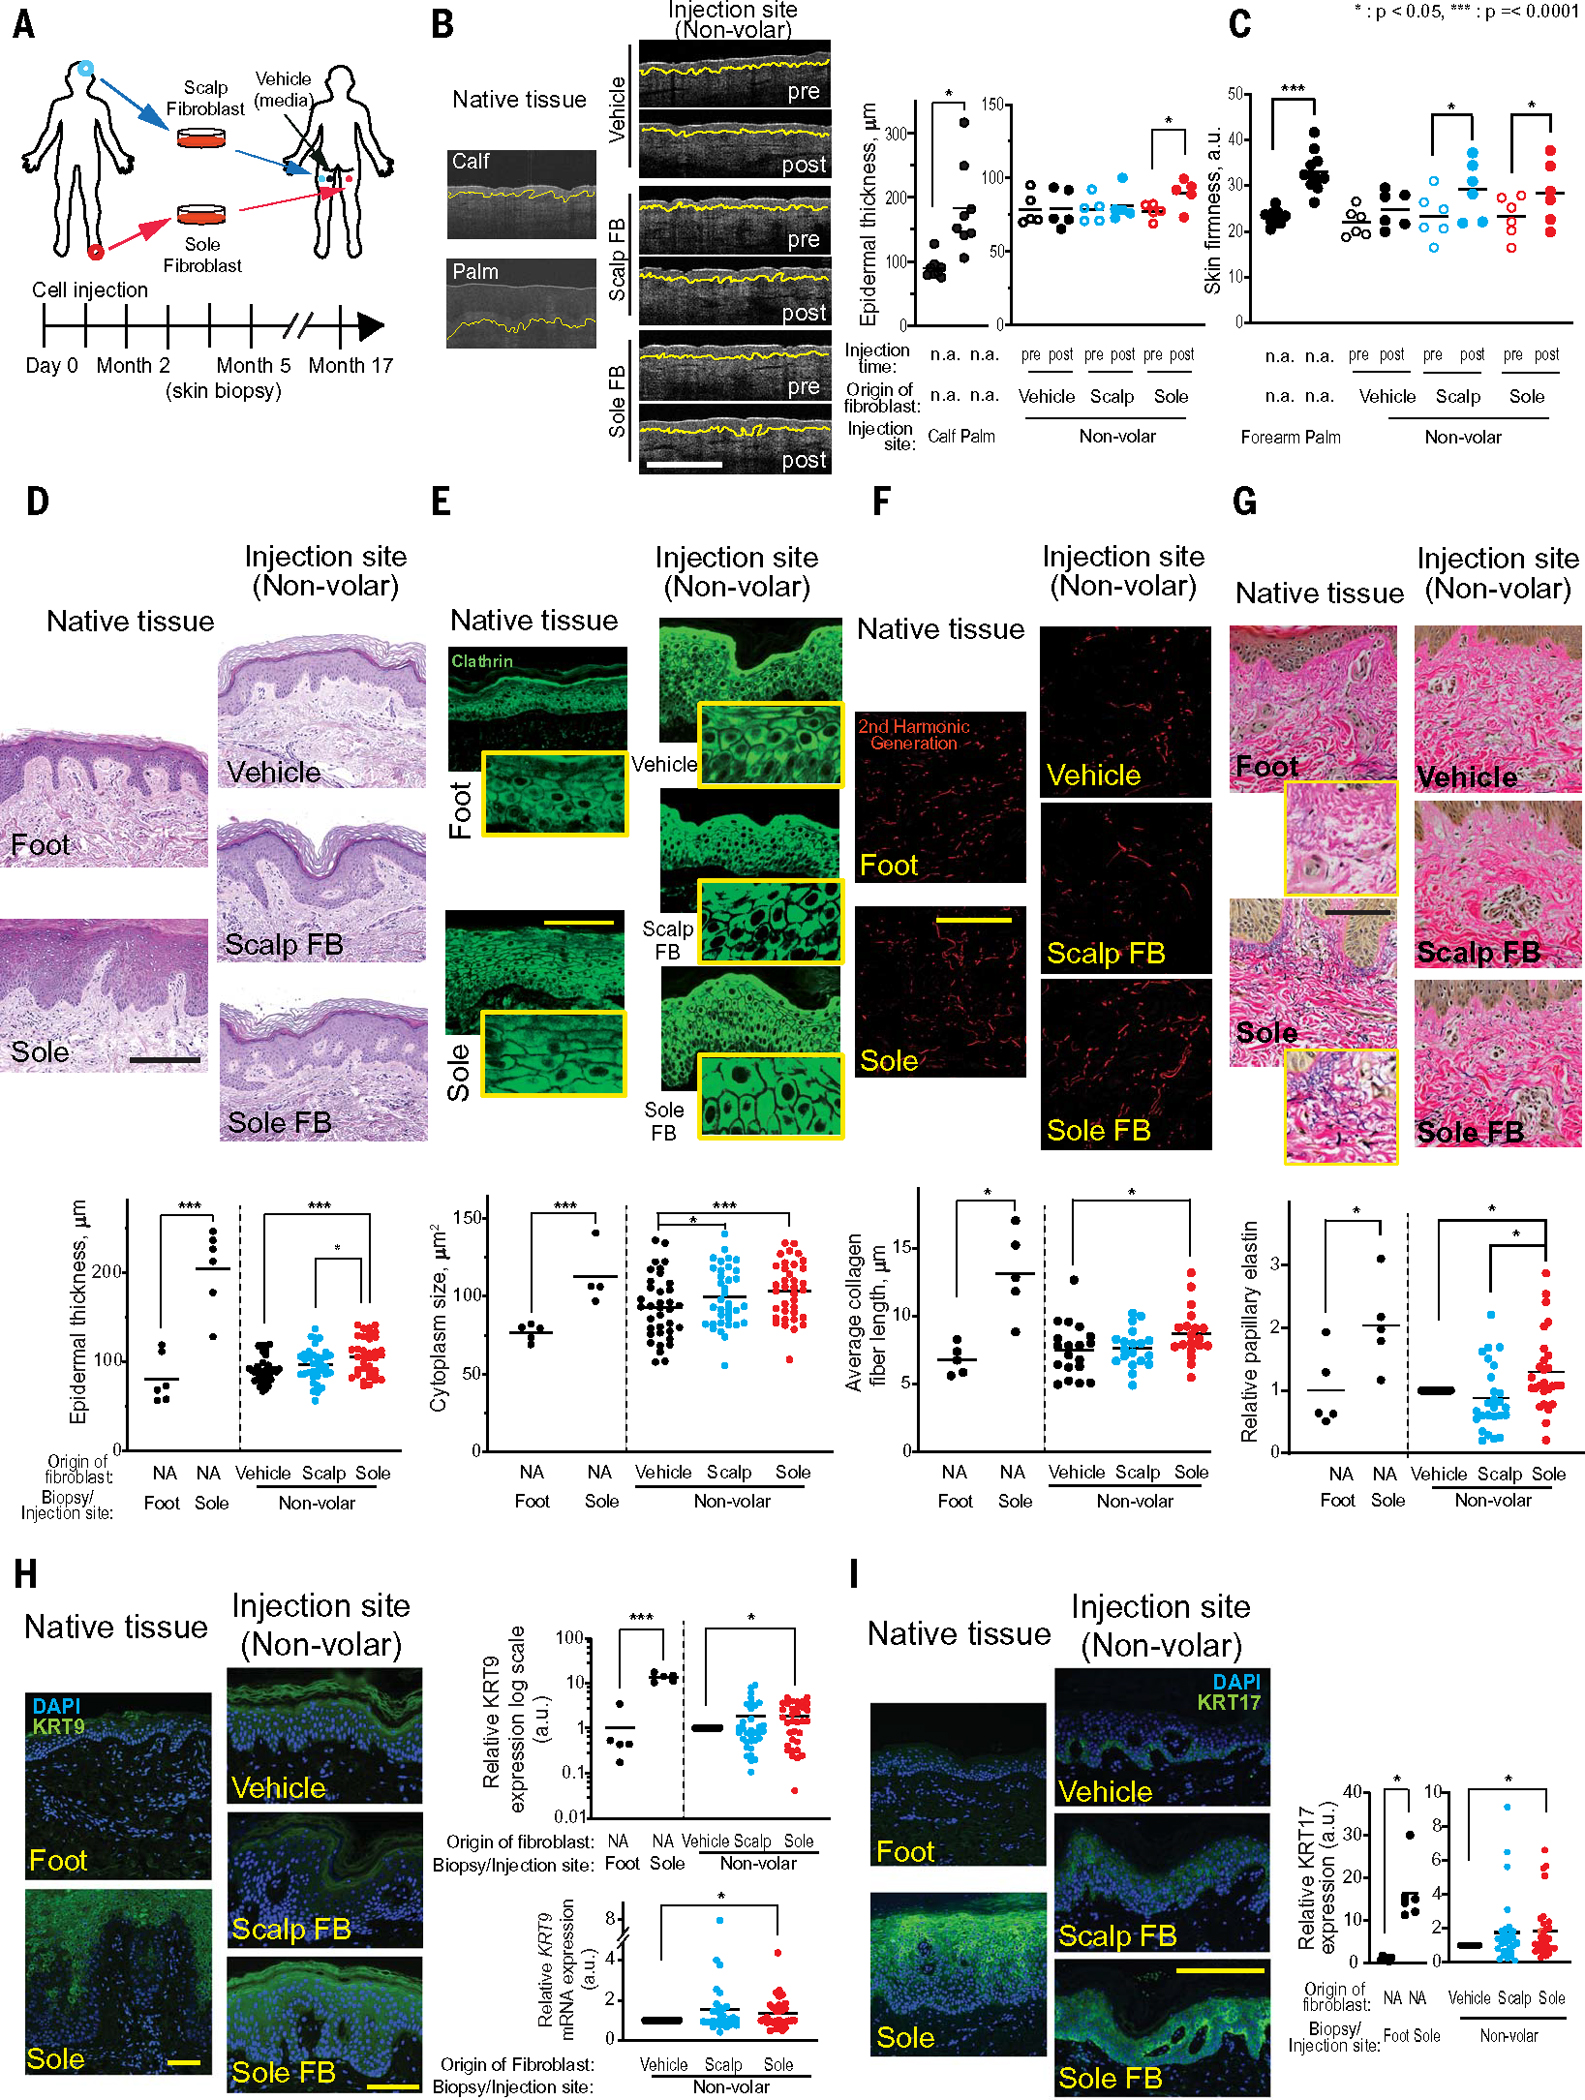
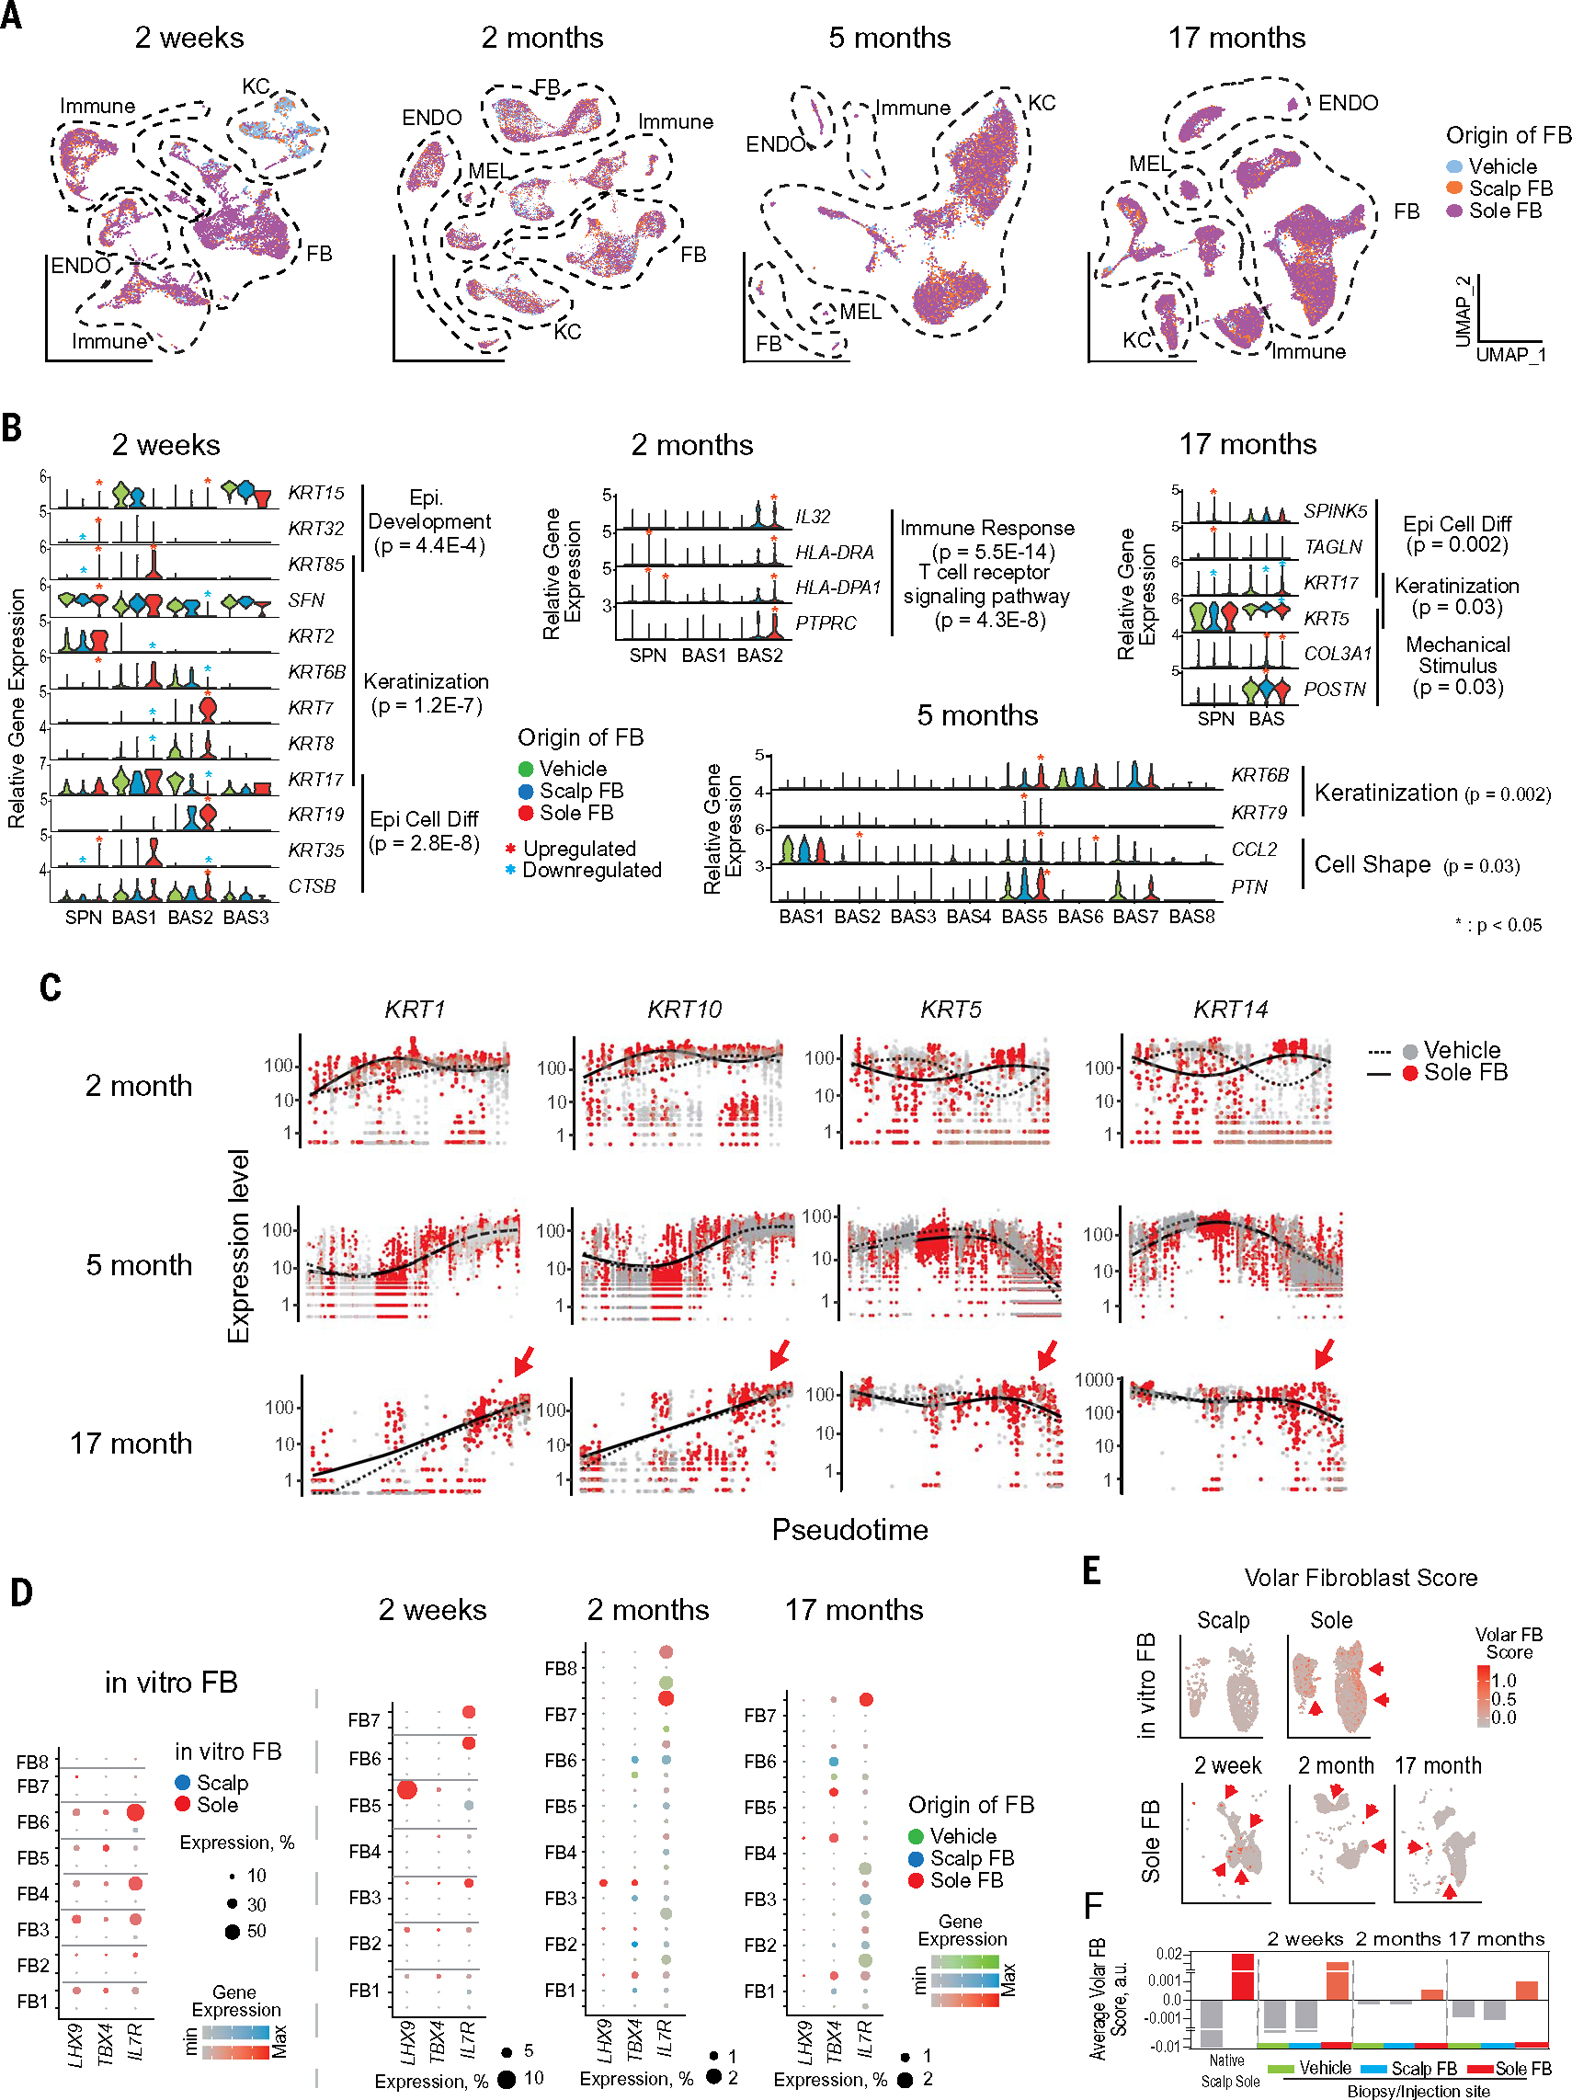
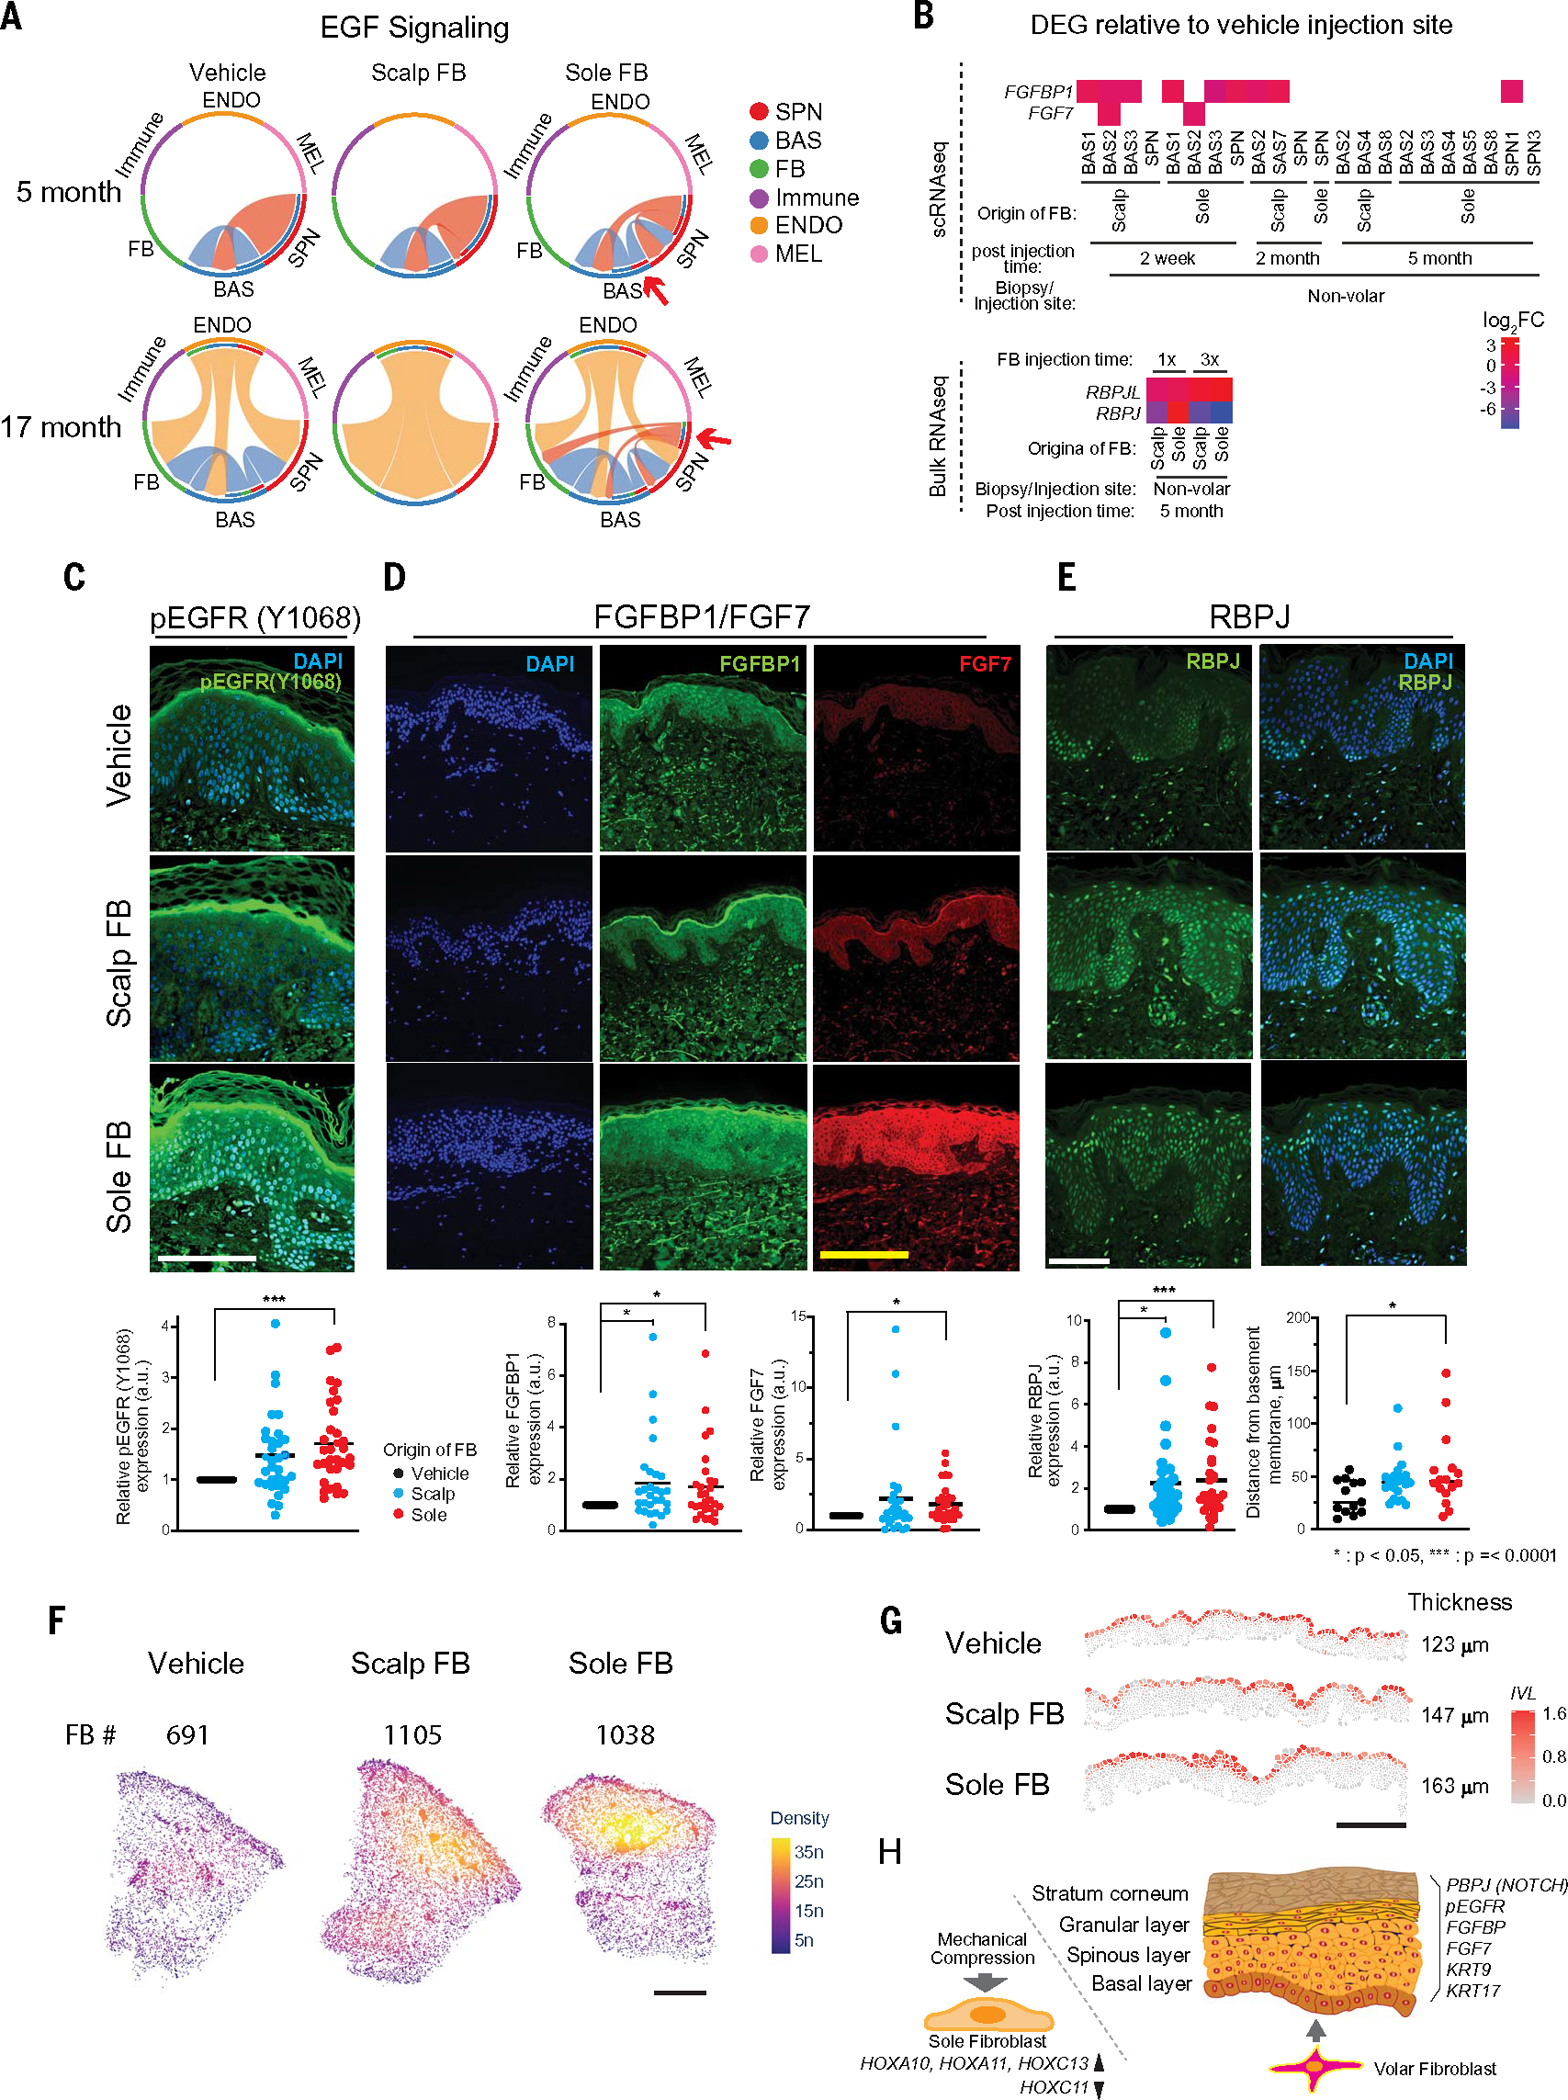
Skin identity is controlled by intrinsic features of the epidermis and dermis and their interactions. Modifying skin identity has clinical potential, such as the conversion of residual limb and stump (nonvolar) skin of amputees to pressure-responsive palmoplantar (volar) skin to enhance prosthesis use and minimize skin breakdown. Greater keratin 9 (KRT9) expression, higher epidermal thickness, keratinocyte cytoplasmic size, collagen length, and elastin are markers of volar skin and likely contribute to volar skin resiliency. Given fibroblasts' capacity to modify keratinocyte differentiation, we hypothesized that volar fibroblasts influence these features. Bioprinted skin constructs confirmed the capacity of volar fibroblasts to induce volar keratinocyte features. A clinical trial of healthy volunteers demonstrated that injecting volar fibroblasts into nonvolar skin increased volar features that lasted up to 5 months, highlighting a potential cellular therapy.


Conflict of interest statement

Competing interests: L.A.G. has received grant support paid to his institution, Johns Hopkins University, from Sun Pharma Advanced Research Company (SPARC). This grant is to investigate intellectual property of which Johns Hopkins University is the owner and of which L.A.G. is one of several inventors and for which he is under a licensing agreement with SPARC, and which has resulted in royalty payments to inventors. This grant and royalty payments are not related to the research presented in this manuscript.

Figures

Fig. 1.
Fig. 1.. Volar fibroblasts showed distinct responses to pressure and induced volar features in 3D-printed skin tissue constructs.
(A) Schematic diagram illustrates an in vitro static continuous pressurizing system that applied 100 kPa of hydraulic pressure to cultured fibroblasts for 3 hours. (B) Proliferation and cell count of Ki67-stained fibroblasts were measured with flow cytometry. Sole fibroblasts show significantly (P = 0.02) increased fraction of Ki67+ compared with scalp fibroblasts (n = 4 distinct subjects with 1 repeat in scalp fibroblasts, n = 5 distinct subjects with 1 repeat in sole fibroblasts). Pressurizing scalp or sole fibroblasts does not show significant changes in Ki67+ fraction. (C) Mean migration speed was measured by microscopy and analyzed with ImageJ. Sole fibroblasts showed significantly higher migration speed compared with scalp fibroblasts both without and with pressure (P = 0.005 and P = 0.004, respectively). No significant difference was observed between pressurized and nonpressurized fibroblasts (n = 4 distinct subjects with 1 repeat in scalp fibroblasts, n = 5 distinct subjects with 1 repeat in sole fibroblasts). (D) Representative images of scalp and sole fibroblast migration tracings and histogram. Noncontinuous trace of sole fibroblasts compared with continuous trace of scalp fibroblasts demonstrates characteristic “slingshot” movement of sole fibroblasts. Sole fibroblasts show higher frequencies at longer displacement distances. Histogram represents 664 nonvolar and 385 volar fibroblasts from a single subject (n = 7 distinct subjects). (E) Schematic diagram illustrates an in vitro dynamic oscillatory pressurizing system that applied 1 kPa in 0.025 Hz (20 s on, 20 s off) intervals to cultured sole or scalp fibroblasts for 30 min. (F) Scatter plots of quantitative PCR (qPCR) data indicate COL1A1 and MMP1 mRNA expression in response to dynamic oscillatory pressure. Only sole fibroblasts significantly increased expression of COL1A1 (P = 0.03) and MMP1 (P = 0.01) after pressure (n = 8 distinct subjects with 3 repeats in scalp and sole fibroblasts). (G) PCA plot from bulk RNA-seq data (n = 3 distinct subjects). (H) Overlap of top 25 up-regulated DEG in sole fibroblasts associated with pressure treatment and full DEG in scalp fibroblasts associated with pressure treatment, or vice versa. (I) Selected GO pathways in GSEA of transcripts modified by pressure in sole fibroblasts (full list is in fig. S3B). (J) Top 10 genes associated with the limb development pathway are shown as a heatmap and enrichment plot. (K) Scatter plots of qPCR data illustrate significant increases in mRNA expression of EGR1 (P = 0.0002 in scalp fibroblast, P = 0.05 in sole fibroblast, n = 13 distinct subjects with 3 repeats) and FOS (P = 0.01 in scalp; P = 0.01 in sole fibroblast, n = 9 distinct subjects with 3 repeats) in both scalp and sole fibroblasts in response to pressure. (L) Scatter plots of qPCR data for HOX genes. HOXA10 (P = 0.009, n = 11 distinct subjects with 3 repeats), HOXA11 (P = 0.026, n = 12 distinct subjects with 3 repeats), and HOXC13 (P = 0.02, n = 9 distinct subjects with 3 repeats) are up-regulated only in pressure-treated sole fibroblasts. HOXD8 is up-regulated only in pressure-treated scalp fibroblasts (P = 0.005, n = 12 distinct subjects with 3 repeats). HOXC11 is down-regulated only in pressure-treated sole fibroblasts (P = 0.004, n = 9 distinct subjects with 3 repeats). (M) Schematic presentation of bioprinted skin using foreskin keratinocytes (KCs) and scalp or sole fibroblasts. Numbers of fibroblasts per 0.08 mm2 were counted (n = 3 distinct subjects with 4 repeats). There were no significant differences between scalp and sole fibroblasts in bioprinted skin. (N) Representative image of hematoxylin and eosin (H&E) stain at 20× magnification. Epidermal thickness was significantly higher in bioprinted skin with sole fibroblasts (P = 0.03, n = 3 distinct subjects with 4 repeats). Scale bar, 100 μm. (O) Representative image of clathrin/DAPI immunostain at 40× magnification. Cytoplasm size in keratinocytes was significantly larger in bioprinted skin with sole fibroblasts (p = 0.05, n = 3 distinct subjects with 4 repeats). Scale bar, 50 μm. (P) Representative image of KRT9/DAPI immunostain at 20× magnification. Epidermal KRT9 expression was significantly greater in bioprinted skin with sole fibroblasts (P = 0.04, n = 3 distinct subjects with 4 repeats). Scale bar, 100 μm. (Q) Representative image of FGF7/DAPI (4′,6-diamidino-2-phenylindole) immunostain at 20× magnification. Epidermal FGF7 expression was significantly greater in bioprinted skin with sole fibroblasts (P = 0.04, n = 3 distinct subjects with 4 repeats). Scale bar, 100 μm. SC, stratum corneum; Epi, epidermis; Der, dermis.
Fig. 2.
Fig. 2.. In a human trial, ectopic volar fibroblasts induced histologic changes in nonvolar skin.
(A) Schematic presentation of experimental design for human clinical trial. (B) Representative images from OCT. Yellow line indicates dermal-epidermal junction (DEJ). Pre- and post-fibroblast injection time points showed that native volar (palm) epidermis was significantly thicker than native nonvolar (calf) epidermis (P = 0.002, n = 8 distinct subjects with 4 readings). The epidermis of sole fibroblast–injected sites (Sole FB-post) was significantly thicker compared to preinjection (Sole FB-pre, P = 0.009) or post-vehicle–injected control sites (Vehicle, P = 0.042, n = 5 distinct subjects with 4 readings). Scale bar, 500 μm. (C) Skin firmness measurement by durometer. Native volar (palm) skin was significantly firmer than native nonvolar (forearm) epidermis (P < 0.0001, n = 10 distinct subjects with 4 readings). Skin at scalp fibroblast–injected and sole fibroblast–injected sites was firmer than at preinjection (P = 0.007 and P = 0.015, respectively, n = 6 distinctive subjects with 4 readings). (D) Representative images of H&E stain from native and injection sites. Histological imaging of epidermal thickness in excised native tissue and injected sites. Native volar (sole) epidermis was significantly thicker than nonvolar (foot) epidermis (P < 0.0001, n = 6 distinct subjects with 1 repeat). Epidermal thickness in the Sole FB–injected sites was significantly thicker than that in the Scalp FB–injected sites (P = 0.04) or Vehicle-injected sites (P = 0.0001, n = 32 distinct subjects with 1 repeat). Scale bar, 100 μm. (E) Representative images of clathrin stain. Fluorescent imaging of clathrin protein to determine cytoplasm size in keratinocytes of native tissue and injected sites. Cytoplasm was significantly larger in native volar tissue compared to native nonvolar tissue (P < 0.0001, n = 5 distinct subjects with 1 repeat). Cytoplasm size in Sole FB– or Scalp FB–injected sites was larger compared to Vehicle-injected sites (P = 0.0001 and 0.006, respectively, n = 32 distinct subjects with 1 repeat). Scale bar, 100 μm. (F) Representative images of collagen fibers by second harmonic generation (SHG). Collagen fibers in dermis of native tissue and injected sites were detected by SHG. Collagen fiber lengths were measured according to collagen fibril detection. Fibers were significantly longer in native volar tissue compared to native nonvolar tissue (P = 0.01, n = 5 distinct subjects with 1 repeat). Fibers in the Sole FB–injected sites were significantly larger compared with Vehicle-injected sites (P = 0.04, n = 18 distinct subjects with 1 repeat). Scale bar, 100 μm. (G) Representative images of elastin stain. Native volar region (sole) had more elastin than native nonvolar regions (foot) (P = 0.04, n = 5 distinct subjects with 1 repeat). Injection of volar fibroblast in a nonvolar site led to increased elastin compared with similar sites’ vehicular injections (P = 0.05) and nonvolar injections (P = 0.002, n = 27 distinct subjects with 1 repeat). Scale bar, 100 μm. (H) Protein and mRNA expression of epidermal KRT9. Representative images are protein KRT9 stain. Scale bar, 100 μm. Epidermal KRT9 expression in native volar tissue was higher compared with native non-volar tissue (P < 0.0001, n = 5 distinct subjects with 1 repeat). Epidermal protein and mRNA KRT9 expression in the Sole FB–injected sites (n = 31 distinct subjects with 2 repeats) was significantly higher than in Vehicle-injected sites (P = 0.004 and 0.04, respectively). (I) KRT17 in native tissue and injected sites. KRT17 expression in native volar tissue was significantly higher than that in nonvolar tissue (P = 0.0003, n = 5 distinct subjects with 1 repeat). KRT17 expression in the Sole FB–injected sites was significantly higher compared with Vehicle-injected sites (P = 0.02, n = 31 distinct subjects with 1 repeat). Scale bar, 100 μm.
Fig. 3.
Fig. 3.. scRNAseq of human skin after ectopic-cell injection demonstrates dynamic tissue changes.
(A) Scatter plots show UMAP cell clusters at 2-week, 2-month, 5-month, and 17-month postinjection time points. (B) Violin plots of relative gene expression from differentially expressed genes (DEG) in spinous (SPN) and basal (BAS) keratinocyte clusters from injected sites. Each violin plot represents DEG from 2-week, 2-month, 5-month, and 17-month time points. DEG with Padj < 0.05 were further analyzed by DAVID analysis and selected for presentation. (C) Keratinocyte pseudotime single-cell trajectories based on KRT1, 10, 5, and 14 gene expressions from Sole FB–injected sites (red; solid line) and Vehicle injected sites (gray; dotted line). KRT1/10 are expressed higher in the earlier pseudotimes, whereas KRT5/14 are expressed higher in later pseudotimes after sole fibroblast injection. (D) Dot plot of volar genes LHX9/TBX4/IL7R expressed in cultured native preinjection fibroblasts (left) versus fibroblast clusters from injected sites (right). LHX9/TBX4/IL7R are expressed in preinjection native sole fibroblasts but not scalp fibroblasts. These genes were also detected in the skin sites with volar fibroblast injection but decreased in abundance with time. (E) UMAP plots of volar fibroblast–specific gene expression score (LHX9/TBX4/IL7R) in native scalp and sole fibroblasts (top) and Sole FB–injected sites with various time points (bottom). Volar fibroblast scores were calculated using volar-specific genes in Fig. 3D. (F) Average volar fibroblast scores in fibroblast clusters from vehicle, Scalp FB, and Sole FB injection sites at different postinjection time points were calculated.
Fig. 4.
Fig. 4.. Cell-to-cell signaling through EGF, FGF, and NOTCH pathways was modified by ectopic fibroblasts.
(A) Circle plots by CellChat show sender-receptor relationships in EGF signaling pathways at 5-month and 17-month postinjection time points. The signal sender is located on the outer circle, and the recipient is located on the inner circle. Shading visualizes the pathway connections. SPN, spinous; BAS, basal; ENDO, endothelial; MEL, melanocyte. (B) FGF pathway (top, FGF7/FGFBP1) and NOTCH pathway (bottom, RBPJL/RBPJ) expression in scRNA-seq analysis (top) and bulk RNA-seq analysis (bottom). DEG with P < 0.05 were selected for presentation. (C) Representative images of pEGFR-Y1068 stain, showing pEGFR-Y1068 protein expression in injected sites. Expression was significantly higher in Sole FB–injected sites compared with Vehicle-injected sites (P = 0.0001, n = 32 distinct subjects with 1 repeat). Scale bar, 100 μm. (D) Representative images of FGFBP1 and FGF7 stains. FGFBP1 and FGF7 protein expression in injected sites. Sole FB–injected sites exhibited greater expression of FGFBP1 (P = 0.04) and FGF7 (P = 0 0.007) compared with Vehicle-injected sites. The Scalp FB–injected sites also exhibited greater FGFBP1 expression compared with Vehicle-injected sites (P = 0.024, n = 28 distinct subjects with 1 repeat). Scale bar, 100 μm. (E) Representative images of RBPJ stain. RBPJ (RBPSUH) protein expression in injected sites. RBPJ was expressed at significantly higher levels in the Sole FB– or Scalp FB–injected sites as compared with Vehicle-injected sites (P = 0.001 and 0.007, respectively, n = 29 distinct subjects with 1 repeat). Scale bar, 100 μm. Distance of RBPJ (RBPSUH)–positive keratinocytes from the basement membrane was measured. RBPJ-positive keratinocytes in Sole FB–injected sites were located significantly farther from the basement membrane compared with the keratinocytes in the Vehicle-injected sites (P = 0.03, n = 20 distinct subjects with 1 repeat). (F) Fibroblast density by Xenium in situ spatial transcriptomics at the 2-month postinjection time point. Increased fibroblast densities in the papillary dermis were detected at Scalp and Sole FB injection sites. Fibroblast cell numbers are indicated above the Xenium spatial plot. Scale bar, 1 mm. (G) Epidermal IVL expression at the 2-month postinjection time point as shown in (F). Higher levels of IVL expression across multiple keratinocyte layers were detected at the Sole FB sites. The IVL expressions in the entire epidermis are depicted in fig. S26F. Scale bar, 250 μm. (H) Schematic presentation of volar fibroblast response to pressure and modification of epidermal differentiation.

Comment in

References

    1. Driskell RR et al., Distinct fibroblast lineages determine dermal architecture in skin development and repair. Nature 504, 277–281 (2013). doi: 10.1038/nature12783 - DOI - PMC - PubMed
    1. Xu Z et al., Anatomically distinct fibroblast subsets determine skin autoimmune patterns. Nature 601, 118–124 (2022). doi: 10.1038/s41586-021-04221-8 - DOI - PubMed
    1. Chang HY et al., Diversity, topographic differentiation, and positional memory in human fibroblasts. Proc. Natl. Acad. Sci. U.S.A. 99, 12877–12882 (2002). doi: 10.1073/pnas.162488599 - DOI - PMC - PubMed
    1. Rinn JL, Bondre C, Gladstone HB, Brown PO, Chang HY, Anatomic demarcation by positional variation in fibroblast gene expression programs. PLOS Genet. 2, e119 (2006). doi: 10.1371/journal.pgen.0020119 - DOI - PMC - PubMed
    1. Rinn JL et al., A systems biology approach to anatomic diversity of skin. J. Invest. Dermatol. 128, 776–782 (2008). doi: 10.1038/sj.jid.5700986 - DOI - PubMed

Publication types