. 2024 Sep 6;385(6713):eadm6869.
doi: 10.1126/science.adm6869. Epub 2024 Sep 6.

Achieving optical transparency in live animals with absorbing molecules

Affiliations

Achieving optical transparency in live animals with absorbing molecules

Zihao Ou et al. Science. .

Abstract

Optical imaging plays a central role in biology and medicine but is hindered by light scattering in live tissue. We report the counterintuitive observation that strongly absorbing molecules can achieve optical transparency in live animals. We explored the physics behind this observation and found that when strongly absorbing molecules dissolve in water, they can modify the refractive index of the aqueous medium through the Kramers-Kronig relations to match that of high-index tissue components such as lipids. We have demonstrated that our straightforward approach can reversibly render a live mouse body transparent to allow visualization of a wide range of deep-seated structures and activities. This work suggests that the search for high-performance optical clearing agents should focus on strongly absorbing molecules.


Conflict of interest statement

Competing interests: G.H., Z.O., N.J.R., S.J., M.L.B., Y.-S.D., K.B., and S.Z. are inventors on patent application (WO2023122534A1) submitted by Stanford University that covers the principles of achieving optical transparency by applying the Kramers-Kronig relations.

Figures

Fig. 1.
Fig. 1.
Absorbing molecules make live mice optically transparent. (A) Photograph showing increased optical transparency of a scattering medium after introducing absorbing molecules into it. From left to right, the first three 1-cm cuvettes include pure water, a 0.6 M glycerol solution, and a 0.6 M tartrazine solution, respectively. The other three cuvettes contain colloidal silica particles, which serve as scatterers, dispersed in hydrogels prepared with the three previously mentioned solutions. (B) Transmission spectra of samples shown in (A). (C) Schematic illustrating the process of making the scalp transparent. (D) Photograph of the depilated mouse scalp before topical application. (E and F) Laser speckle contrast images of the mouse head (E) before and (F) after topical application. (Inset) The laser speckle contrast image of the same mouse head after the scalp is removed. Scale bars (D) to (F), 5 mm. (G) Schematic illustrating the process of making the abdominal wall transparent. (H to J) White-light photographs of the mouse abdomen (H) before and (I) after topical application, with (J) major abdominal organs identified. Scale bars (H) and (I), 5 mm. (K) Schematic illustrating the process of making the hindlimb transparent. (L to N) SHG images of the mouse tibialis anterior muscle (L) before and [(M) and (N)] after topical application. (N) A digital zoom of the red dashed box in (M). (Insets) The fast Fourier transform of each image. Scale bars (L) to (N), 50 μm. [Schematics were created with BioRender.com].
Fig. 2.
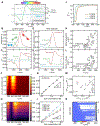
Fig. 2.. Physical mechanism for achieving optical transparency with absorbing molecules.
(A) Numerical simulation showing the modulation of the real index of an aqueous solution (n′; green solid line) by introducing an absorbing molecule with a peak in n″ (gray dashed line) centered at 428 nm. The n′ of water (blue solid line) and high-RI cellular components (such as lipids and collagen fibers) are also shown. (B) Imaginary part n″ and (C) change in the real part Δn′ of the RI calculated from a Lorentz oscillator model with resonance frequency ω0 at 100 nm (blue), 250 nm (green), and 400 nm (red), respectively. (D) Molar absorption α and (E) molar n′ change β of glycerol (blue), antipyrine (green), and tartrazine (red) dissolved in water, respectively. The data for glycerol below 250 nm were obtained from (51); the full range ellipsometry data for tartrazine is shown in fig. S14. (F) Imaginary part of RI, n′′, of tartrazine solutions at different concentrations measured with ellipsometry. (G) Dependence of n′′ on molar concentrations at 430 nm. Dashed lines indicate linear fitting of the data, from which molar absorption α is extracted. (H) Real part of RI, n′, of tartrazine solutions at different concentrations measured with ellipsometry. (I) Dependence of n′ on molar concentrations at 500, 600, 700, and 800 nm. Dashed lines indicate linear fitting of each curve, from which the slopes are extracted to represent the molar n′ change, β, at each wavelength. (J) Transmittance T of tartrazine solutions with an optical path length of 1 mm measured at different concentrations, showing the transmission window beyond 600 nm despite strong absorption below 500 nm. (K and L) Wavelength dependence of (K) maximum molar absorption α and (L) maximum molar n′ change β for glycerol, antipyrine, and 21 absorbing molecules listed in Table 2. (M) The relation between average molar absorption α and average molar n′ change β in the visible spectrum for different dye molecules. Tartrazine is highlighted as Dye-4 in the red dotted circle. Dye-21 is not shown because of the large negative β in the wavelength range of interest. (N) The ratio between the molar n′ change and molar absorption (β/α) for different absorbing molecules. The “white window” indicates a potential transparent spectrum with sufficient Δn′ and minimal absorption.
Fig. 3.
Fig. 3.
Demonstration of optical transparency in scattering phantoms and ex vivo chicken breast tissue. (A) Schematic illustrating the scattering phantom composed of monodispersed silica particles dispersed in water. (B) Numerical simulation showing a plane wave traveling through a matrix comprising scattering particles in an aqueous background with different levels of n′ mismatch indicated above each graph. Scale bars, 2 μm. (C) Photographs of scattering phantoms composed of agarose hydrogels containing increasing concentrations of tartrazine while keeping the concentration of silica particles the same. Scale bars, 5 mm. (D) Normal-incidence light transmittance T spectra of the scattering phantoms containing increasing concentrations of tartrazine. (E) Spectra of the transmission enhancement factor, which is defined as the transmittance ratio between the phantom containing a specific concentration of tartrazine and that containing 0 M tartrazine. (F) The ratio of attenuation coefficient between scattering phantoms containing different concentrations of tartrazine and that containing 0 M tartrazine. Curves in (D) to (F) follow the same color scheme as the concentration labels in (C). (G) Photographs illustrating the difference in the transparency of chicken breast tissue after soaking in tartrazine solutions with an increasing concentration. Scale bars, 1 cm. (H) Transmittance spectra and (I) transmission enhancement factor of the chicken breast tissue after immersion in different concentrations of tartrazine solutions. (J) Ratio of the attenuation coefficient of tissue immersed in tartrazine solutions of different concentrations over that of the original, uncleared tissue. Curves in (H) to (J) follow the same color scheme to indicate the concentration differences.
Fig. 4.
Fig. 4.
Imaging a resolution target through scattering phantoms containing different tartrazine concentrations. (A and B) Schematics showing the clearing effect through modulating the background RI in the scattering phantom through absorbing molecules, thus yielding higher resolution for imaging the USAF resolution target. (C and D) Intensity-normalized (C) low-magnification and (D) high-magnification images of the USAF resolution target through 1-mm scattering phantoms comprising different dye concentrations and imaged at different wavelengths. (E to H) MTF of the imaging system with scattering phantoms at (E) 525 nm, (F) 600 nm, (G) 680 nm, and (H) 785 nm wavelengths. Colors of the solid lines in (E) to (H) follow the same color scheme of the concentration labels shown in (C). (I) Dependence of MTF at a fixed spatial frequency of 101.6 lp mm−1 on the dye concentrations at different wavelengths. (J) Dependence of MTF at a fixed spatial frequency of 101.6 lp mm−1 on the n′ difference between the background and particles in the scattering phantom. Symbols denote different wavelengths used for MTF measurements. (K and L) Simulated electric field E distribution of a 600-nm Gaussian beam launched from the left and propagating for 1 mm in a medium comprising silica scatterers (white dots) in (K) water and (L) an aqueous solution of 0.6 M tartrazine. The divergent beam is refocused by an imaginary lens placed 100 μm after light exits the scattering medium. The white dashed line indicates the plane where the propagating wave is refocused. Scale bars, 200 μm. (M) Electric field strength at the focal plane of light [along white dashed lines in (K) and (L)]. Blue, water; orange, 0.6 M tartrazine.
Fig. 5.
Fig. 5.
High-resolution dynamic imaging of the mouse ENS through a transparent abdomen. (A) Schematics showing microscopic imaging through the transparent abdomen of mice. (B and C) Fluorescence images of the mouse myenteric plexus (B) before and (C) after optical transparency is achieved. (D) Widefield fluorescence image series of the mouse myenteric plexus, overlaid with the illustration of local displacement mapping. The direction and magnitude of movement are indicated with corresponding colors and arrows. (E) Temporal evolution of the average moving direction and displacement magnitude over intervals of 0.36 s in a 220- by 220-μm region. (F) Spatial-temporal evolution of plexus displacement between consecutive frames (with an interval of 0.03 s), with direction encoded in the background color and magnitude in vector lengths. (G) A snapshot highlighting the diverse patterns of local plexus movements in a representative frame. Dashed boxes highlight contraction (blue), expansion (red), and rotation (orange), respectively. (H to J) Three representative local movement patterns observed: (H) contraction, (I) expansion, and (J) rotation. The colormap denotes divergence in (H) and (I) and curl in (J), calculated from the displacement field, respectively. Scale bars, 50 μm. [Schematics were created with BioRender.com].

Comment in

References

    1. Yun SH, Kwok SJJ, Light in diagnosis, therapy and surgery. Nat. Biomed. Eng 1, 0008 (2017). - PMC - PubMed
    1. Tuchin VV, Optical Clearing of Tissues and Blood (SPIE Publications, 2005).
    1. Horstmeyer R, Ruan H, Yang C, Guidestar-assisted wavefront-shaping methods for focusing light into biological tissue. Nat. Photonics 9, 563–571 (2015). - PMC - PubMed
    1. Ntziachristos V, Going deeper than microscopy: The optical imaging frontier in biology. Nat. Methods 7, 603–614 (2010). - PubMed
    1. Ueda HR, Ertürk A, Chung K, Gradinaru V, Chédotal A, Tomancak P, Keller PJ, Tissue clearing and its applications in neuroscience. Nat. Rev. Neurosci 21, 61–79 (2020). - PMC - PubMed

Publication types

LinkOut - more resources