. 2024 Sep 6;385(6713):1120-1127.
doi: 10.1126/science.adk9611. Epub 2024 Sep 5.

Organizing the coactivity structure of the hippocampus from robust to flexible memory

Affiliations

Organizing the coactivity structure of the hippocampus from robust to flexible memory

Giuseppe P Gava et al. Science. .

Abstract

New memories are integrated into prior knowledge of the world. But what if consecutive memories exert opposing demands on the host brain network? We report that acquiring a robust (food-context) memory constrains the mouse hippocampus within a population activity space of highly correlated spike trains that prevents subsequent computation of a flexible (object-location) memory. This densely correlated firing structure developed over repeated mnemonic experience, gradually coupling neurons in the superficial sublayer of the CA1 stratum pyramidale to whole-population activity. Applying hippocampal theta-driven closed-loop optogenetic suppression to mitigate this neuronal recruitment during (food-context) memory formation relaxed the topological constraint on hippocampal coactivity and restored subsequent flexible (object-location) memory. These findings uncover an organizational principle for the peer-to-peer coactivity structure of the hippocampal cell population to meet memory demands.


Conflict of interest statement

Competing interests: A.S. is an inventor on a pending patent application related to the phase-tracking algorithm used in this paper. All other authors declare no competing interests.

Figures

Fig. 1
Fig. 1. Robust contextual (food) memory prevents subsequent flexible (object) memory.
(A, B) Behavioral tasks with open-field contexts (A) and multiday layout (B) for a two-memory paradigm. (C) Animals’ food intake during contextual conditioning (each data point represents one mouse). (D) Estimation plot showing the effect size for the difference in novel food intake between context X and Y after conditioning. (E) Percentage of time exploring novel versus familiar objects during cNOR tests in context X or Y. (F) Schematic of the GLM predicting the identity of each object-location compound from population vectors of theta-nested principal cell spiking. A sample of CA1 ensemble spike data for one object visit (blue trace) is shown. (G) Estimation plot showing the classification accuracy of object-location compound in test n by GLM trained in session n − 1 (each data point represents one object). (H) Example pairs of population decoding vectors containing the neuron-wise GLM coefficients for the familiar versus a novel object at the same location in context X versus Y (each data point represents one neuron). (I, J) Estimation plots showing the cosine similarity between familiar and novel object-location GLM vectors (I) and the change (update) in individual neuron contribution to population object-location decoding (J) across two consecutive cNOR tests in either context. For each estimation plot: Upper (Left for D), raw data (points) with mean±SD (vertical lines); Lower (Right for D), mean difference (black-dot) with 95% CI (black-ticks) and bootstrapped sampling-error distribution (filled-curve) with respect to the (left-most) group-reference (horizontal dashed line; see Methods). ***P<0.001, *P<0.05, two-sided paired permutation test. N = 6 mice, 2506 CA1 principal cells.
Fig. 2
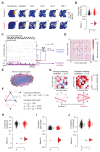
Fig. 2. Robust memory increases neuronal coactivity and population coupling.
(A) Example firing maps across the consecutive cNOR sessions for one mouse day in context X (top) versus context Y (bottom). Each row shows one principal cell (numbers indicate peak rate for each map). (B) Estimation plot showing the place field similarity for the pairs of place maps expressed by individual cells across two contiguous cNOR sessions (e.g., Sampling and Test 1) in context X versus context Y (each data point represents one cell). (C) Schematic of the population-level analyses (see methods). Coactivity between any two (i, j) neurons measured as the β regression weight from the GLM assessing their firing relationship while accounting for network-level modulation using the sum of the remaining cells in the population (to estimate neuron pair (i, j) coactivity beyond the population rate). Population coupling of each cell measured as the Pearson correlation coefficient between its theta-binned spike train and the cumulative activity of the remaining cells. (D-G) Example adjacency matrix of β regression weights (D) and corresponding coactivity graph (E) using the procedure depicted in (C) to access the neuron (i, j) pairwise coactivity structure of the population in each context. Example subset of a coactivity graph (F) with five neurons (nodes) and their pairwise coactivity values (edges with numbers); the clustering coefficient Cijq of neuron i forming one example triad with neurons j and q is calculated along with the geodesic path lengths lij, liq, ljq. Shown in (G) is a subset of adjacency matrices representing contexts X and Y (top), along with their average clustering coefficients and motifs of coactivity (bottom). (H-J) Estimation plots showing that the population coactivity structure is tighter in context Y than X, as reported by the higher clustering coefficient of neuronal graphs containing stronger triads of coactive neurons (H), without a significant change in geodesic path length (I), along with stronger population coupling (J). For each estimation plot: Upper, raw data (points) with mean±SD (vertical lines); Lower, mean difference (black-dot) with 95% CI (black-ticks) and bootstrapped sampling-error distribution (filled-curve) with respect to the (left-most) group-reference (horizontal dashed line; see Methods). ***P<0.001, two-sided paired permutation test. N = 6 mice, 2506 CA1 principal cells.
Fig. 3
Fig. 3. CA1 population coupling requires CA3 during food-context conditioning.
(A, B) Optogenetic targeting of CA3 with either ArchT-GFP (in CA3Grik4::ArchT mice) or GFP-only (in CA3Grik4::GFP mice) combined with theta phase-informed light delivery for closed-loop suppression of CA3 during Hfd-context Y conditioning (A). CA3 principal cells transduced with ArchT-GFP (B, left) and projecting to CA1 (B, right; Stratum oriens, Or.; pyramidale, Pyr.; radiatum, Rad., lucidum, Luc.; cell nuclei stained with DAPI; scale bar, 50 μm). (C-E) Estimation plots showing that in CA3Grik4::ArchT mice, but not in control CA3Grik4::GFP mice, applying this optogenetic intervention throughout the 10-day Hfd conditioning subsequently restored in context Y the behavioral cNOR performance (C) with CA1 population object-location decoding (D) and activity coupling (E) to levels seen in context X. For each estimation plot: Upper, raw data (points) with mean±SD (vertical lines); Lower, mean difference (black-dot) with 95% CI (black-ticks) and bootstrapped sampling-error distribution (filled-curve) with respect to the (left-most) group-reference (horizontal dashed line; see Methods). ***P<0.001, two-sided paired permutation test. N = 1548 CA1 neurons from 4 CA3Grik4::ArchT mice versus 881 CA1 neurons from 2 CA3Grik4::GFP mice.
Fig. 4
Fig. 4. Contextual food memory recruits CA1 superficial pyramidale sublayer cells.
(A, B) cFos–expressing CA1 neurons with Calbindin-1 delineated superficial pyramidale sublayer for three mice after 10-day exposure to either context Y only, homecage with Hfd, or context Y with Hfd (A; stratum oriens, Or.; pyramidale, Pyr.; radiatum, Rad.; cell nuclei stained with DAPI; scale bar, 50 μm; see also fig. S12), and quantification of cFos+ cell density in CA1 pyramidale (B; top; each datum represents one mouse; N = 18 mice, 6 mice per condition) with corresponding proportion of cFos+ Calbindin+ cells in the CA1 superficial pyramidale sublayer (B; bottom). (C, D) Estimation plots showing that CA1 superficial pyramidale sublayer cells have reduced cross-test change (update) in their contribution to object-location decoding (C) and increased population coupling (D) in context Y compared to context X (N = 6 mice, 1871 CA1 superficial cells). ***P<0.001, **P<0.01, *P<0.05, two-sided paired permutation test.
Fig. 5
Fig. 5. Adjusting hippocampal population coactivity restores flexible memory.
(A, B) Intersectional optogenetic strategy (A) for activity-dependent tagging of CA1 Calb1 neurons with either ArchT-EYFP or EYFP-only during Hfd conditioning in context Y, or with ArchT-EYFP during exploration of neutral context W (B; green, ArchT-EYFP; magenta, Calbindin-1; gray, DAPI; see also fig. S17). (C, D) Closed-loop CA1 light delivery controller (C) combined with the optogenetic strategy shown in (A) to suppress superficial pyramidale sublayer cells at their preferred theta phase (fig. S18) during Hfd-context Y conditioning. (D) shows example spiking activity for a deep (top) versus a superficial (bottom) pyramidale sublayer cell with respect to theta phase-driven light delivery. (E-G) Estimation plots. For the context Y-tagged optogenetically adjusted ArchT mice, but not for the context Y-tagged EYFP-only mice nor the context W-tagged ArchT mice, this cell type-selective, network pattern-informed intervention restored cNOR performance (E) along with population object-location decoding (F) and population coupling (G) in context Y. ***P<0.001, *P<0.05, two-sided paired permutation test. N = 1097 CA1 principal cells from 5 ContextY::CA1Calb1-cFos::ArchT mice (Y::ArchT) versus 1007 from 4 ContextY::CA1Calb1-cFos::EYFP mice (Y::EYFP) and 683 from 3 ContextW::CA1Calb1-cFos::ArchT mice (W::ArchT).

References

    1. Schacter DL, Addis DR, Buckner RL. Nat Rev Neurosci. 2007;8:657–661. - PubMed
    1. Brod G, Werkle-Bergner M, Shing YL. Frontiers in Behavioral Neuroscience. 2013;7 - PMC - PubMed
    1. Buzsáki G. Neuron. 2010;68:362–385. - PMC - PubMed
    1. Mau W, Hasselmo ME, Cai DJ. eLife. 2020;9:e63550. - PMC - PubMed
    1. Barnes CA, McNaughton BL, Mizumori SJY, Leonard BW, Lin L-H. Progress in Brain Research. 83:287–300. - PubMed

Publication types