. 2024 Sep 17;121(38):e2407829121.
doi: 10.1073/pnas.2407829121. Epub 2024 Sep 5.

Mechanical confinement prevents ectopic platelet release

Affiliations

Mechanical confinement prevents ectopic platelet release

Ines Guinard et al. Proc Natl Acad Sci U S A. .

Abstract

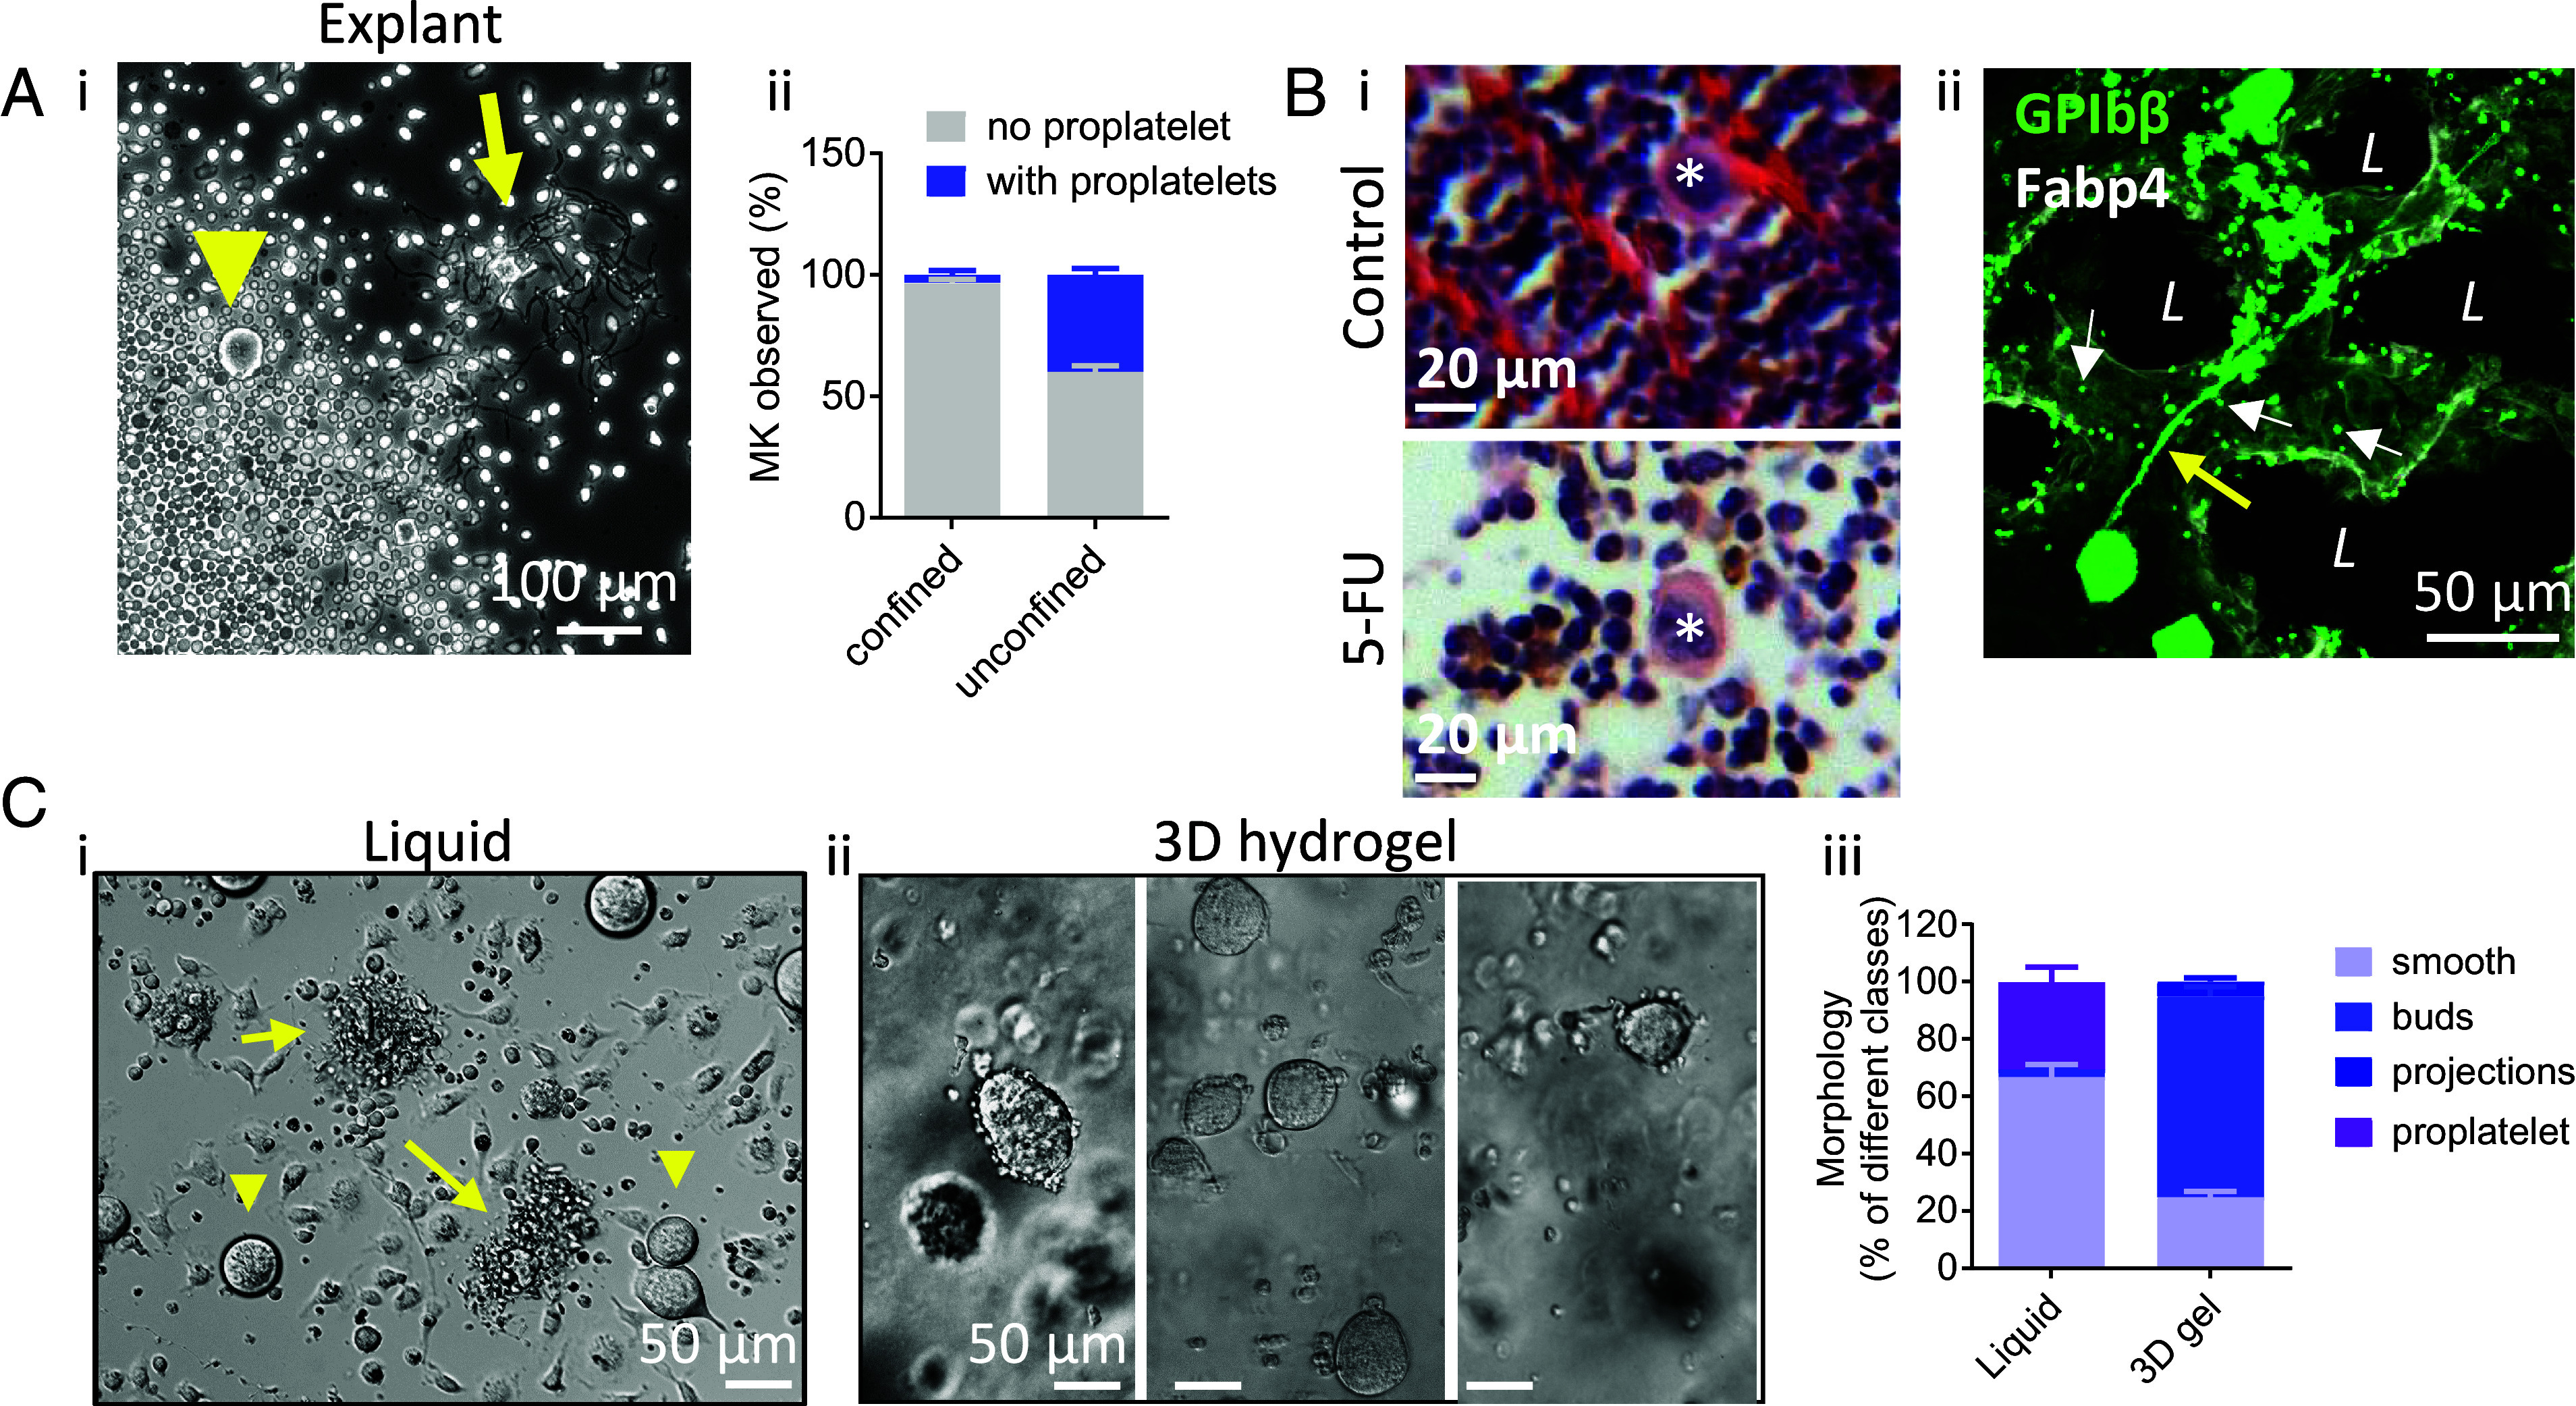
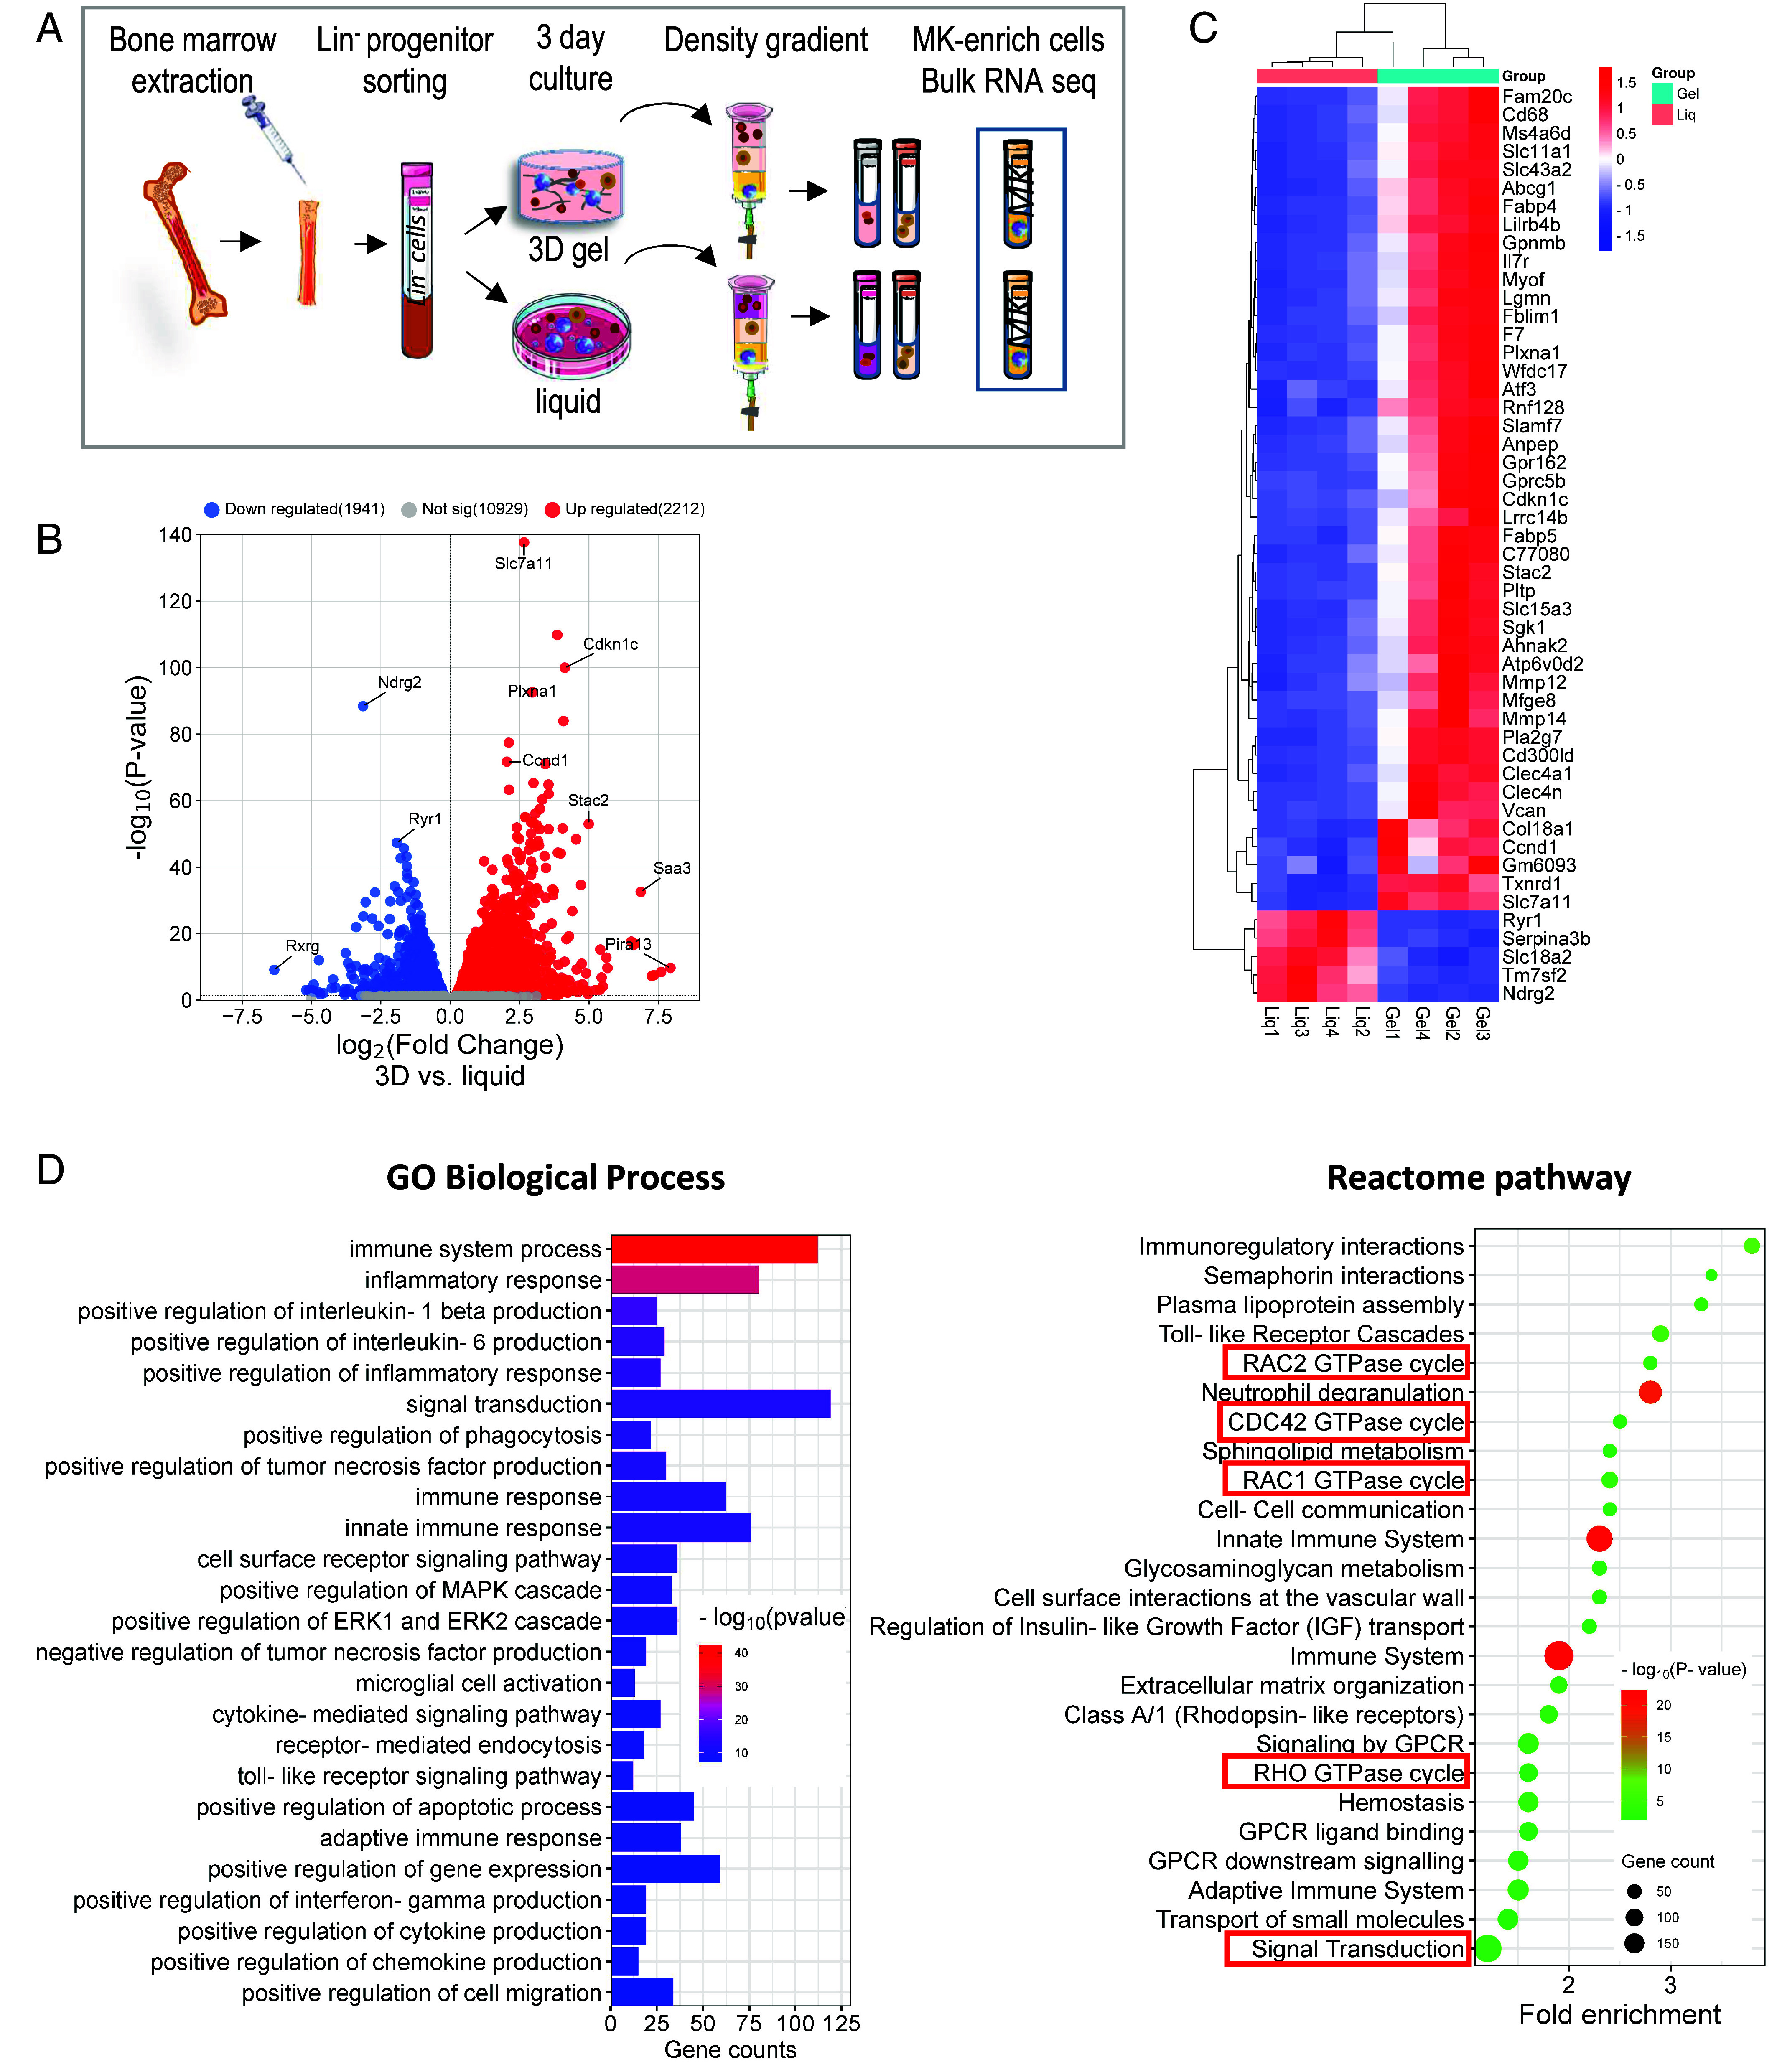
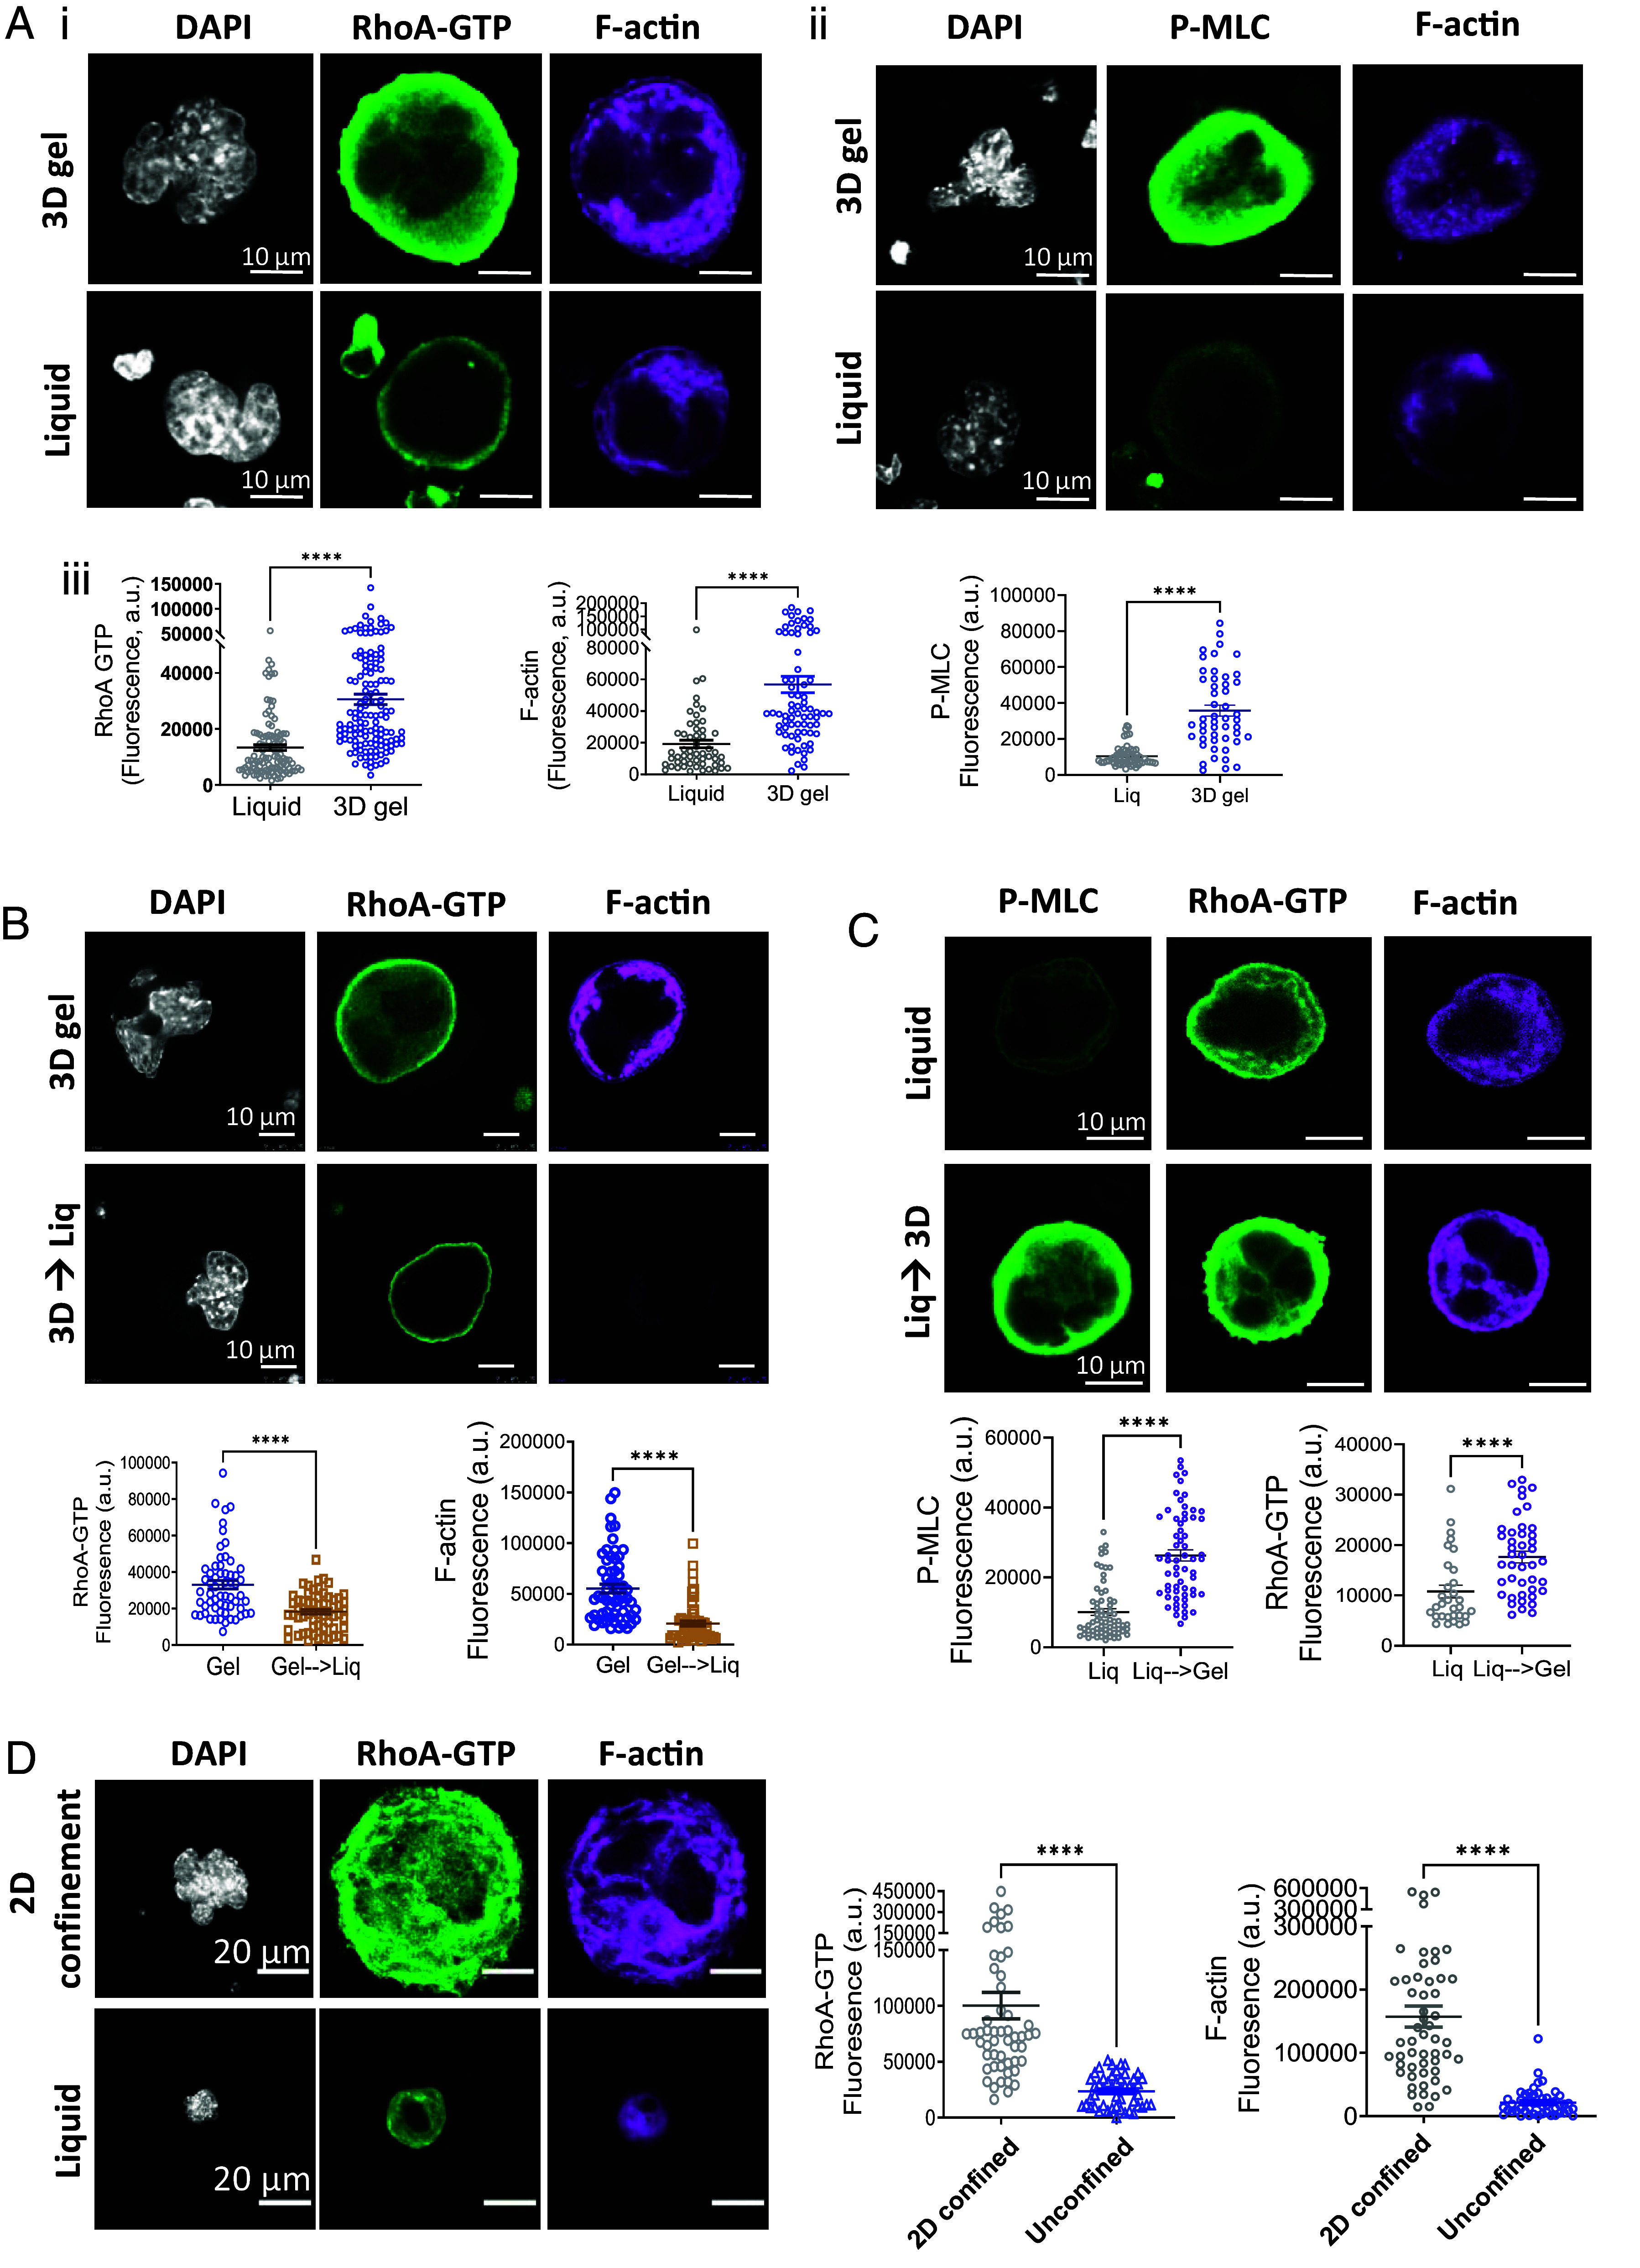
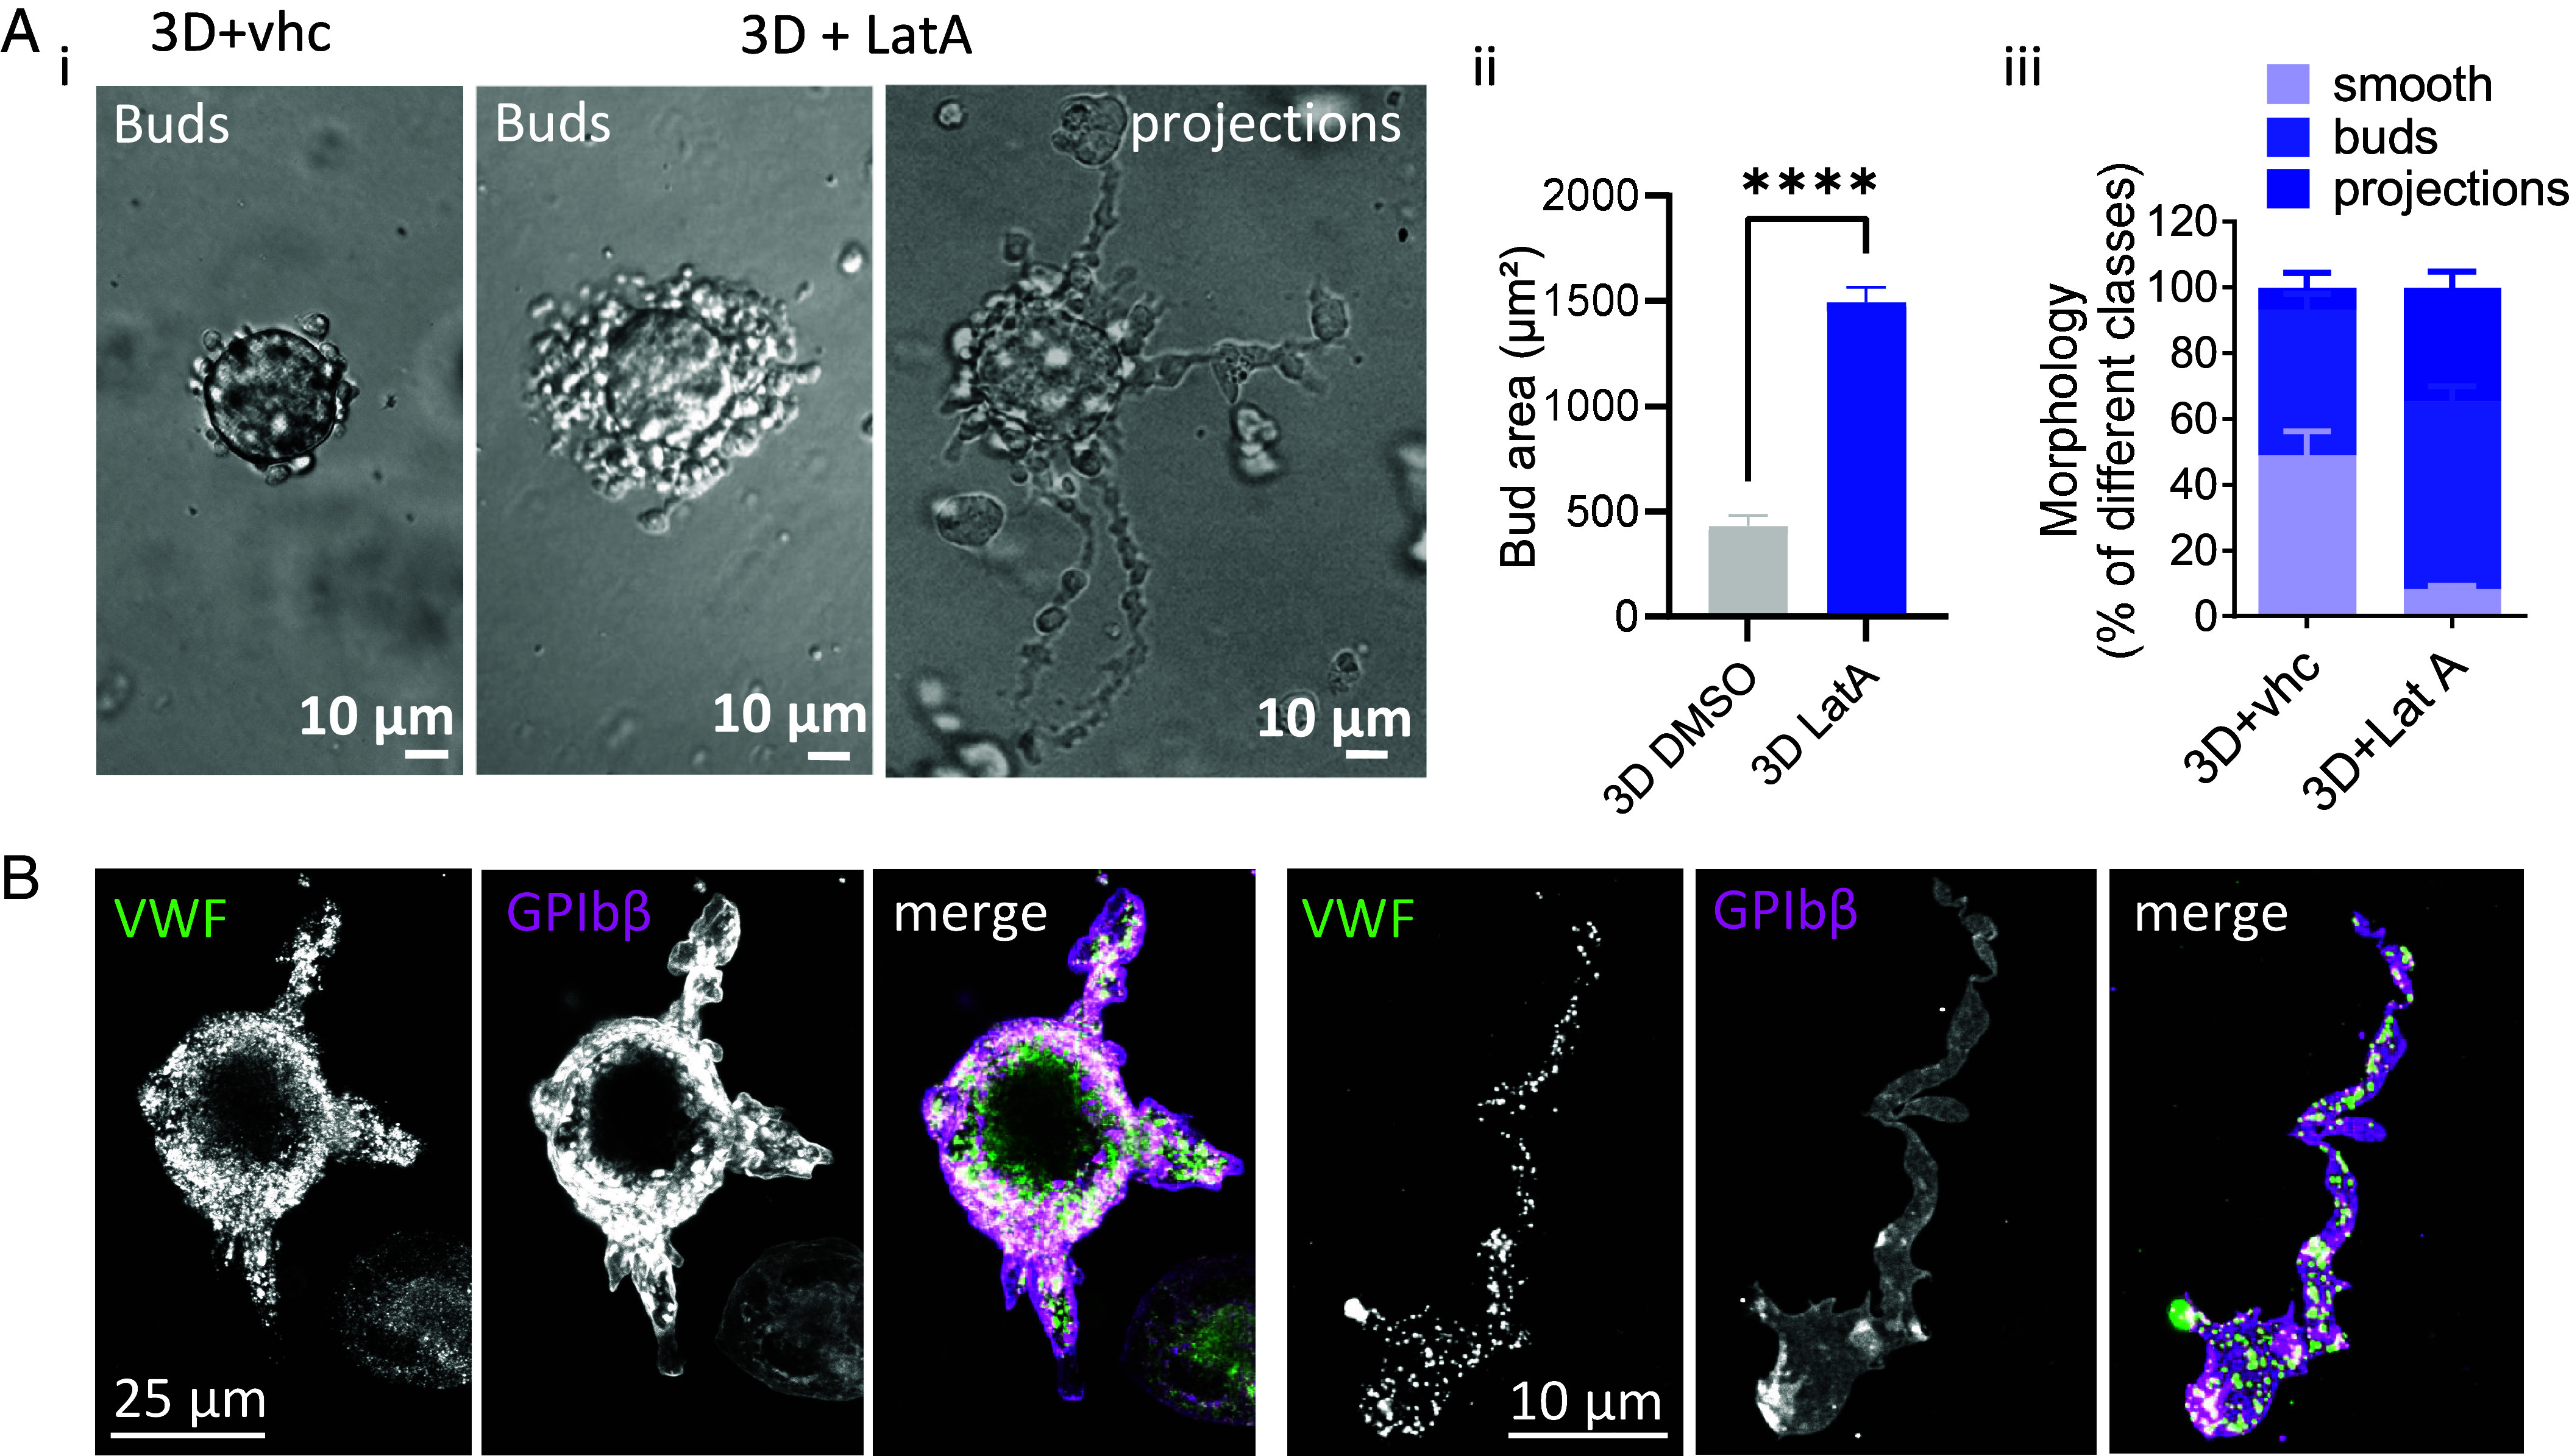
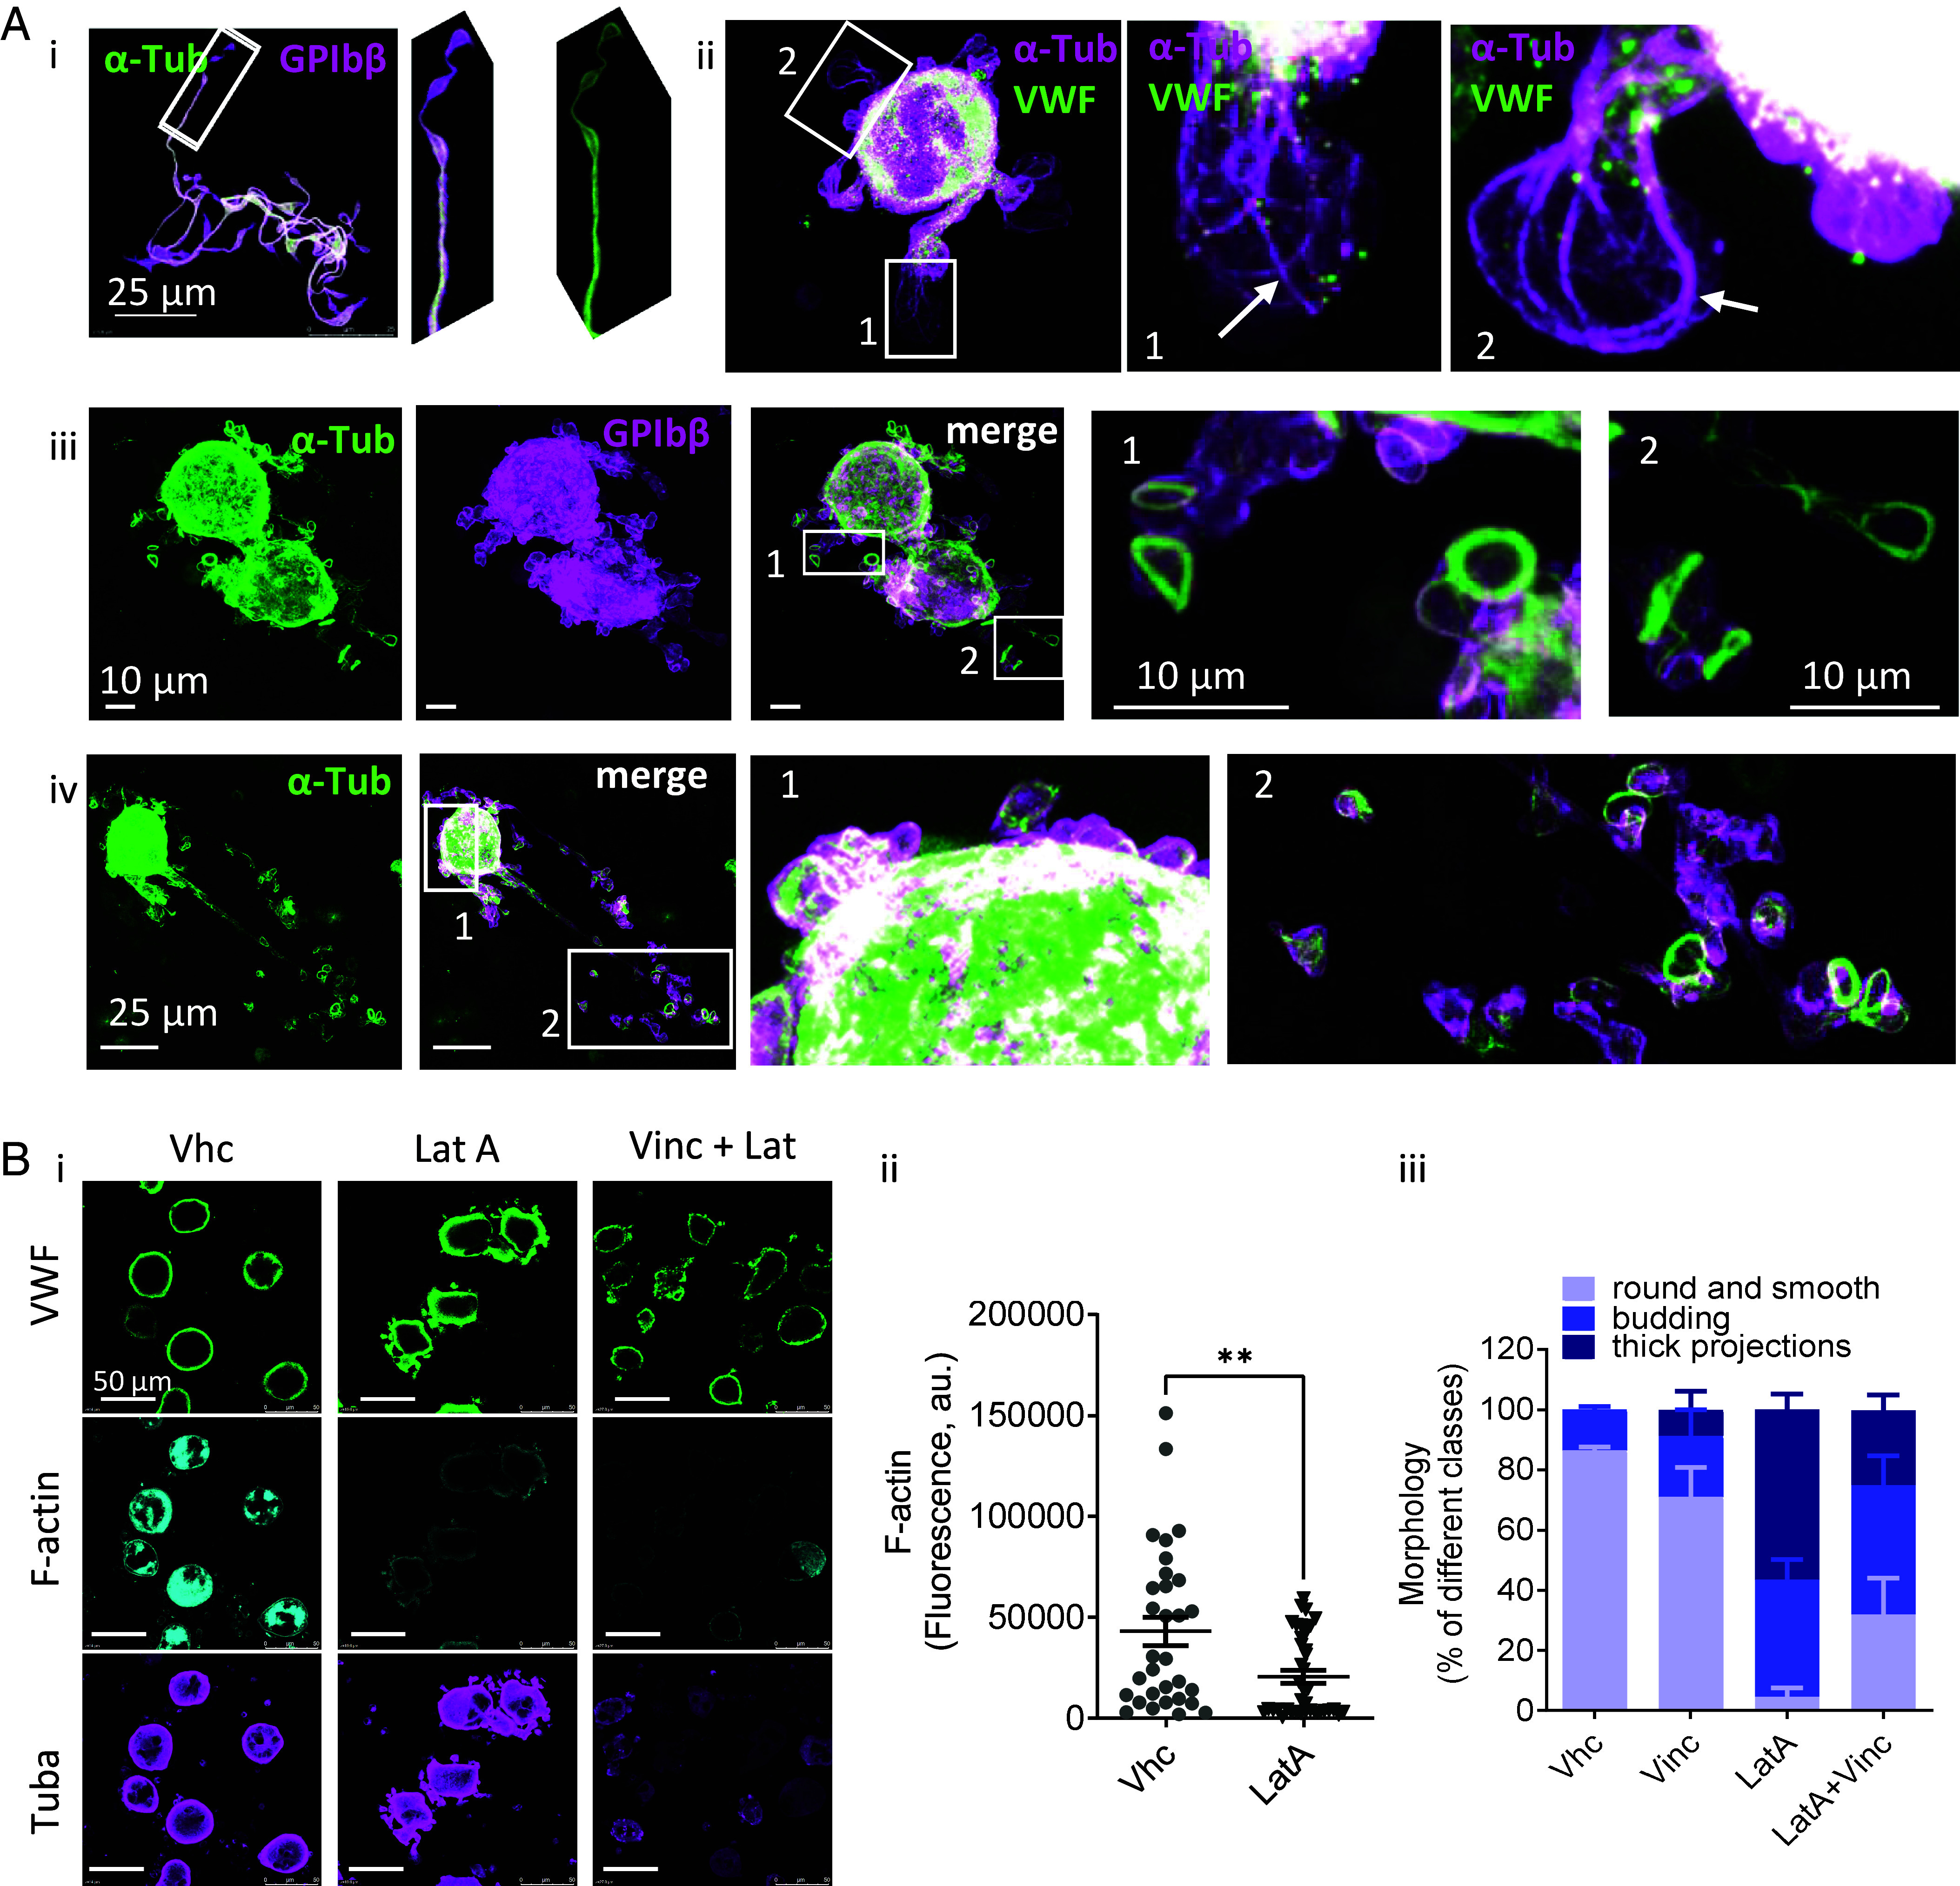
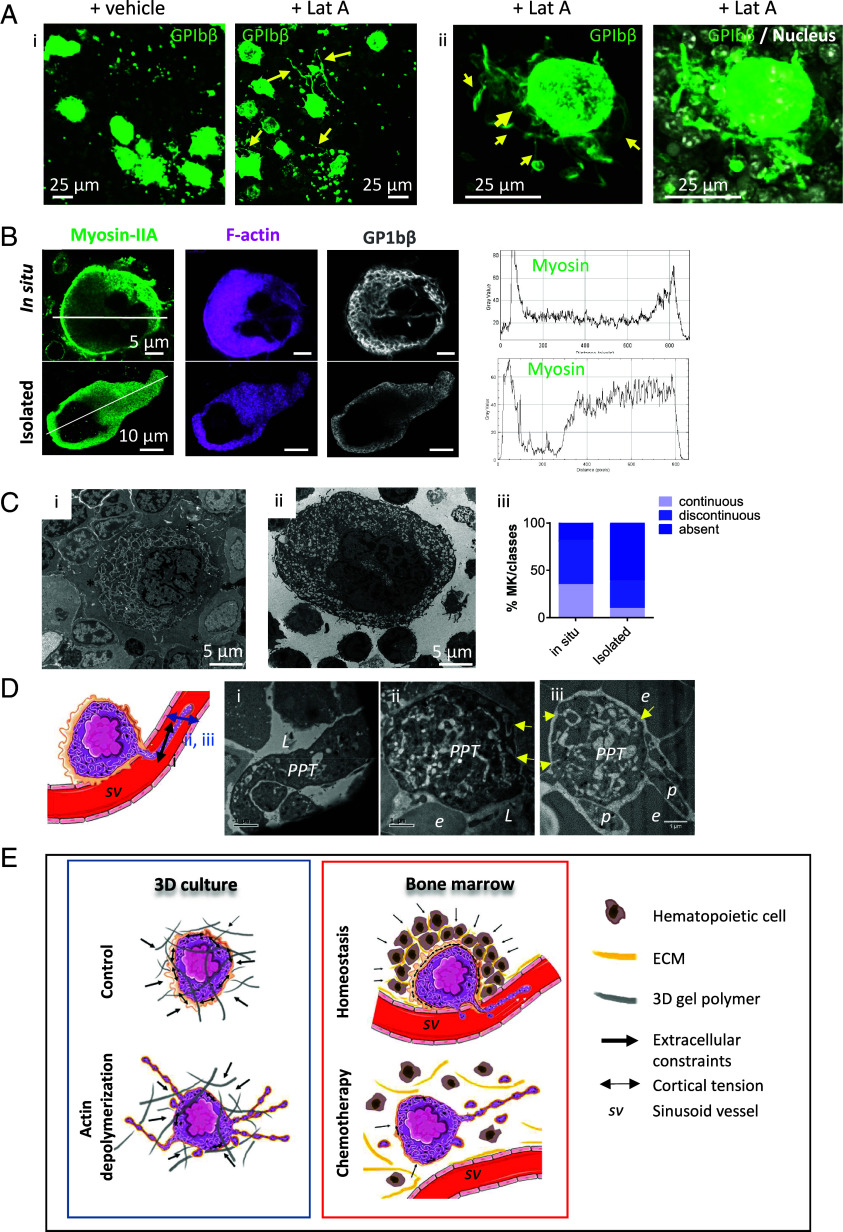
Blood platelets are produced by megakaryocytes (MKs), their parent cells, which are in the bone marrow. Once mature, MK pierces through the sinusoid vessel, and the initial protrusion further elongates as proplatelet or buds to release platelets. The mechanisms controlling the decision to initiate proplatelet and platelet formation are unknown. Here, we show that the mechanical properties of the microenvironment prevent proplatelet and platelet release in the marrow stroma while allowing this process in the bloodstream. Loss of marrow confinement following myelosuppression led to inappropriate proplatelet and platelet release into the extravascular space. We further used an inert viscoelastic hydrogel to evaluate the impact of compressive stress. Transcriptional analysis showed that culture in three-dimensional gel induced upregulation of genes related to the Rho-GTPase pathway. We found higher Rho-GTPase activation, myosin light chain phosphorylation and F-actin under mechanical constraints while proplatelet formation was inhibited. The use of latrunculin-A to decrease F-actin promoted microtubule-dependent budding and proplatelet extension inside the gel. Additionally, ex vivo exposure of intact bone marrow to latrunculin-A triggered proplatelet extensions in the interstitial space. In vivo, this confinement-mediated high intracellular tension is responsible for the formation of the peripheral zone, a unique actin-rich structure. Cytoskeleton reorganization induces the disappearance of the peripheral zone upon reaching a liquid milieu to facilitate proplatelet and platelet formation. Hence, our data provide insight into the mechanisms preventing ectopic platelet release in the marrow stroma. Identifying such pathways is especially important for understanding pathologies altering marrow mechanics such as chemotherapy or myelofibrosis.

Keywords: 3D culture; cytoskeleton; mechanical confinement; megakaryocyte; myelosuppression.


Conflict of interest statement

Competing interests statement:The authors declare no competing interest.

Figures

Fig. 1.
Fig. 1.
Bone marrow confinement prevents proplatelet extension. (A, i) Bone marrow explant culture: phase contrast microscopy image of the periphery of the explant depicting a MK still confined amongst marrow cells (arrowhead) and another MK located outside the marrow tissue extending proplatelets (arrow); (ii) quantification of the proportion of MKs that extend proplatelets, based on their location, confined or unconfined; data are mean ± SEM of three independent experiments, 625 MKs were classified; P = 0.003 using unpaired t test. (B, i) Histological observation of bone 5-µm-thick paraffin sections stained with hematoxylin-eosin (magnification 20×). Note the bone marrow decellularization 5 d after 5-FU (150 mg/kg) bolus administration, leading to loss of MK confinement; * denotes MK; representative of at least six independent mice; (ii) proplatelet extended extravascularly; immunolabeling and confocal observation of 50-µm-thick bone sections 5 d after 5-FU injection; images are maximal projections of 59 optical sections (z-step size is 0.346 µm); MKs are identified by GPIbβ labeling (green), sinusoid vessels by endothelial labeling with Fabp4 (gray). L, lumen of sinusoid vessels; yellow arrow denotes proplatelet and white arrows individual platelets present in the extravascular compartment. (C) Different MK morphologies according to culture condition: i), bright field microphotograph illustrating MKs in 2D liquid culture displaying either rounded morphology (arrowheads) or proplatelets (arrow); (ii) MKs cultured in 3D hydrogel with distinct budding structures. The images presented are representative of at least 15 cultures. (iii) Quantification of the percentage of MKs belonging to each morphological category; 60 MKs derived from two independent cultures have been categorized.
Fig. 2.
Fig. 2.
Screening and enrichment analysis of DEG between 3D confined vs. liquid condition. (A) Overview of the approach used to evaluate the impact of 3D confinement on MK gene expression. (B) Volcano plot of global DEG in MK enrich cells between 3D gel and liquid culture. Threshold set to adjusted P-value < 0.05, with log2(Fold Change) cutoff of 1. Red dots represent significantly up-regulated genes in 3D gel; blue dots represent significantly down-regulated genes in 3D gel; gray dots represent not significantly differentially expressed genes. A selection of significantly DEG is written. (C) Heatmap representation of the first 50 most significantly DEG between the 3D gel group (Gel1, Gel2, Gel3, and Gel4) and the liquid condition group (Liq1, Liq2, Liq3, and Liq4). Hierarchical clustering was performed using SR Plot software. Each column represents a sample. Values represented are the Z-score of the normalized counts divided by median of transcript length. Rows and columns were clustered with the Euclidean distance. (D) Left, Bar plot representation of the top 25 most significant annotation of GO-Biological process (gene count ≥ 10) from the genes significantly up-regulated in 3D gel (adjusted P-value < 0,05, Log2FC ≥ 1); Right, the top 25 most significantly enriched biological pathways from genes up-regulated in 3D gel, based on the Reactome resource (P-value < 0.01, gene count ≥ 10). Red boxes highlight pathways enrich for Rho GTPase function related terms.
Fig. 3.
Fig. 3.
3D confinement controls Rho GTPase activation and F-actin levels. (A) Impact of 3D gel culture on RhoA GTPase activation, F-actin and P-MLC. Immunolabeling and representative confocal image for (i) active RhoA (RhoA-GTP) and F-actin, (ii) P-MLC and F-actin; green is RhoA-GTP or P-MLC labeling, grey is DAPI (nucleus), magenta is phalloidin (F-actin); (iii) quantification of RhoA-GTP (108 to 133 MKs analyzed from five independent cultures), F-actin (55 to 75 MKs, three independent experiments), and P-MLC (49 to 59 MKs, three independent experiments). (B) Impact of loss of 3D gel confinement (3D→Liq) on the level of RhoA-GTP and F-actin. MK grown in 3D gel were resuspended in liquid medium for 2 h. Upper panels, confocal images showing the nucleus (gray, DAPI labeling), active RhoA (green) and F-actin (magenta, phalloidin labeling). Lower panels, quantification of fluorescence, 60 to 61 MKs analyzed from three independent cultures. (C) Impact of transition from liquid to 3D gel milieu for 4 h. Upper panels, confocal images showing the nucleus (gray, DAPI labeling), active RhoA (green) and F-actin (magenta, phalloidin labeling). Lower panels, quantification of P-MLC (62 to 66 MKs) and RhoA-GTP (31 to 43 MKs) fluorescence, all analyzed from three independent cultures. (D) 2D vertical confinement (5-µm height). Left panels, representative maximal projection of a whole cell showing the nucleus (gray, DAPI labeling), active RhoA (green), and F-actin (magenta); Right panels, quantification of fluorescence in 2D confined and unconfined conditions, on maximal projections of z stack images; 50 to 54 MKs from three independent experiments. (AD) Quantifications are mean ± SEM.
Fig. 4.
Fig. 4.
F-actin depolymerization triggers protrusions within the 3D gel. (A, i) Bright field microphotographs showing MKs in 3D gel in the absence (vehicle, vhc) or presence of 10 µM Latrunculin A added for 4 h; representative of at least eight experiments; (ii) quantification of the bud area surrounding the MK body; data are mean ± SEM of three independent experiments (93 to 101 MK); ****P < 0.0001 using Mann-Whitney test; (iii) quantification of the proportion of MKs in each morphological class; data are mean ± SEM of four independent experiments (30 MKs observed/experiment). (B) Confocal images of LatA-treated MKs grown in 3D gel; VWF immunolabeling (green) denotes α granules. Magenta is GPIbβ labeling. Left panels, MK with short projections; Right panels, elongated protrusion detached from the MK body. Representative of at least six independent experiments.
Fig. 5.
Fig. 5.
In gel protrusions rely on microtubules. (A) Confocal images showing microtubule distribution in proplatelets extended (i) in liquid medium without vehicle [magenta is GPIbβ and green is α-tubulin (α-Tub)] or (iiiv) in protrusions observed in LatA-treated MKs in 3D gel; images are maximal projections; in ii, magenta is α-tubulin and VWF is green; in iii and iv, magenta is GPIbβ labeling and α-tubulin is green. Representative of at least three independent experiments. (B) Impact of vincristine on the LatA-mediated protrusions, performed on three independent experiments; (i) wide field confocal images from MKs treated with vhc, LatA, or vincristine+LatA; labeling for VWF (green), F-actin (blue), α-tubulin (Tuba) (magenta); (ii) quantification of residual F-actin following LatA treatment, mean±SEM, n = 31 to 39 MKs from three independent experiments; (iii) quantification of the proportion of MKs in each morphological class; quantification was done on living cells in the 3D gel, before fixation and immunolabeling; mean ± SEM, 90 MKs observed.
Fig. 6.
Fig. 6.
Intracellular contractility induced by the stroma prevents proplatelet and platelet formation in the extravascular milieu. (A, i) Low magnification confocal observation (maximal z projection, z-step is 0.3 µm, 100 steps) of 50-µm thick section from flushed BM treated for 6 h with LatA (10 µM) or vhc; green, MKs labeled with anti-GPIbβ antibody; (ii) high magnification showing a LatA-treated MK extending several proplatelets in the marrow stroma; Left is GpIbβ staining, Right is merge images with nucleus labeling (gray, DAPI labeling); arrows indicate LatA-induced proplatelets extended in the extravascular compartment. Representative of at least three mice; (B) Comparison of cytoskeletal organization between in situ and isolated MKs. Upper panels, MK from a cryoembedded bone marrow section observed by confocal (1 optical section) showing myosin IIA (green), F-actin (magenta), and GPIbβ labeling (gray); Lower panels, same labeling of a MK recovered in liquid medium after marrow collagenase digestion (Upper and Lower images were acquired with different settings that do not allow comparison of fluorescence intensity). Note the prominent actomyosin accumulation at the periphery of the MK in situ and its relatively homogeneous redistribution when isolated in liquid medium (compare the two right profile plots obtained along the white drawing lines). Representative of at least three independent experiments. (C, i) TEM showing the presence of the actomyosin-rich PZ (denoted by *) in a MK in situ; (ii) TEM showing the absence of PZ in MKs isolated in liquid medium; representative of at least three independent experiments; (iii) quantification of MKs presenting a continuous, discontinuous, or absence of PZ (n = 157 to 195 MKs from three independent experiments). (D) Left, schema depicting the proplatelet longitudinal (i) and transversal (ii and iii) sections showed in adjacent TEM images; right, TEM are from in situ bone marrow; L, sinusoid vessel lumen; e, erythrocyte; p, platelet; PPT, proplatelet; note the disappearance of the PZ, allowing direct fusion between the inner DMS membranes (white vacuoles) and the plasma membrane (yellow arrows in ii and iii), bar is 1 µm. (E) Proposed mechanical control of bud and proplatelet formation by constraints from the bone marrow microenvironment. Compressive stress from the bone marrow stroma promotes high intracellular tension that prevents the inappropriate release of platelets and proplatelets in the extravascular milieu. Loss of intracellular tension (chemotherapy-induced reduced confinement or MK initial protrusion reaching the fluid blood) triggers buds and proplatelets extension.

Similar articles

References

    1. Jansen K. A., et al. , A guide to mechanobiology: Where biology and physics meet. Biochim. Biophys. Acta 1853, 3043–3052 (2015). - PubMed
    1. Doolin M. T., Moriarty R. A., Stroka K. M., Mechanosensing of mechanical confinement by mesenchymal-like cells. Front. Physiol. 11, 365 (2020). - PMC - PubMed
    1. Zonderland J., Moroni L., Steering cell behavior through mechanobiology in 3D: A regenerative medicine perspective. Biomaterials 268, 120572 (2021). - PubMed
    1. Desmaison A., et al. , Impact of physical confinement on nuclei geometry and cell division dynamics in 3D spheroids. Sci. Rep. 8, 8785 (2018). - PMC - PubMed
    1. Shin J. W., et al. , Contractile forces sustain and polarize hematopoiesis from stem and progenitor cells. Cell Stem Cell 14, 81–93 (2014). - PMC - PubMed