. 2024 Sep 10;121(37):e2400654121.
doi: 10.1073/pnas.2400654121. Epub 2024 Sep 5.

Single-molecule force spectroscopy reveals intra- and intermolecular interactions of Caenorhabditis elegans HMP-1 during mechanotransduction

Affiliations

Single-molecule force spectroscopy reveals intra- and intermolecular interactions of Caenorhabditis elegans HMP-1 during mechanotransduction

Shimin Le et al. Proc Natl Acad Sci U S A. .

Abstract

The Caenorhabditis elegans HMP-2/HMP-1 complex, akin to the mammalian [Formula: see text]-catenin-[Formula: see text]-catenin complex, serves as a critical mechanosensor at cell-cell adherens junctions, transducing tension between HMR-1 (also known as cadherin in mammals) and the actin cytoskeleton. Essential for embryonic development and tissue integrity in C. elegans, this complex experiences tension from both internal actomyosin contractility and external mechanical microenvironmental perturbations. While offering a valuable evolutionary comparison to its mammalian counterpart, the impact of tension on the mechanical stability of HMP-1 and HMP-2/HMP-1 interactions remains unexplored. In this study, we directly quantified the mechanical stability of full-length HMP-1 and its force-bearing modulation domains (M1-M3), as well as the HMP-2/HMP-1 interface. Notably, the M1 domain in HMP-1 exhibits significantly higher mechanical stability than its mammalian analog, attributable to interdomain interactions with M2-M3. Introducing salt bridge mutations in the M3 domain weakens the mechanical stability of the M1 domain. Moreover, the intermolecular HMP-2/HMP-1 interface surpasses its mammalian counterpart in mechanical stability, enabling it to support the mechanical activation of the autoinhibited M1 domain for mechanotransduction. Additionally, the phosphomimetic mutation Y69E in HMP-2 weakens the mechanical stability of the HMP-2/HMP-1 interface, compromising the force-transmission molecular linkage and its associated mechanosensing functions. Collectively, these findings provide mechanobiological insights into the C. elegans HMP-2/HMP-1 complex, highlighting the impact of salt bridges on mechanical stability in [Formula: see text]-catenin and demonstrating the evolutionary conservation of the mechanical switch mechanism activating the HMP-1 modulation domain for protein binding at the single-molecule level.

Keywords: HMP-1; HMP-2; magnetic tweezers; salt bridges.


Conflict of interest statement

Competing interests statement:The authors declare no competing interest.

Figures
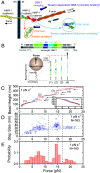
Fig. 1.
Fig. 1.
Mechanical stability of full-length HMP-1. (A) Illustration of the force-transmission supramolecular linkage from membrane HMR-1 (cadherin) to the actin cytoskeleton via HMP-2 (β-catenin) and HMP-1 (α-catenin), DEB-1 (vinculin) in the surrounding solution, and questions raised related to the mechanotransduction mediated by this linkage. (B) Sketches of the single-molecule construct and the experimental design. The Top panel shows the domain map of the construct: AviTag, two repeats of I27 domain (I27)2, full-length HMP-1, (I27)2, SpyTag. The Bottom panel shows a single-molecule tether between a SpyCatcher-coated coverslip surface and a biotin-DNA-coated superparamagnetic bead (via streptavidin). Structural changes of the domains in the tether lead to extension changes of the molecule, which can be detected by the corresponding bead height changes. (C) Four representative force–height curves of a full-length HMP-1 tether during force-increase scans at a loading rate of 1 pN s-1. The colored curves were obtained by 10-point FFT (fast Fourier transformation) smoothing of the raw data (gray). The arrows indicate the unfolding events of the six domains in HMP-1. The Inset shows the refolding events during force-decrease scans at a loading rate of 0.1 pN s-1. (D and E) The resulting force-dependent unfolding step sizes and the normalized force histogram obtained over 30 repeats of scans from three independent tethers. N in panel (D) indicates the total number of unfolding events.
Fig. 2.
Fig. 2.
Mechanical stability of the HMP-1 modulation domains. (A) Sketches of the single-molecule construct and the experimental design. The Top panel shows the domain map of the construct, and the structure of the modulation domains (PDB:5H5M) (19). The Bottom panel shows a single-molecule tether under force. (B) Five representative force–height curves of the HMP-1 modulation domains during force-increase scans at a loading rate of 1 pN s-1. (C and D) The resulting force-dependent step sizes and the normalized force histogram of the unfolding events obtained over 165 repeats of scans from five tethers. The unfolding events are divided into three groups based on unfolding forces and step sizes. The data shown in magenta correspond to the unfolding of two domains within a timeframe shorter than 0.1 s, which is attributed as a single-step process with a large step size (SI Appendix, Text S2 and Fig. S2). The number of unfolding events (N) in each group and the corresponding average unfolding forces and step sizes are indicated (C). The blue curve in panel (D) is the double-Gaussian fitting to the normalized unfolding force histogram. The peak forces are indicated. The area ratio (0.66:0.26) of the two groups is also indicated. (E) Three representative force–height curves (colored curves) of HMP-1 modulation domains during force-decrease scans with a loading rate of 0.1 pN s-1 starting from a fully unfolded conformation. As a comparison, the force–height curves of the HMP-1 modulation domains with all three domains folded (gray curves) are also plotted.
Fig. 3.
Fig. 3.
Mechanical activation of HMP-1 modulation domains for vinculin-D1 binding. (A) The Top panel shows the domain map of the HMP-1 modulation domains. The Bottom panel shows a single-molecule tether under force. (B) Representative force-height curves during force-increase scans in the absence of vinculin-D1 (dark gray curves) and in the presence of 10 nM vinculin-D1 (magenta and orange curves). (C) Representative force-height curves during force-increase scans in the absence of vinculin-D1 (dark gray curves) and in the presence of 200 nM vinculin-D1 (magenta and red curves). (D and E) The resulting force-dependent step sizes and the normalized unfolding force histogram obtained over 150 repeats of scans from five tethers in 200 nM vinculin-D1. The unfolding events are divided into three groups based on unfolding forces. The number of unfolding events (N) in each group and the corresponding average unfolding forces and step sizes are indicated (D). The blue curve in panel (E) is the triple-Gaussian fitting to the normalized unfolding force histogram. The peak forces and the area ratio (0.08:0.52:0.40) of the three groups are indicated.
Fig. 4.
Fig. 4.
Effects of R551A and R554A mutations in M3 on mechanical stability of the HMP-1 modulation domains. (A) The Left panel shows the domain map of the HMP-1 modulation domains with salt bridge mutations. The Right panel shows a schematic of the conformations of HMP1-M1-M2-M3 under force with or without vinculin D1. (B) Four representative force-height curves of the HMP-1 modulation domains carrying the R551A and R554A mutations in M3 during force-increase scans at a loading rate of 1 pN s-1. (C and D) The resulting force-dependent step sizes and the normalized force histogram of the unfolding events obtained over 171 repeats of scans from 13 tethers. The unfolding events are divided into three groups indicated with different colors based on unfolding forces and step sizes. The number of unfolding events (N) in each group and the corresponding average unfolding forces and step sizes are indicated (C). The blue curve in panel (D) is the triple-Gaussian fitting to the normalized unfolding force histogram. The peak forces are indicated. (E) Representative force-height curves during force-increase scans in the absence of vinculin-D1 (cycle 1) and in the presence of 200 nM vinculin-D1 (cycle 2 to 5). Compared to panel (B), the unfolding events at forces below 10 pN were no longer observed for this tether during repeating force cycles. (F and G) The resulting force-dependent step sizes and the normalized unfolding force histogram obtained over 268 repeats of scans from 10 tethers in 200 nM vinculin-D1. Compared to panels (C and D), the weakest group corresponding to unfolding events at forces below 10 pN disappears. The number of unfolding events (N) in each group and the corresponding average unfolding forces and step sizes are indicated (F). The blue curve in panel (G) is the double-Gaussian fitting to the normalized unfolding force histogram.
Fig. 5.
Fig. 5.
Mechanical stability of the HMP-2/HMP-1 interface. (A) The single-molecule construct, the domain map, the structure of the HMP-2/HMP-1 interface (PDB:5XA5) (20), and the single-molecule tether under force. (B) Representative force–height curves of a tether during force-increase scans at a loading rate of 1 pN s-1. (C and D) The resulting force-dependent step sizes (C) and the normalized rupturing force histograms (D) obtained over 50 repeats of scans for five tethers at three indicated force loading rates. The number of rupturing events, the average forces, and the average step sizes at corresponding loading rates are N = 56, F= 15.9 ± 1.9 pN, ΔH= 115.4 ± 12.2 nm (0.2 pN s-1); N = 178, F= 16.6 ± 1.7 pN, ΔH= 110.9 ± 8.4 nm (1 pN s-1); and N = 106, F= 19.1 ± 3.1 pN, ΔH= 112.6 ± 14.2 nm (5 pN s-1). (E) Representative force–height curves of a tether during force-clamp at 14.0 pN. The stepwise bead height jumps indicate the rupturing of the HMP-2/HMP-1 interface. (F) The resulting force-dependent average lifetime τ(F) of the HMP-2/HMP-1 interface obtained from such force-clamp experiments, which can be well fitted with Bell’s model, τ(F)=k01eFΔkBT, where Δ is the transition distance and k0 is the extrapolated zero-force rupturing rate. (G) Top: representative force–height curves of the tether during force-increase scans at the indicated loading rate starting from a conformation in which the HMP-2/HMP-1 interface was not re-formed, whereas the N1 and N2 domains were refolded. Bottom: the resulting normalized unfolding force histogram during the force-increase scans. (H) Representative time traces of the bead height at indicated constant forces, before the re-formation of the interface. Dynamic unfolding and refolding of the N1 and N2 domains were observed.
Fig. 6.
Fig. 6.
Effects of Y69E or S47E mutations in HMP-2 on mechanical stability of the HMP-2/HMP-1 interface. (A) Sketches of the domain map and sequences of HMP-2-Nt. (B) Representative force–height curves of a HMP-1–HMP-2Y69E interface tether during force-increase scans at 1 pN s-1. (C and D) The resulting force-dependent step sizes and the normalized rupturing force histograms obtained at the three indicated loading rates. The number of rupturing events, the average forces, and the average step sizes at corresponding loading rates are N = 110, F= 3.8 ± 1.3 pN, ΔH = 33.6 ± 10.9 nm; N = 5, F= 13.0 ± 1.0 pN, ΔH= 106.1 ± 9.7 nm (0.2 pN s-1, two groups); N = 90, F= 6.1 ± 2.1 pN, ΔH= 45.0 ± 9.4 nm; N = 184, F= 14.1 ± 1.4 pN, ΔH= 106.9 ± 12.5 nm (1.0 pN s-1, two groups); N = 344, F= 8.9 ± 2.7 pN, ΔH= 39.7 ± 7.6 nm; and N = 318, F= 16.0 ± 1.4 pN, ΔH= 111.8 ± 9.1 nm (5.0 pN s-1, two groups); (E) Representative force–height curves of a HMP-2/HMP-1S47E interface tether during force-increase scans at 1 pN s-1. (F and G) The resulting force-dependent step sizes and the normalized rupturing force histograms obtained at the three indicated loading rates. The number of rupturing events, the average forces, and the average step sizes at corresponding loading rates are N = 108, F= 13.6 ± 1.2 pN, ΔH= 107.4 ± 9.2 nm (0.2 pN s-1); N = 261, F= 14.7 ± 1.5 pN, ΔH= 105.1 ± 7.9 nm (1.0 pN s-1); N = 67, F= 16.3 ± 1.7 pN, ΔH= 117.3 ± 10.9 nm (5.0 pN s-1).
Fig. 7.
Fig. 7.
Illustration the mechanotransduction of force-transmission supramolecular linkage from membrane HMR-1 (cadherin) to the actin cytoskeleton via HMP-2 (β-catenin) and HMP-1 (α-catenin). At low tensions, the M domain of HMP-1 assumes a compact conformation, where the SRGP-1 binds. At higher tensions, the M domain is extended and the M1 subdomain is unfolded. The mechanically unfolded M1 exposes the DEB-1 (vinculin) binding site.

References

    1. Le S., Yu M., Yan J., Mechanical regulation of tension-transmission supramolecular linkages. Curr. Opin. Solid State Mater. Sci. 25, 100895 (2021).
    1. Borghi N., et al. , E-cadherin is under constitutive actomyosin-generated tension that is increased at cell-cell contacts upon externally applied stretch. Proc. Natl. Acad. Sci. U.S.A. 109, 12568–12573 (2012). - PMC - PubMed
    1. Charras G., Yap A. S., Tensile forces and mechanotransduction at cell–cell junctions. Curr. Biol. 28, R445–R457 (2018). - PubMed
    1. Hirano Y., Amano Y., Yonemura S., Hakoshima T., The force-sensing device region of α-catenin is an intrinsically disordered segment in the absence of intramolecular stabilization of the autoinhibitory form. Genes Cells 23, 370–385 (2018). - PubMed
    1. Yao M., et al. , Force-dependent conformational switch of α-catenin controls vinculin binding. Nat. Commun. 5, 4525 (2014). - PubMed

MeSH terms

LinkOut - more resources