. 2024 Sep 10;121(37):e2402817121.
doi: 10.1073/pnas.2402817121. Epub 2024 Sep 5.

Decoding the molecular mechanism of selective autophagy of glycogen mediated by autophagy receptor STBD1

Affiliations

Decoding the molecular mechanism of selective autophagy of glycogen mediated by autophagy receptor STBD1

Yuchao Zhang et al. Proc Natl Acad Sci U S A. .

Abstract

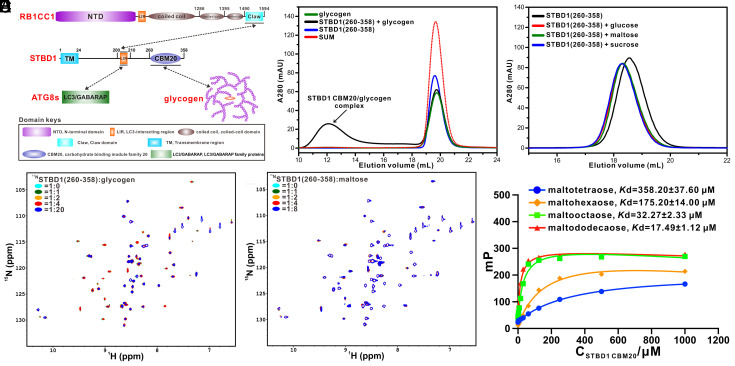
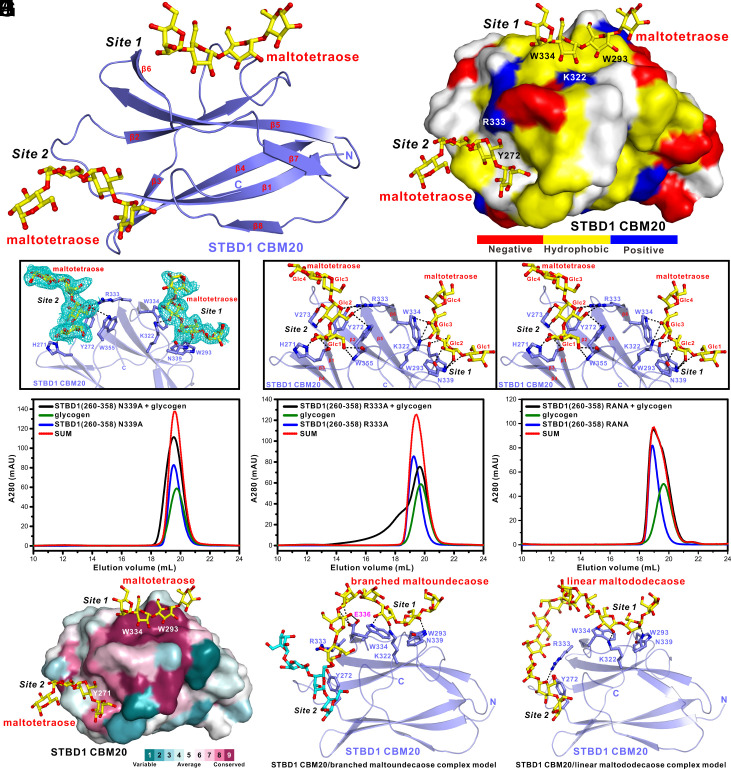
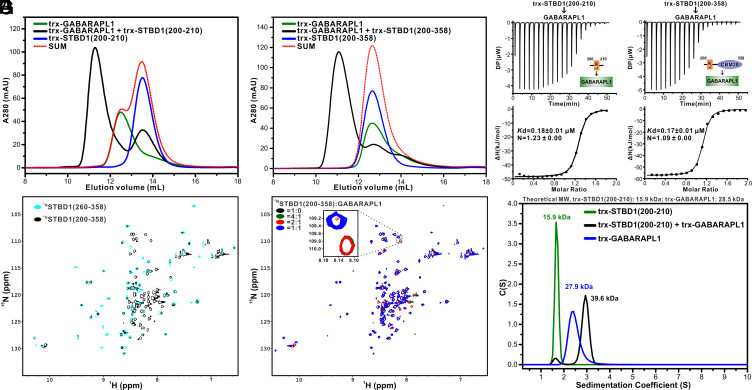
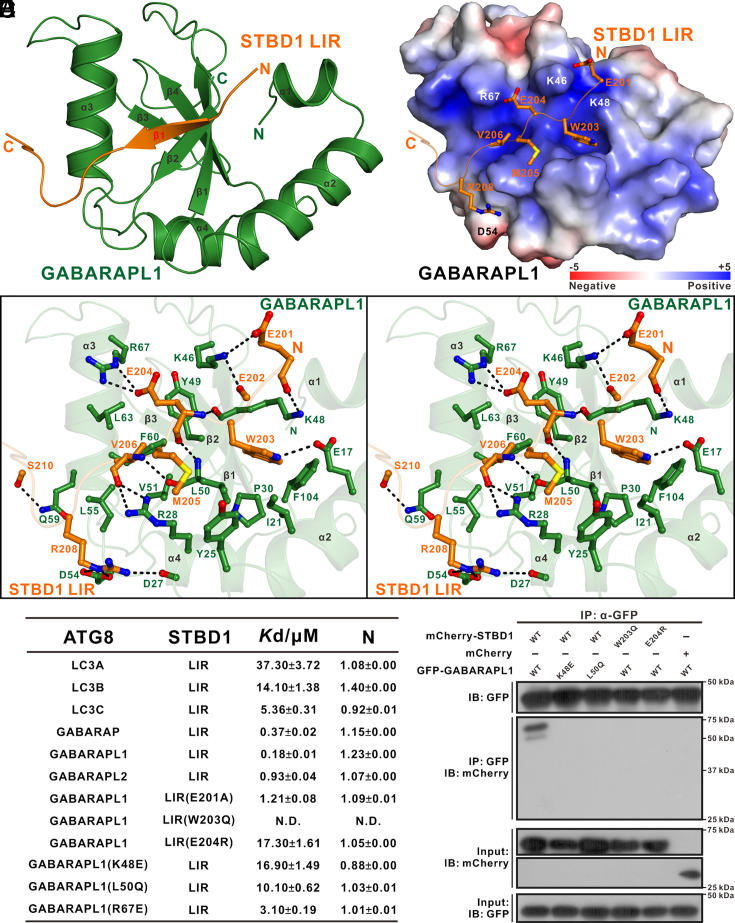
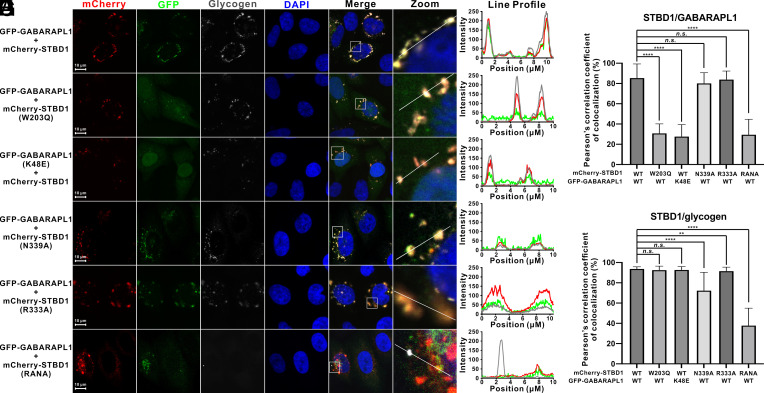
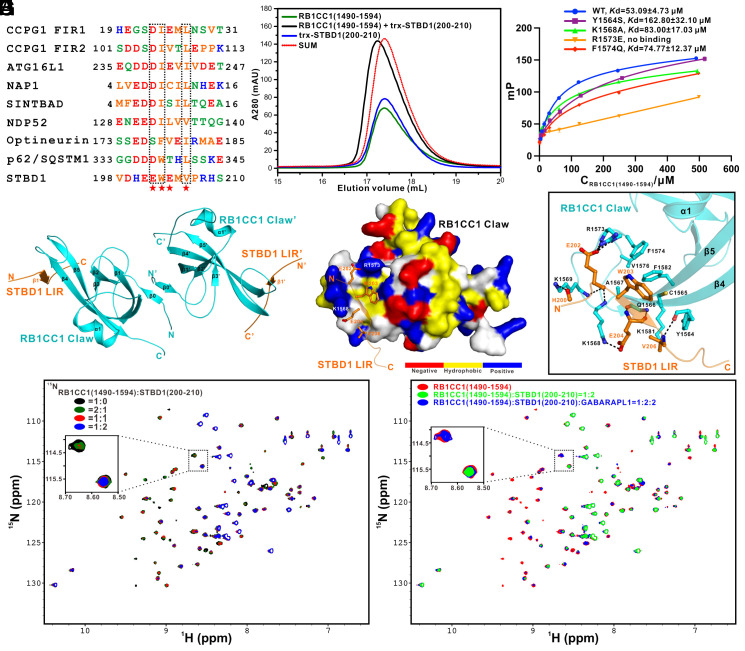
Autophagy of glycogen (glycophagy) is crucial for the maintenance of cellular glucose homeostasis and physiology in mammals. STBD1 can serve as an autophagy receptor to mediate glycophagy by specifically recognizing glycogen and relevant key autophagic factors, but with poorly understood mechanisms. Here, we systematically characterize the interactions of STBD1 with glycogen and related saccharides, and determine the crystal structure of the STBD1 CBM20 domain with maltotetraose, uncovering a unique binding mode involving two different oligosaccharide-binding sites adopted by STBD1 CBM20 for recognizing glycogen. In addition, we demonstrate that the LC3-interacting region (LIR) motif of STBD1 can selectively bind to six mammalian ATG8 family members. We elucidate the detailed molecular mechanism underlying the selective interactions of STBD1 with ATG8 family proteins by solving the STBD1 LIR/GABARAPL1 complex structure. Importantly, our cell-based assays reveal that both the STBD1 LIR/GABARAPL1 interaction and the intact two oligosaccharide binding sites of STBD1 CBM20 are essential for the effective association of STBD1, GABARAPL1, and glycogen in cells. Finally, through mass spectrometry, biochemical, and structural modeling analyses, we unveil that STBD1 can directly bind to the Claw domain of RB1CC1 through its LIR, thereby recruiting the key autophagy initiation factor RB1CC1. In all, our findings provide mechanistic insights into the recognitions of glycogen, ATG8 family proteins, and RB1CC1 by STBD1 and shed light on the potential working mechanism of STBD1-mediated glycophagy.

Keywords: GABARAPL1; RB1CC1; STBD1; glycogen; glycophagy.


Conflict of interest statement

Competing interests statement:The authors declare no competing interest.

Figures

Fig. 1.
Fig. 1.
Biochemical characterizations of the interactions of STBD1 CBM20 domain with glycogen and relevant saccharides. (A) A schematic diagram showing the domain organization of STBD1, ATG8, RB1CC1, and glycogen. In this drawing, the STBD1/ATG8, STBD1/RB1CC1, and STBD1/glycogen interactions are further highlighted and indicated by two-way arrows. (B) SEC-based analyses of the interaction between STBD1 CBM20 and glycogen, which was performed on the Superdex™ 200 Increase 10/300 GL column. A280, absorbance at 280 nm. (C) SEC-based analyses of the interaction between STBD1 CBM20 and relevant saccharides which was performed on the Superdex™ 75 10/300 GL column. (D and E) Superposition plots of the 1H-15N HSQC spectra of 15N-labeled STBD1(260-358) titrated with the increasing molar ratios of glycogen (D) or maltose (E). The NMR peaks in the 1H-15N HSQC spectra of the STBD1 CBM20 domain show obvious peak broadenings when STBD1 CBM20 is titrated with glycogen (D), while they remain intact in the presence of maltose (E). In the NMR titration assay in panel D, the molar concentration of glycogen is calculated by Weightglycogen/Molar massglucose. ppm, parts per million. (F) FP-based measurements of the binding affinities of STBD1(260-358) with different oligosaccharides, including linear maltotetraose, maltohexaose, maltooctaose, and maltododecaose. The Kd values are the fitted dissociation constants with SE, when using the one-site binding model to fit the FP data. mp, mp = p/1000, where p is the measured fluorescence polarization value.
Fig. 2.
Fig. 2.
Structural analyses of the STBD1 CBM20/maltotetraose complex. (A) Ribbon diagram showing the overall structure of the STBD1 CBM20/maltotetraose complex. In this drawing, the STBD1 CBM20 domain is shown in slate, and the two maltotetraose molecules are in yellow. (B) Combined surface representation showing the hydrophobic binding interface between STBD1 CBM20 and maltotetraose. In this drawing, the bound two maltotetraose molecules are displayed in the stick model, and the STBD1 CBM20 domain is shown in the surface representation colored by amino acid types. Specifically, the hydrophobic amino acid residues in the surface model of STBD1 CBM20 are drawn in yellow, the positively charged residues in blue, the negatively charged residues in red, and the uncharged polar residues in gray. (C) The FO-FC map of the maltotetraose in the STBD1 CBM20/maltotetraose complex structure. The electron density map is calculated by omitting the maltotetraose molecules from the final PDB file, and contoured at 2.0σ. The side chains of the key residues that are important for the STBD1 CBM20/maltotetraose interactions are shown in the stick mode. (D) Stereo view of the ribbon-stick model showing the detailed interactions between the STBD1 CBM20 domain and two maltotetraose molecules in the STBD1 CBM20/maltotetraose complex structure. The related hydrogen bonds involved in the binding are shown as dotted lines. (EG) SEC-based analyses of the interactions between glycogen and the STBD1 CBM20 N339A mutant (E), R333A mutant (F), and R333A/N339A (RANA) mutant (G). The SEC-based assays were performed on the Superdex™ 200 Increase 10/300 GL column. (H) Surface representation of STBD1 CBM20 showing that Site 1 in STBD1 CBM20 is conserved in other CBM20 domains, while Site 2 is highly variable. In this drawing, the surface of STBD1 CBM20 is colored according to the sequence conservation based on the amino acid sequence alignment of different CBM20 domains using the ConSurf server, and purple and cyan indicate high and low sequence conservation, respectively. (I and J) Structural modeling analyses of the STBD1 CBM20 domain with the branched maltoundecaose linked via an α-1,6-glucosidic bond (I), or the linear maltododecaose (J). In panel I, the linear chain of the branched maltoundecaose is colored by cyan, while the branched chain of the branched maltoundecaose is colored by yellow.
Fig. 3.
Fig. 3.
Biochemical characterizations of the interaction between STBD1 and GABARAPL1. (A and B) SEC-based analyses of the interaction between GABARAPL1 and STBD1(200-210) fragment (A) or STBD1(200-358) fragment (B). The SEC-based assays were performed on Superdex™ 75 10/300 GL column. A280, absorbance at 280 nm. (C and D) ITC-based measurement of the binding affinity of GABARAPL1 with the STBD1(200-210) fragment (C) or the STBD1(200-358) fragment (D). The dissociation constant (Kd) error is the fitted error obtained from the data analysis software when using the one-site binding model to fit the ITC data. DP, the differential power measured by the ITC machine; ΔH, the heat change measured by the ITC machine. (E) Superposition plots of the 1H-15N HSQC spectra of 15N-labeled STBD1(260-358) (cyan) and STBD1(200-358) (black) fragments. (F) Superposition plots of the 1H-15N HSQC spectra of 15N-labeled STBD1(200-358) (black) titrated with the increasing molar ratios of unlabeled GABARAPL1 proteins. For clarity, the Inset shows the enlarged view of a selected region of the overlaid 1H-15N HSQC spectra. ppm, parts per million. (G) Overlay plots of the sedimentation velocity data of STBD1(200-210) (green), GABARAPL1 (blue), and a mixed sample of STBD1(200-210) and GABARAPL1 (black). These results demonstrate that the monomeric STBD1(200-210) can interact with the monomeric GABARAPL1 to form a stable 1:1 stoichiometric complex in solution.
Fig. 4.
Fig. 4.
Structural analyses of the STBD1 LIR/GABARAPL1 complex. (A) Ribbon diagram showing the overall structure of the STBD1 LIR/GABARAPL1 complex. In this drawing, GABARAPL1 is shown in forest green, and the LIR motif of STBD1 is in orange. (B) Combined surface and charged potential presentation (contoured at ±5 kT/eV; blue/red) and the ribbon-stick model showing the charge–charge interactions between STBD1 LIR and GABARAPL1 in the complex structure. (C) Stereo view of the ribbon-stick model showing the detailed interactions between STBD1 LIR and GABARAPL1. The related hydrogen bonds and salt bridges involved in the STBD1 LIR/GABARAPL1 interaction are shown as dotted lines. (D) Measured binding affinities between six mammalian ATG8 family proteins and the STBD1 LIR motif or their mutants by ITC-based analyses. (E) Mutagenesis-based Co-IP assays confirming the interactions between STBD1 and GABARAPL1 observed in the determined STBD1 LIR/GABARAPL1 complex structure. IP, Immunoprecipitation; IB, immunoblotting.
Fig. 5.
Fig. 5.
The cellular colocalization of STBD1, GABARAPL1, and endogenous glycogen in transfected HeLa cells. (A) When coexpressed, GABARAPL1 colocalizes well with the STBD1 perinuclear structures, and STBD1 also colocalizes well with endogenous glycogen. The endogenous glycogen is stained with the anti-glycogen monoclonal antibody (IV58B6). (Scale bar, 10 μm.) (B and C) Point mutations of key interface residues of STBD1 or GABARAPL1, which were proved to disrupt STBD1 LIR/GABARAPL1 interaction in vitro, largely decrease the colocalization of STBD1 and GABARAPL1 in transfected cells, but do not affect the colocalization between STBD1 and endogenous glycogen. (D and E) Point mutations of key interface residues in Site 1 (N339A) or Site 2 (R333A) of STBD1, which were proved to weaken the interaction between STBD1 CBM20 and glycogen in vitro, decrease the colocalization of STBD1 and endogenous glycogen, but do not affect the colocalization of STBD1 with GABARAPL1. (F) Double mutation of key interface residues in both Site 1 and Site 2 of STBD1 (R333A/N339A), which were proved to essentially abolish the interaction between STBD1 CBM20 and glycogen in vitro, not only largely decrease the colocalization of STBD1 and endogenous glycogen, but also largely attenuate the colocalization of STBD1 with GABARAPL1. (G and H) Statistical results related to the colocalizations of relevant STBD1 and GABARAPL1 variants (G), and relevant STBD1 variants with endogenous glycogen (H) in cotransfected HeLa cells, shown as Pearson’s correlations. The Pearson’s correlation coefficient analysis was performed using Leica Application Suite X software based on a randomly selected region that roughly contains one cotransfected HeLa cell. The data represent the mean ± SD of >30 analyzed cells. An unpaired Student’s t test analysis was used to define a statistically significant difference, and the asterisks indicate the significant differences between the indicated bars (****P < 0.0001, **P < 0.01, n.s. P > 0.05).
Fig. 6.
Fig. 6.
STBD1 can specifically bind to the Claw domain of RB1CC1 through its LIR. (A) Sequence alignment analyses of the currently known RB1CC1 Claw-binding FIR motifs of CCPG1, ATG16L1, NAP1, SINTBAD together with the LIRs of NDP52, Optineurin, p62, and STBD1. In this alignment, the highly conserved acidic residues and the following two conserved hydrophobic residues are further boxed, and the residues of STBD1 LIR involved in the interaction with RB1CC1 Claw are highlighted with red stars. (B) SEC-based analyses of the interaction between STBD1(200-210) and RB1CC1(1490-1594) which was performed on the Superdex™ 200 Increase 10/300 GL column. (C) FP-based measurements of the binding affinities of FITC-labeled STBD1(200-210) with RB1CC1(1490-1594) or relevant RB1CC1(1490-1594) mutants including Y1564S, K1568A, R1573E, and F1574Q mutants. The Kd values are the fitted dissociation constants with SE, when using the one-site binding model to fit the FP data. (D) Ribbon diagram showing the overall structure of the dimeric STBD1 LIR/RB1CC1 Claw complex model predicted by ColabFold. (E) Combined surface representation and the ribbon-stick model showing the hydrophobic binding interface between RB1CC1 Claw and STBD1 LIR in the STBD1 LIR/RB1CC1 Claw complex model. In this drawing, RB1CC1 Claw is shown in surface representation colored by amino acid types. (F) Ribbon-stick model showing the detailed interactions between STBD1 LIR and RB1CC1 Claw domain in the STBD1 LIR/RB1CC1 Claw complex model. The related hydrogen bonds involved in the binding are shown as dotted lines. (G) Superposition plots of the 1H-15N HSQC spectra of the RB1CC1 Claw domain (black) titrated with the increasing molar ratios of unlabeled STBD1(200-210) fragment. (H) Superposition plots of the 1H-15N HSQC spectra of the RB1CC1 Claw domain (red) titrated with unlabeled STBD1(200-210) fragment at stoichiometric ratio of 1:2 (green), and then further titrated with unlabeled GABARAPL1 at stoichiometric ratio of 1:2:2 (blue). For clarity, the inset shows the enlarged view of a selected region of the overlaid 1H-15N HSQC spectra.

Similar articles

Cited by

References

    1. Klionsky D. J., Emr S. D., Cell biology–Autophagy as a regulated pathway of cellular degradation. Science 290, 1717–1721 (2000). - PMC - PubMed
    1. Kroemer G., Marino G., Levine B., Autophagy and the integrated stress response. Mol. Cell 40, 280–293 (2010). - PMC - PubMed
    1. Nakatogawa H., Suzuki K., Kamada Y., Ohsumi Y., Dynamics and diversity in autophagy mechanisms: Lessons from yeast. Nat. Rev. Mol. Cell Biol. 10, 458–467 (2009). - PubMed
    1. Levine B., Kroemer G., Biological functions of autophagy genes: A disease perspective. Cell 176, 11–42 (2019). - PMC - PubMed
    1. Levine B., Mizushima N., Virgin H. W., Autophagy in immunity and inflammation. Nature 469, 323–335 (2011). - PMC - PubMed

MeSH terms

Substances

LinkOut - more resources