. 2024 Oct;15(5):1797-1810.
doi: 10.1002/jcsm.13531. Epub 2024 Sep 5.

Neuromuscular impairment at different stages of human sarcopenia

Affiliations

Neuromuscular impairment at different stages of human sarcopenia

Fabio Sarto et al. J Cachexia Sarcopenia Muscle. 2024 Oct.

Abstract

Background: Degeneration of the motoneuron and neuromuscular junction (NMJ) and loss of motor units (MUs) contribute to age-related muscle wasting and weakness associated with sarcopenia. However, these features have not been comprehensively investigated in humans. This study aimed to compare neuromuscular system integrity and function at different stages of sarcopenia, with a particular focus on NMJ stability and MU properties.

Methods: We recruited 42 young individuals (Y) (aged 25.98 ± 4.6 years; 57% females) and 88 older individuals (aged 75.9 ± 4.7 years; 55% females). The older group underwent a sarcopenia screening according to the revised guidelines of the European Working Group on Sarcopenia in Older People 2. In all groups, knee extensor muscle force was evaluated by isometric dynamometry, muscle morphology by ultrasound and MU potential properties by intramuscular electromyography (iEMG). MU number estimate (iMUNE) and blood samples were obtained. Muscle biopsies were collected in a subgroup of 16 Y and 52 older participants.

Results: Thirty-nine older individuals were non-sarcopenic (NS), 31 pre-sarcopenic (PS) and 18 sarcopenic (S). A gradual decrease in quadriceps force, cross-sectional area and appendicular lean mass was observed across the different stages of sarcopenia (for all P < 0.0001). Handgrip force and the Short Physical Performance Battery score also showed a diminishing trend. iEMG analyses revealed elevated near fibre segment jitter in NS, PS and S compared with Y (Y vs. NS and S: P < 0.0001; Y vs. PS: P = 0.0169), suggestive of age-related impaired NMJ transmission. Increased C-terminal agrin fragment (P < 0.0001) and altered caveolin 3 protein expression were consistent with age-related NMJ instability in all the older groups. The iMUNE was lower in all older groups (P < 0.0001), confirming age-related loss of MUs. An age-related increase in MU potential complexity was also observed. These observations were accompanied by increased muscle denervation and axonal damage, evinced by the increase in neural cell adhesion molecule-positive fibres (Y vs. NS: P < 0.0001; Y vs. S: P = 0.02) and the increase in serum concentration of neurofilament light chain (P < 0.0001), respectively. Notably, most of these MU and NMJ parameters did not differ when comparing older individuals with or without sarcopenia.

Conclusions: Alterations in MU properties, axonal damage, an altered innervation profile and NMJ instability are prominent features of the ageing of the neuromuscular system. These neuromuscular alterations are accompanied by muscle wasting and weakness; however, they appear to precede clinically diagnosed sarcopenia, as they are already detectable in older NS individuals.

Keywords: electromyography; fibre denervation; motoneuron; motor units; muscle atrophy; neuromuscular junction.


Conflict of interest statement

The authors have no conflict of interest to declare.

Figures

Figure 1
Figure 1
Muscle function and physical performance parameters across different stages of human sarcopenia. Statistical analysis was performed using two‐way analyses of variance (A–D) and the Kruskal–Wallis test (E). Results are shown as the mean and standard deviation. Knee extensor maximum voluntary contraction (MVC) (A); time needed to reach 63% of the MVC (TTP63%) (B); activation capacity (C); handgrip strength (D); and Short Physical Performance Battery (SPPB) score (E). Three missing values (one NS, one PS and one S) and one outlier excluded (Y; robust regression and outlier removal method with Q = 2%) for activation capacity. NS, non‐sarcopenic; PS, pre‐sarcopenic; S, sarcopenic; Y, young individuals. **P < 0.01; ***P < 0.001.
Figure 2
Figure 2
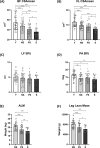
Muscle morphology parameters and lean mass quantification across different stages of human sarcopenia. Statistical analysis was performed using two‐way analyses of variance. Results are shown as the mean and standard deviation. Quadriceps femoris (QF) cross‐sectional area (CSAmean): mean of the values at 30%, 50% and 70% of femur length (A); vastus lateralis (VL) CSAmean (B); VL fascicle length (Lf) at 50% femur length (C); VL pennation angle (PA) at 50% femur length (D); appendicular lean mass (ALM) (E); and leg lean mass (F). NS, non‐sarcopenic; PS, pre‐sarcopenic; S, sarcopenic; Y, young individuals. *P < 0.05; **P < 0.01; ***P < 0.001.
Figure 3
Figure 3
Motor unit potential (MUP) parameters across different stages of human sarcopenia. Statistical analysis was performed using generalized linear mixed models. Results are shown as the estimated marginal mean and standard error. MUP area (A); MUP duration (B); MUP turns (C); and MU mean firing rate (D). NS, non‐sarcopenic; PS, pre‐sarcopenic; S, sarcopenic; Y, young individuals. *P < 0.05; **P < 0.01.
Figure 4
Figure 4
Near fibre (NF) electromyography outcomes across different stages of human sarcopenia. Statistical analysis was performed using generalized linear mixed models. Results are shown as the estimated marginal mean and standard error. NF motor unit potential (MUP) duration (A); NF count (B); and NF MUP (NFM) segment jitter (C). NS, non‐sarcopenic; PS, pre‐sarcopenic; S, sarcopenic; Y, young individuals. *P < 0.05; **P < 0.01; ***P < 0.001.
Figure 5
Figure 5
Circulating biomarker parameters across different stages of human sarcopenia. Statistical analysis was performed using Kruskal–Wallis tests (A–C) and two‐way analyses of variance (D, E). Results are shown as the mean and standard deviation. Blood concentration of C‐terminal agrin fragment (CAF) (A); neurofilament light chain (B); interleukin‐6 (IL‐6) (C); brain‐derived neurotrophic factor (BDNF) (D); and neurotrophin‐4 (NT‐4) (E). For all parameters, data missing for three Y, one NS and one S. Additional missing values are one NS for CAF, one S for BDNF and four NS and one S for NT‐4. One value is out of scale for IL‐6. NS, non‐sarcopenic; PS, pre‐sarcopenic; S, sarcopenic; Y, young individuals. *P < 0.05; **P < 0.01; ***P < 0.001.
Figure 6
Figure 6
Motor unit loss and immunohistochemistry outcomes across different stages of human sarcopenia. Statistical analysis was performed using two‐way analyses of variance (A) and Kruskal–Wallis tests (B, C). Results are shown as the mean and standard deviation. Motor unit number estimate (iMUNE) (A); fibre diameter variability, expressed as coefficient of variation (B); neural cell adhesion molecule (NCAM)‐positive fibre percentage (C); and representative images of young (left panel) and aged (right panel) skeletal muscle fibres cross‐sectional area (stained by laminin in green) and NCAM+ fibres (in red) (D). Two missing values for NCAM and fibre diameter variability (one Y and one PS). Two outlier excluded for iMUNE (one Y and one S; robust regression and outlier removal method with Q = 2%). NS, non‐sarcopenic; PS, pre‐sarcopenic; S, sarcopenic; Y, young individuals. *P < 0.05; **P < 0.01; ***P < 0.001.
Figure 7
Figure 7
Protein levels of some downstream elements of the agrin pathway across different stages of human sarcopenia and representative western blots. Statistical analysis was performed using Kruskal–Wallis tests. Results are shown as the mean and standard deviation. Caveolin 3 (Cav3) (A); docking protein 7 (Dok7) (B); and low‐density lipoprotein receptor‐related protein 4 (Lrp4) (C). The intensity of immunostained bands was normalized to the total protein amount measured from the same membrane stained with Ponceau S staining. Data presented for 11 Y, 21 NS, 19 PS and 8 S. NS, non‐sarcopenic; PS, pre‐sarcopenic; S, sarcopenic; Y, young individuals. *P < 0.05.

References

    1. Larsson L, Degens H, Li M, Salviati L, Il LY, Thompson W, et al. Sarcopenia: aging‐related loss of muscle mass and function. Physiol Rev 2019;99:427–511. - PMC - PubMed
    1. Cruz‐Jentoft AJ, Bahat G, Bauer J, Boirie Y, Bruyère O, Cederholm T, et al. Sarcopenia: revised European consensus on definition and diagnosis. Age Ageing 2019;48:16–31. - PMC - PubMed
    1. Petermann‐Rocha F, Balntzi V, Gray SR, Lara J, Ho FK, Pell JP, et al. Global prevalence of sarcopenia and severe sarcopenia: a systematic review and meta‐analysis. J Cachexia Sarcopenia Muscle 2022;13:86–99. - PMC - PubMed
    1. Hepple RT, Rice CL. Innervation and neuromuscular control in ageing skeletal muscle. J Physiol 2016;594:1965–1978. - PMC - PubMed
    1. Piasecki M, Ireland A, Jones DA, McPhee JS. Age‐dependent motor unit remodelling in human limb muscles. Biogerontology 2016;17:485–496. - PMC - PubMed