. 2024 Sep 18;15(9):838-853.e13.
doi: 10.1016/j.cels.2024.08.002. Epub 2024 Sep 4.

Environmental modulators of algae-bacteria interactions at scale

Affiliations

Environmental modulators of algae-bacteria interactions at scale

Chandana Gopalakrishnappa et al. Cell Syst. .

Abstract

Interactions between photosynthetic and heterotrophic microbes play a key role in global primary production. Understanding phototroph-heterotroph interactions remains challenging because these microbes reside in chemically complex environments. Here, we leverage a massively parallel droplet microfluidic platform that enables us to interrogate interactions between photosynthetic algae and heterotrophic bacteria in >100,000 communities across ∼525 environmental conditions with varying pH, carbon availability, and phosphorus availability. By developing a statistical framework to dissect interactions in this complex dataset, we reveal that the dependence of algae-bacteria interactions on nutrient availability is strongly modulated by pH and buffering capacity. Furthermore, we show that the chemical identity of the available organic carbon source controls how pH, buffering capacity, and nutrient availability modulate algae-bacteria interactions. Our study reveals the previously underappreciated role of pH in modulating phototroph-heterotroph interactions and provides a framework for thinking about interactions between phototrophs and heterotrophs in more natural contexts.

Keywords: algae-bacteria interactions; buffering capacity; ecological interactions; high-throughput microfluidic platform; pH; phototroph-heterotroph interactions.


Conflict of interest statement

Declaration of interests C.G. is currently employed by the Department of Civil and Environmental Engineering, Massachusetts Institute of Technology. Z.L. is currently employed by BillionToOne Inc.

Figures

Figure 1.
Figure 1.. Dependence of algae-bacteria interactions on environmental factors.
Illustration of our hypothesis that diverse interactions between algae and bacteria are altered by a multitude of chemical factors in the environments such as concentration of nutrients, pH, buffering capacity, light level, and temperature.
Figure 2.
Figure 2.. A high-throughput droplet platform for measuring algae-bacteria growth in hundreds of environments.
(A) Setting up the microfluidic chip. Environments (media conditions) varying in the factors - initial pH, buffering capacity, phosphorus concentration, and carbon concentration, are prepared and barcoded using three fluorescent dyes (STAR Methods). After adding the bacteria (brown) and algae (green) independently to each barcoded media, nanoliter droplets of each of the microbes in the barcoded environments are generated. The generated droplets are pooled together and loaded on the microfluidic chip which randomly groups two droplets in each of its microwells. The chip is then imaged for fluorescent barcodes using a widefield fluorescence microscope, to infer the values of the environmental factors in the microwells via image processing (STAR Methods). Following exposure of the chip to an alternating electric field, droplets in the microwells merge to form replicates of bacterial monocultures, algal monocultures, and algae-bacteria cocultures in all combinations of the environments that were present in the initial droplets. The chip is then incubated at 30°C under light 68.5μmolm2s1. (B) Microscopy images of a single microwell showing the growth of algae and bacteria over time. The GFP fluorescence image representing the bacteria (in brown) and the chlorophyll fluorescence image representing the algae (in green) are overlayed in these images. The first image shows the bacteria and the algae in the separate compartments of the well, prior to the merging of the droplets. The later images show the increase in the abundance of the algae and bacteria at 12 h, 21 h, and 45 h. (C) Example growth curves of algae and bacteria in monoculture and coculture in an environmental condition. The images of the chip are analyzed to infer the abundances of the microbes in the microwells over time (STAR Methods). The growth Y of algae and bacteria are then obtained by estimating the increase in their respective abundances at 68 h from their abundances at 0 h (black arrow labeled ”GROWTH (Y)” right panel).
Figure 3.
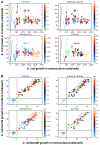
Figure 3.. Complex dependence of algae-bacteria interactions on environmental factors.
(A) Panels show bacterial growth in monoculture (x-axis) and co-culture (y-axis). Each point indicates median growth (Fig. 2C) of E. coli in co-culture and monoculture computed across replicates of each environmental condition. Error bars indicate the standard error of the mean growth. The median number of replicates per environmental condition ranges from 35-70 for the different culture conditions. The dashed line indicates equal growth in monoculture and coculture. Note the fact that all points lie below this line indicating the pervasive inhibition of bacteria by algae. The data in each panel are the same, but the colorbar represents each of the four environmental factors - Initial pH (top left), buffering capacity (top right), phosphorus concentration (bottom left), and carbon concentration (bottom right). The colorbar for phosphorus is logarithmic. The carbon source is glycerol. See Fig. S8 and Fig. S9 for the data in other carbon sources. (B) Identical plots as in (A) but for algal growth in monoculture and co-culture. The fact that most data lie near the dashed line indicates overall weaker impacts on algal growth by bacteria. Negative values of growth correspond to death where the number of cells detected declines from the beginning to the end of the experiment.
Figure 4.
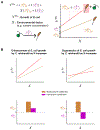
Figure 4.. Quantifying algae-bacteria interactions via regression.
(A) Formulation of the regression model for predicting growth from environmental conditions, here using E. coli as an example. YEc is the growth of E. coli in monocultures and cocultures and X is an environmental factor that determines the growth. The indicator variable I is set to 0 for growth in monoculture and 1 for growth in co-culture. The coefficient βX,MEc represents the change in growth in monoculture with X and is referred to as a monoculture coefficient. The coefficient βX,MEc+βX,IEc represents the change in growth in coculture with X (shown schematically in the plot on the right). Hence, the coefficient βX,IEc represents the change in the effect of X on growth in coculture relative to monoculture. The coefficient βX,IEc is dubbed an interaction coefficient. (B) Illustration of enhancement and suppression of E. coli growth by C. reinhardtii as X increases. The growth of E. coli in monoculture (in brown) and coculture (in red) vs the environmental factor X plotted in the case of enhancement (top left panel) and suppression (top right panel) of E. coli growth by C. reinhardtii as X increases. The panels on the bottom row show the corresponding regression coefficients. The monoculture coefficient βX,MEc (in brown) and interaction coefficient βX,IEc (in magenta) in the case of enhancement (bottom left panel) and suppression (bottom right panel) of E. coli growth by C. reinhardtii as X increases.
Figure 5.
Figure 5.. pH and buffering capacity modulate nutrient dependence of algae-bacteria interactions.
(A) The coefficients for regressions predicting algal and bacterial growth in coculture and monoculture in glycerol. The results for the other carbon sources are shown in Fig. S11 and Fig. S12. The top panel reports the monoculture coefficients βX,MEc (brown bars) and the interaction coefficients βX,IEc (magenta bars) of the corresponding features on the x-axis obtained for the regression model predicting the growth of E. coli in monocultures and cocultures. The interaction coefficients (magenta bars) indicate the effects of C. reinhardtii on E. coli growth with an increase in the corresponding features in coculture. The bottom panel reports the monoculture coefficients βX,MCr (green bars) and the interaction coefficients βX,ICr (cyan bars) of the corresponding features on the x-axis obtained from the regression model predicting the growth of C. reinhardtii in monoculture and coculture. The interaction coefficients (cyan bars) indicate the effects of E. coli on C. reinhardtii growth with an increase in the corresponding features in coculture. The error bars represent the 95% confidence intervals. ** indicates a p-value <0.001 and * a p-value <0.05. (B) Example data illustrating modulation of the effect of carbon concentration on the growth of E. coli by pH and buffering capacity. The median bacterial growth in monoculture and coculture are plotted as a function of carbon concentration at [P]1.51 mM in the left and right panels respectively. The experimental data are represented by circles and connected with dashed lines. The error bars represent the standard error about the mean bacterial growth, with the number of replicates ranging from 14114 for the different conditions. The solid lines represent the model prediction. Darker or thicker lines represent the results at low pH(6.98) and high buffering capacity (2.56mM) and lighter or thinner lines represent the results at high pH (7.34) and low buffering capacity (0.76 mM).
Figure 6.
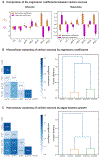
Figure 6.. Effect of environmental factors on algae-bacteria interactions depends on the identity of carbon source
(A) Comparison of the regression coefficients between glucose and galactose. The monoculture coefficients βX,MEc (brown bars) and the interaction coefficients βX,IEc (magenta bars) of the corresponding features on the x-axis obtained from the regression model predicting the growth of E. coli in monocultures and cocultures for glucose (on the left) and galactose (on the right). ** indicates a p-value <0.001 and * a p-value <0.05. (B) Hierarchical clustering of carbon sources by the monoculture and interaction coefficients obtained from the regression models predicting the growth of E. coli and C. reinhardtii. The matrix showing correlations between the regression coefficients of the different carbon sources on the left and the resulting dendrogram from hierarchical clustering based on the correlation matrix on the right (See STAR Methods). (C) Hierarchical clustering of carbon sources by the median growth of algae and bacteria in monocultures and cocultures in all the environmental conditions. The correlation matrix computed for the hierarchical clustering on the left and the resulting dendrogram on the right (See STAR Methods). The colors in the heatmap correspond to the correlation values indicated by the color bar in linear scale, on the right.

References

    1. Mickalide H, and Kuehn S (2019). Higher-Order Interaction between Species Inhibits Bacterial Invasion of a Phototroph-Predator Microbial Community. Cell Systems 9, 521–533.e10. - PubMed
    1. Thompson AW, Foster RA, Krupke A, Carter BJ, Musat N, Vaulot D, Kuypers MMM, and Zehr JP (2012). Unicellular cyanobacterium symbiotic with a single-celled eukaryotic alga. Science 337, 1546–1550. - PubMed
    1. Blanton LV, Charbonneau MR, Salih T, Barratt MJ, Venkatesh S, Ilkaveya O, Subramanian S, Manary MJ, Trehan I, Jorgensen JM, Fan Y-M, Henrissat B, Leyn SA, Rodionov DA, Osterman AL, Maleta KM, Newgard CB, Ashorn P, Dewey KG, and Gordon JI (2016). Gut bacteria that prevent growth impairments transmitted by microbiota from malnourished children. Science 351, aad3311. - PMC - PubMed
    1. Ratzke C, and Gore J (2018). Modifying and reacting to the environmental pH can drive bacterial interactions. PLOS Biology 16, e2004248. - PMC - PubMed
    1. Ilhan ZE, Marcus AK, Kang D-W, Rittmann BE, and Krajmalnik-Brown R (2017). pH-Mediated Microbial and Metabolic Interactions in Fecal Enrichment Cultures. mSphere 2, e00047–17. - PMC - PubMed

MeSH terms

LinkOut - more resources