. 2024 Sep 17;5(9):101706.
doi: 10.1016/j.xcrm.2024.101706. Epub 2024 Sep 4.

Combinatorial targeting of glutamine metabolism and lysosomal-based lipid metabolism effectively suppresses glioblastoma

Affiliations

Combinatorial targeting of glutamine metabolism and lysosomal-based lipid metabolism effectively suppresses glioblastoma

Yaogang Zhong et al. Cell Rep Med. .

Abstract

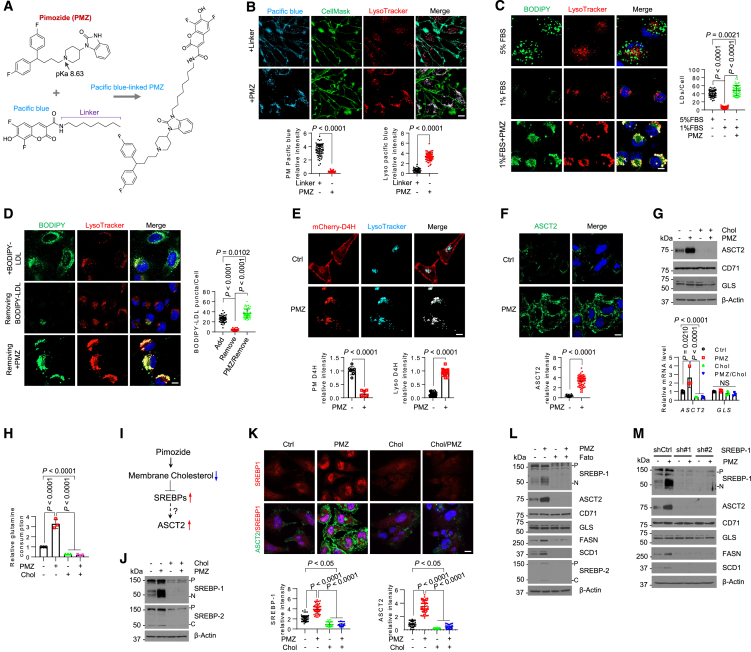
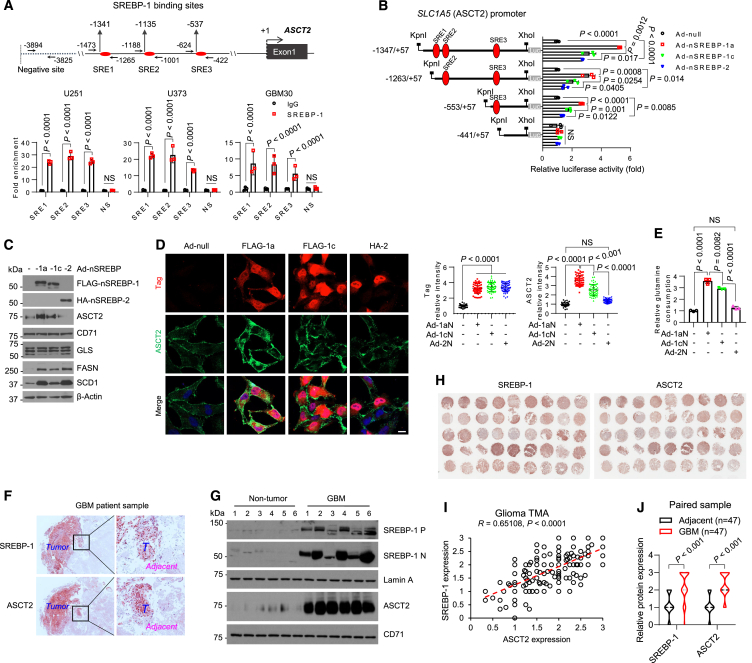
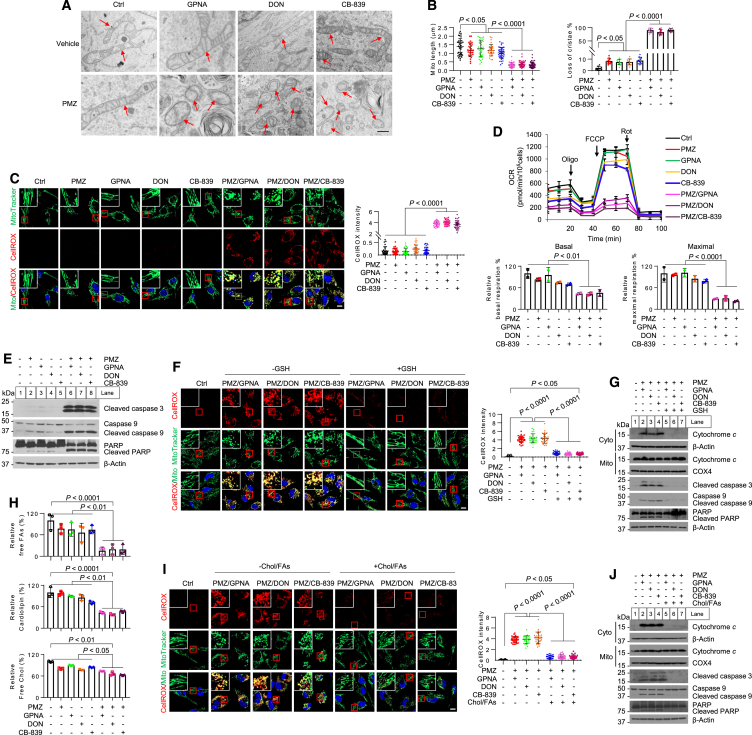
Antipsychotic drugs have been shown to have antitumor effects but have had limited potency in the clinic. Here, we unveil that pimozide inhibits lysosome hydrolytic function to suppress fatty acid and cholesterol release in glioblastoma (GBM), the most lethal brain tumor. Unexpectedly, GBM develops resistance to pimozide by boosting glutamine consumption and lipogenesis. These elevations are driven by SREBP-1, which we find upregulates the expression of ASCT2, a key glutamine transporter. Glutamine, in turn, intensifies SREBP-1 activation through the release of ammonia, creating a feedforward loop that amplifies both glutamine metabolism and lipid synthesis, leading to drug resistance. Disrupting this loop via pharmacological targeting of ASCT2 or glutaminase, in combination with pimozide, induces remarkable mitochondrial damage and oxidative stress, leading to GBM cell death in vitro and in vivo. Our findings underscore the promising therapeutic potential of effectively targeting GBM by combining glutamine metabolism inhibition with lysosome suppression.

Keywords: ASCT2; GLS; SREBP-1; cholesterol; fatty acids; glioblastoma; glutamine; lipid droplets; lysosome; pimozide.


Conflict of interest statement

Declaration of interests The authors declare no competing interests.

Figures

None
Graphical abstract
Figure 1
Figure 1
Pimozide upregulates glutamine metabolism in GBM cells (A) Schematic diagram illustrating the development of GBM colonies for drug treatment. (B and C) Effects of pimozide treatment for 8 days on established U251 cells-derived colonies (n = 3 independent experiments) in DMEM medium containing 1% FBS in the presence and absence of the indicated amino acids (AA) (B) Day 0 indicates the pre-formed colonies before treatment. Colony numbers were quantified by ImageJ and normalized with the number of control cells in a full DMEM medium without drug treatment (mean ± SD, n = 3) (C). Statistical significance was determined by one-way ANOVA with Dunnett’s multiple comparisons adjustments. (D and E) Heatmap of metabolomics analysis of U251 cells supplemented with 13C5-glutamine (2 mM) for 1 h after treatment with pimozide (PMZ, 3 μM) for 24 h (D). The results are from three biological replicates and summarized by the indicated schematic diagram (E). 13C carbons are shown as red circles, and 12C carbons are shown as white circles. Created with BioRender.com. (F–M) Comparison of the abundance of individual metabolites derived from 13C5-glutamine in different metabolic pathways between pimozide-treated and untreated U251 cells (mean ± SD, n = 3). Statistical significance was determined by unpaired Student’s t test or one-way ANOVA with Dunnett’s multiple comparisons adjustments. Metabolomics studies are repeated twice. Results represent one of two independent experiments. See also Figures S1 and S2.
Figure 2
Figure 2
Pimozide acts via SREBP-1 to upregulate the expression of the glutamine transporter ASCT2 to promote glutamine consumption (A) A schematic diagram illustrating the synthesis of Pacific blue-labeled pimozide. Created with ChemDraw. (B) Representative fluorescence imaging of Pacific blue-labeled pimozide (3 μM) vs. Pacific blue with the linker only (3 μM) in U251 cells with co-staining of lysosomes by LysoTracker, plasma membrane by CellMask after treatment for 24 h in 1% FBS. Scale bar, 10 μm. (C and D) Representative fluorescence images of lipid droplets (LDs) stained with BODIPY 493/503 (C) or BODIPY-labeled LDL (D) together with lysosome staining by LysoTracker in U251 cells after pimozide (3 μM) treatment for 24 h in 1%FBS. Scale bar, 10 μm. (E) Representative fluorescence images of the cholesterol-binding probe derived from anaerobic bacteria Perfringolysin O theta toxin domain 4 (D4H) labeled by mCherry (GST-mCherry-D4H) in U251 cells under the same treatment as (C) and (D). The cells were co-stained with LysoTracker. Scale bar, 10 μm. (F) Representative immunofluorescence images of anti-ASCT2 in U251 cells under the same treatment condition as (C) and (D). Nuclei were stained with DAPI. Scale bar, 10 μm. (G) Western blotting analysis of membrane extracts (for ASCT2 and CD71) and total lysates (for GLS) (top) and real-time RT-PCR analysis of their gene expression (bottom) (mean ± SD, n = 3) in U251 cells after treatment with/without pimozide (3 μM) and cholesterol (3 μg/mL) for 24 h. (H) Relative glutamine consumption levels in U251 cells after treatment as G and normalized with control cells (mean ± SD, n = 3). (I) A schematic diagram illustrating the potential mechanism by which ASCT2 expression is upregulated by pimozide. (J) Western blotting analysis of the total lysates of U251 cells after treatment as in panel G. (K) Representative immunofluorescence images of anti-SREBP-1 and anti-ASCT2 in U251 cells after treatment as in (G). Scale bar, 10 μm. (L and M) Western blotting analysis of U251 cells after treatment with/without pimozide (3 μM) and Fatostatin (Fato, 5 μM) for 24 h (L), or after shRNA silencing of SREBP-1 vs. shRNA control (shCtrl) for 48 h following treatment with or without pimozide (3 μM) for another 24 h in 1% FBS condition (M). P, precursor; N, N-terminal form; C, C-terminal form. See also Figures S3 and S4.
Figure 3
Figure 3
SREBP-1 transcriptionally activates SLC1A5 gene expression to promote glutamine consumption (A) The putative SREBP-1 binding sites (SREs) and negative binding site (NS) in the SLC1A5 promoter (top). The arrows show the locations of the designed primers for PCR analysis after immunoglobulin G (IgG) or anti-SREBP-1 antibody-mediated chromatin immunoprecipitation (ChIP) (Bottom). (B) A schematic diagram illustrating the cloning of different fragments of the SLC1A5 promoter in pGL3-luciferase (Luc) reporter plasmid (left) and measuring their activities in U251 cells in response to the expression of different N-terminal SREBP isoforms (right). (C and D) Western blotting (C) and immunofluorescence (D) analysis of U251 cells after adenovirus (Ad)-mediated expression of FLAG- or hemagglutinin (HA)-labeled N-terminal SREBP-1a, -1c, or -2 isoforms for 48 h in 5% FBS condition. Scale bar, 10 μm. (E) Relative glutamine consumption levels in U251 cells after expressing N-terminal SREBP isoforms as in (C) and normalized with control cells (Ad-null) (mean ± SD, n = 3). (F) Immunohistochemistry (IHC) staining of human GBM tumor (T) vs. Adjacent brain tissues. Scale bars, 50 μm. (G) Western blotting analysis of membrane and nucleus lysates of GBM tumor vs. non-tumor brain tissues from patient autopsies (n = 6). (H–J) Representative images of IHC staining of SREBP-1 (left) and ASCT2 (right) (H) and scatterplots of their relative expression (I) in human glioma tissue microarray (TMA, N = 223). The expression levels of SREBP-1 and ASCT2 in paired GBM samples with adjacent brain tissues (J). Experiments from (A–D) were repeated three times. The results represent one of three independent experiments. Statistical significance for (A, B, D, E, and J) were determined by one-way ANOVA with Dunnett’s multiple comparisons adjustments. See also Figure S5 and Table S1.
Figure 4
Figure 4
Pimozide activates SREBP-1/glutamine uptake feedforward loop that promotes GBM resistance (A) This schematic diagram illustrates the proposed model of a potential feedforward loop activated by pimozide, leading to the development of GBM resistance. It also highlights the potential efficacy of pharmacological targeting of ASCT2 or GLS in combination with pimozide in effectively eliminating tumor cells. (B) Nessler’s staining of ammonia (dark brown dots) in U251 cells after treatment with or without pimozide (3 μM), GPNA (1 mM), CB-839 (100 nM), or DON (10 μM) alone or combination for 24 h in 1% FBS. Ammonia dots were quantified by ImageJ from 30 cells (mean ± SD) and normalized with total cell areas (right). Scale bar, 100 μm. (C–E) Western blotting analysis of U251 cells under the same treatment condition as in (B) in the presence or absence of glutamine (4mM) (E) or ammonia solution (NH4OH) (4 mM). (F) Combination treatment effects of pimozide (PMZ) with GPNA, DON, CB-839, or Fatostatin (Fato) at indicated doses (48 h) on GBM U251 cell viabilities. Values in each block represent the mean cell viability inhibition with SD (n = 3). (G) Three-dimensional (3D) plot showing the Loewe synergy score of pairwise dose combinations as shown in (F) in U251 cells. z axis, synergy score; x/y axis, drug combination with different doses. (H and I) Effects of drug treatment as in B for 8 days on GBM cells-derived colonies in 1% FBS (H). Colony numbers were quantified by ImageJ and normalized with untreated cells (I). See also Figures S6 and S7.
Figure 5
Figure 5
Inhibition of glutamine consumption synergizes with pimozide to induce mitochondrial damage and oxidative stress that blunts GBM cell growth (A and B) Representative transmission electron microscopy (TEM) images of the mitochondria in U251 cells after treatment (A). Scale bar, 500 nm. Red arrows indicate mitochondria. Over 30 mitochondria were quantified (mean ± SEM) (B). (C) Representative fluorescence images of U251 cells stained with MitoTracker and CellROX Deep Red after treatment as (A). CellROX-positive signals were quantified by ImageJ in more than 30 cells (mean ± SEM) (right). Scale bar, 10 μm. (D) Oxygen consumption rate (OCR) measured by Seahorse XF24 in U251 cells after treatment as (A) (top, mean ± SD, n = 3). Oligo, oligomycin; FCCP, carbonyl cyanide 4-trifluoromethoxy-phenylhydrazone; Rot, rotenone. Relative basal and maximal respiration was normalized with the untreated control cells (bottom). (E) Western blotting analysis of U251 cells after treatment as in (A) for 48 h. (F) Representative fluorescence images of U251 cells stained with MtioTracker and CellROX Deep Red after treatment as in (A) in the presence or absence of GSH (3 mM) for 24 h. Scale bar, 10 μm. CellROX-positive signals were quantified by ImageJ in over 30 cells (mean ± SEM) (right). Scale bar, 10 μm. (G) Western blotting analysis of the cytosol (Cyto), mitochondrial (Mito), and total lysates of U251 cells after treatment as in (A) for 48 h. (H) Relative free FA, cardiolipin, and free cholesterol levels in U251 cells after treatment as in (A). (I) Representative fluorescence images of U251 cells stained with MitoTracker and CellROX Deep Red after treatment as in (A) in the presence or absence of the mixture of cholesterol (3 μg/mL) and FAs (palmitate: 20 μM, oleic acid: 20 μM, palmitoleic acid: 5 μM). CellROX-positive signals were quantified by ImageJ in over 30 cells (mean ± SEM) (right). Scale bar, 10 μm. (J) Western blotting analysis of U251 cells after treatment as in (A) for 48 h. Experiments except TEM (A, twice) were repeated three times. The results were representatives of one of three (two) independent experiments. Statistical significance for all the results was determined by one-way ANOVA with Dunnett’s multiple comparisons adjustments. See also Figures S8 and S9.
Figure 6
Figure 6
Combining an inhibitor of glutamine uptake or its consumption with pimozide synergistically suppresses tumor growth in GBM xenografts and patient-derived organoids (A–D) Tumor growth curve of GBM30-derived subcutaneous xenografts (n = 6, mean ± SD) treated with pimozide (15 mg/kg/day, intraperitoneal [i.p.]) in combination with or without GPNA (60 mg/kg/day, i.p.), CB-839 (20 mg/kg/day, i.p.) (A), or Fatostatin (20 mg/kg/day, i.p.) (C) for 14 days. Tumors were imaged after 14 days treatment and weighed (B and D). (E) Schematic diagram illustrating the development of GBM patient-derived organoids for drug treatment. Created with BioRender.com. (F) Representative imaging of GBM organoids derived from 3 patients stained with Hoechst33342 (blue, nuclei), Calcein-AM (green, live cells), and propidium iodide (PI, red, dead cells) after treatment with pimozide (PMZ, 3 μM), GPNA (1 mM), DON (10 μM), CB-839 (100 nM), or Fatostatin (Fato, 5 μM) alone or combination for 3 days. BF, bright field. PI intensity was quantified by ImageJ in ≥10 organoids derived from each patient (mean ± SD). (G) Representative bright-field images (top), size, and viabilities (bottom) of GBM organoids after treatments as (F) for 10 days. The maximum length of organoids was measured by ImageJ (size). Viabilities of organoids were measured by CellTiter-Glo luminescent cell viability assay. Biological statistic for all the results in Figure 6 was examined by one-way ANOVA with Dunnett’s multiple comparisons adjustments. See also Figures S10–S12.
Figure 7
Figure 7
Combining inhibition of glutamine metabolism with pimozide significantly suppresses tumor growth in orthotopic GBM models (A) A schematic diagram outlining the treatment schedule for a GBM30-derived orthotopic xenograft model by pimozide (25 mg/kg/day, intraperitoneal [i.p.]), GPNA (60 mg/kg/day, i.p.), CB-839 (20 mg/kg/day, i.p.), or Fatostatin (20 mg/kg/day, i.p.) alone or in combination. (B) Representative magnetic resonance imaging (MRI) of female mouse brains from the GBM30-derived orthotopic models after treatment as outlined in (A) for 12 days. The tumor border was outlined by a pink circle (left). Tumor volume was quantified by ITK-SNAP (Version 3.8.0) (right). (C and D) Kaplan-Meier plot analysis of overall survival in GBM-bearing mice, in both female and male mice (n = 7/each sex) after treatment as outlined in (A). Significance was determined by a log rank test. NS, not significant. (E) Representative IHC (proteins) and Nessler’s (ammonia, dark brown dots) staining images of the intracranial GBM30-derived tumors isolated from the mice at the indicated days (endpoint) after treatment as outlined in (A). Six separate areas from each tumor were quantified by ImageJ (mean ± SEM, n > 1,000 cells) (right). Scale bars, 50 μm for IHC. 100 μm for ammonia staining. (F–H) A schematic diagram outlining the treatment schedule for a GBM30-derived orthotopic xenograft model (female) by pimozide, GPNA, CB-839, or Fatostatin alone or in combination with radiation (F). Representative MRI images of mouse brains from the GBM30-derived orthotopic models (n = 7) after treatment for 12 days (G). Mouse overall survival was analyzed by Kaplan-Meier plot (H). Significance was determined by a Log rank test. Statistical significance from (B–G) was determined by one-way ANOVA with Dunnett’s multiple comparisons adjustments. See also Figures S12 and S13.

References

    1. Cloughesy T.F., Cavenee W.K., Mischel P.S. Glioblastoma: from molecular pathology to targeted treatment. Annu. Rev. Pathol. 2014;9:1–25. doi: 10.1146/annurev-pathol-011110-130324. - DOI - PubMed
    1. Bagley S.J., Kothari S., Rahman R., Lee E.Q., Dunn G.P., Galanis E., Chang S.M., Nabors L.B., Ahluwalia M.S., Stupp R., et al. Glioblastoma Clinical Trials: Current Landscape and Opportunities for Improvement. Clin. Cancer Res. 2022;28:594–602. doi: 10.1158/1078-0432.CCR-21-2750. - DOI - PMC - PubMed
    1. Horbinski C., Berger T., Packer R.J., Wen P.Y. Clinical implications of the 2021 edition of the WHO classification of central nervous system tumours. Nat. Rev. Neurol. 2022;18:515–529. doi: 10.1038/s41582-022-00679-w. - DOI - PubMed
    1. Matteoni S., Matarrese P., Ascione B., Buccarelli M., Ricci-Vitiani L., Pallini R., Villani V., Pace A., Paggi M.G., Abbruzzese C. Anticancer Properties of the Antipsychotic Drug Chlorpromazine and Its Synergism With Temozolomide in Restraining Human Glioblastoma Proliferation In Vitro. Front. Oncol. 2021;11 doi: 10.3389/fonc.2021.635472. - DOI - PMC - PubMed
    1. Aras Y., Erguven M., Aktas E., Yazihan N., Bilir A. Antagonist activity of the antipsychotic drug lithium chloride and the antileukemic drug imatinib mesylate during glioblastoma treatment in vitro. Neurol. Res. 2016;38:766–774. doi: 10.1080/01616412.2016.1203096. - DOI - PubMed

MeSH terms

LinkOut - more resources