. 2024 Nov 12;57(11):2634-2650.e5.
doi: 10.1016/j.immuni.2024.08.008. Epub 2024 Sep 4.

Inhibitory co-receptor Lag3 supports Foxp3+ regulatory T cell function by restraining Myc-dependent metabolic programming

Affiliations

Inhibitory co-receptor Lag3 supports Foxp3+ regulatory T cell function by restraining Myc-dependent metabolic programming

Dongkyun Kim et al. Immunity. .

Abstract

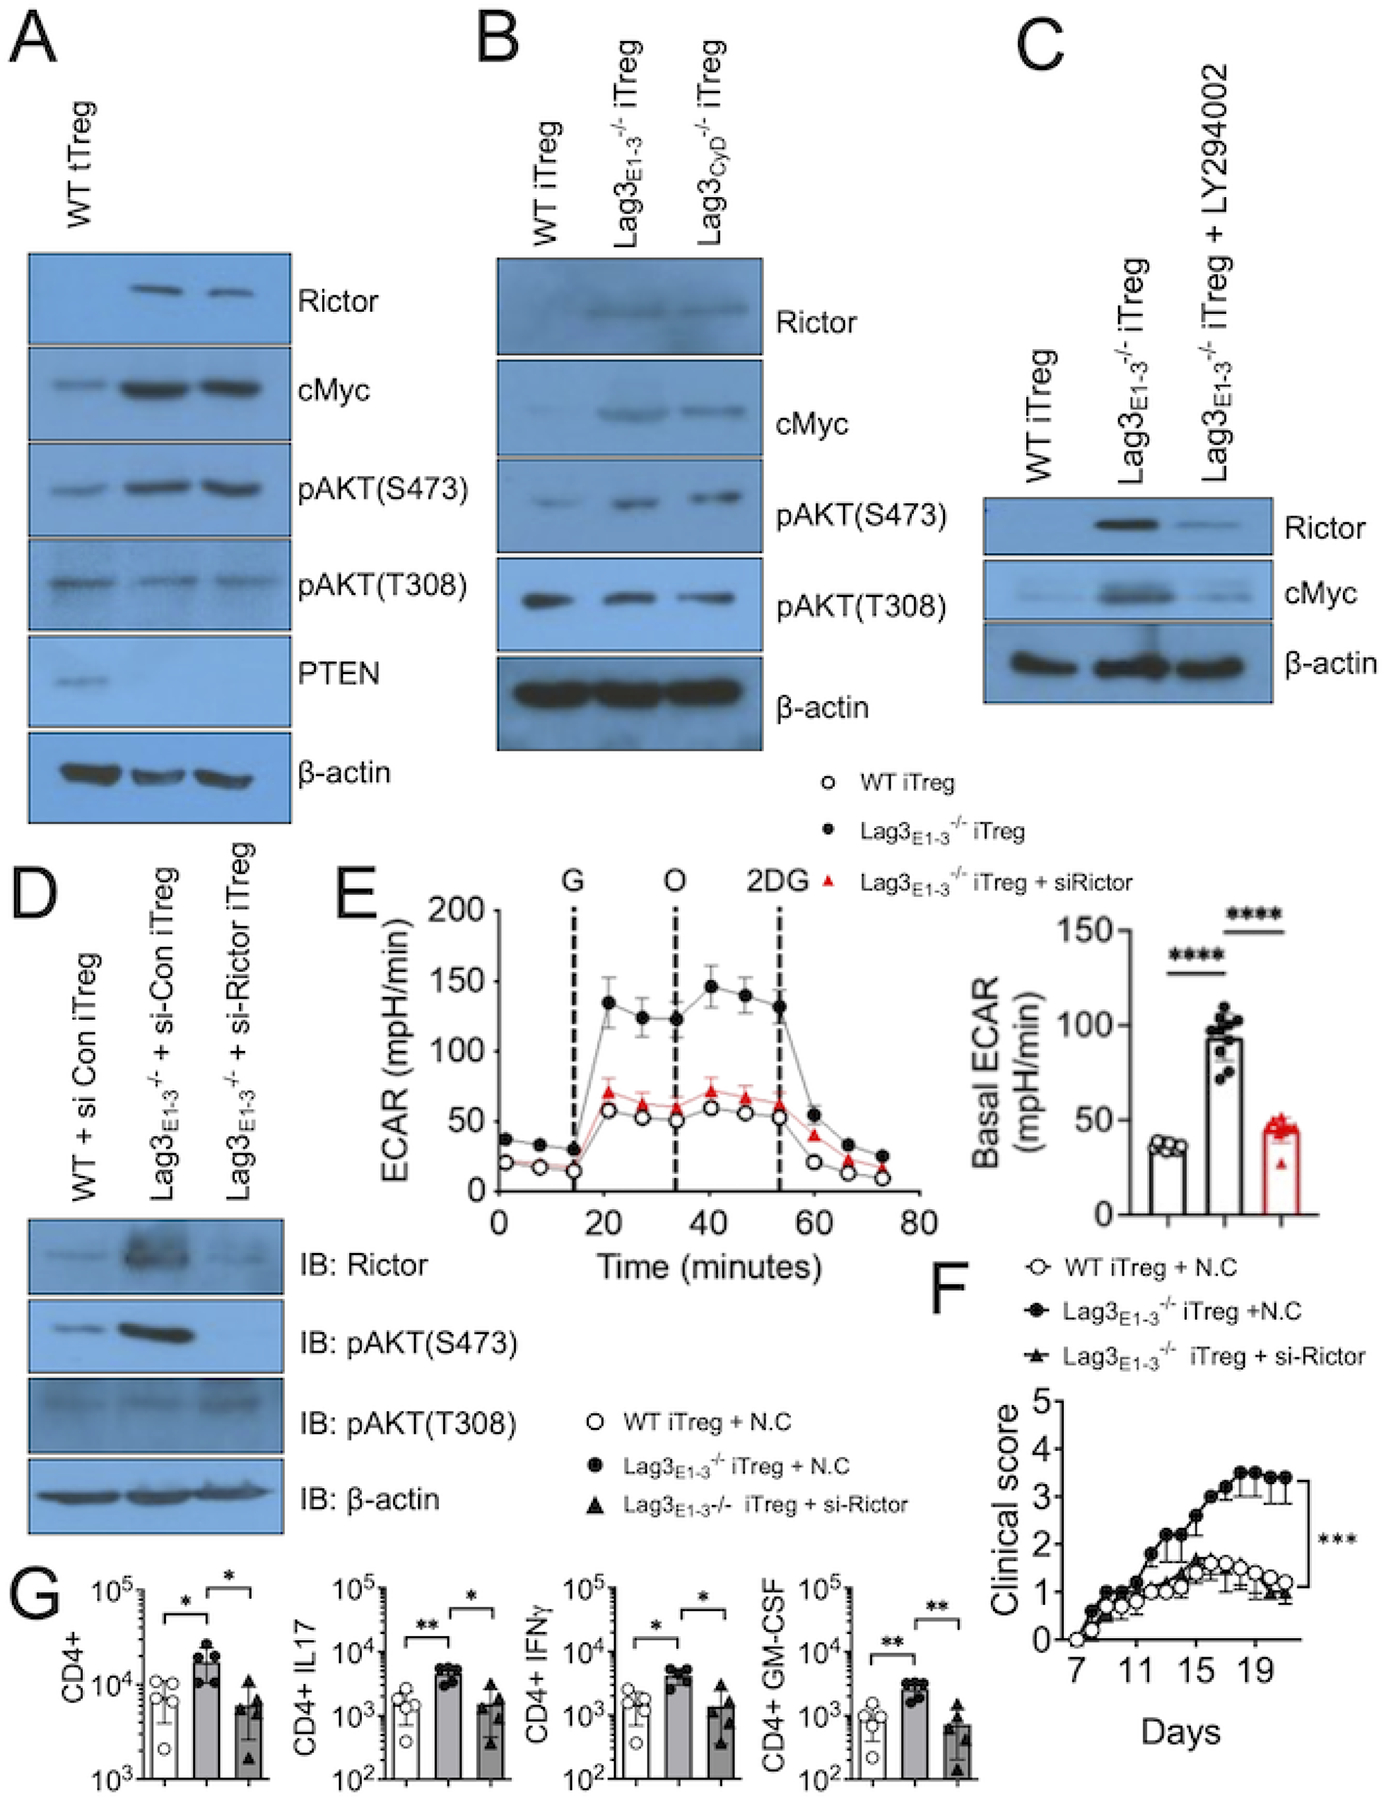
Lymphocyte activation gene 3 (Lag3) is an inhibitory co-receptor expressed on activated T cells and has been proposed to regulate regulatory T (Treg) cell function. However, its precise modality and mechanisms remain elusive. We generated Treg cell-specific Lag3-mutant mouse models and found that Lag3 was essential for Treg cell control of autoimmunity. RNA sequencing analysis revealed that Lag3 mutation altered genes associated with metabolic processes, especially Myc target genes. Myc expression in Lag3-mutant Treg cells was increased to the level seen in conventional T helper (Th)1-type effector cells and directly correlated with their metabolic profiles and in vivo suppressive functions. The phosphatidylinositol 3-kinase (PI3K)-Akt-Rictor pathway was activated in Lag3-mutant Treg cells, and inhibiting PI3K, Rictor, or lactate dehydrogenase A (Ldha), a key Myc target enzyme converting pyruvate to lactate, was sufficient to restore normal metabolism and suppressive function in Lag3-mutant Treg cells. These findings indicate that Lag3 supports Treg cell suppression partly by tuning Myc-dependent metabolic programming.

Keywords: Lag3; Myc; Treg cells; autoimmunity; metabolism.


Conflict of interest statement

Declaration of interests J.C. is a founder and shareholder in Moonlight Bio.

Figures

Figure 1.
Figure 1.. EAE development is more severe in Treg cell-specific Lag3E1–3-deficient mice.
(A) Representative EAE scores of TregΔLag3E1−3 or TregWT mice (n=9–10). (B) Total number of CNS-infiltrating CD4+ and CD4+Foxp3+ Treg cells at the peak of disease (day 14 postimmunization). (C) The mean fluorescence intensity (MFI) of ICOS, CD25 and GITR on CD4+Foxp3+ Treg cells in the CNS at the peak of disease. (D) Frequencies of eTreg (CD44high) or cTreg (CD44int) cells. Ratio of eTreg and cTreg cells. (E) Frequencies and absolute numbers of IFNγ, IL-17 and GM-CSF expressing CD4+ T cells infiltrating the CNS at the peak of disease. Each symbol represents individually tested mouse. (F and G) RNA extracted from individual spinal cord of EAE-induced TregΔLag3E1−3, TregWT or non EAE-induced (Naïve) mice at the peak of the disease were analyzed for the indicated cytokine and chemokine genes by qPCR. The results are from three independent experiments. (H) Foxp3DTR mice (n=5) were induced with EAE and treated with Diphtheria toxin (DTx) day 7, 8 post induction. 1×10⁶ cells/ml of WT or Lag3E1–3−/− tTreg cells were transferred on day 10 postimmunization. The mice were scored for clinical diseases. (I) Quantification of tumor volumes (mm3) in TregΔLag3E1−3 and TregWT mice following B16 implantation. n = 6–8. The results shown are the mean ± SD of individually tested mice (A-E) or a representative (F-I) of two independent experiments. *p < 0.05, **p < 0.01, ***p < 0.001, ****p < 0.0001 as determined by Mann Whitney nonparametric test or by two-way ANOVA test.
Figure 2.
Figure 2.. Metabolic gene expression profiles are pronounced in Lag3E1–3-deficient Treg cells.
(A-F) EAE was induced in TregΔLag3E1−3 or TregWT mice by immunization with MOG35–55 in CFA as previously described. Treg cells were isolated from the CNS at the peak of the disease and subjected to RNAseq analysis. (A) Principal component analysis of Lag3E1–3−/− or WT Treg cells. (B) Volcano plot representing differentially expressed genes between Lag3E1–3−/− or WT Treg cells (n = 4, Log2 fold change >1; adjusted p-value <0.05). (C) Gene ontology (GO) analysis biology processes that are associated with genes upregulated in Lag3E1–3−/− Treg cells. (D) Enriched pathways in Lag3E1–3−/− or WT Treg cells from Gene Set Enrichment Analysis (GSEA). (E) GSEA analysis of the Myc targets pathway in Lag3E1–3−/− Treg cells. (F) Heatmap representing glycolysis-associated gene expression between Lag3E1–3−/− or WT Treg cells. (G) FACS sorted tTreg cells were cultured with the Dynabeads for 3 days. Myc expression was analyzed by western blotting. (H) Myc mRNA expression was measured at the indicated time points. (I) Extracellular acidification rate (ECAR) of WT and Lag3E1–3−/− tTreg cells measured by Seahorse. (J) Oxygen consumption rate (OCR) of WT and Lag3E1–3−/− tTreg cells measured by Seahorse. The results shown are the mean ± SD of individually tested mice from at least two independent experiments. *p < 0.05, **p < 0.01, ***p < 0.001 as determined by Mann-Whitney nonparametric test.
Figure 3.
Figure 3.. Myc regulates metabolic reprogramming in Treg cells.
(A-D) Naïve CD4+ T cells from Lag3E1–3−/− or WT mice were transduced with lenti-EV or lenti-sgRNA Myc virus and activated under Treg cell-polarizing condition for 3 days. (A) Myc protein expression was determined by western blot analysis. (B) ECAR and OCR of WT and Lag3E1–3−/− iTreg cells with or without Myc knockdown measured by Seahorse. (C) 2×10⁶ FACS-sorted CD45.1+ iTreg cells were transferred i.v. into Foxp3DTR mice that were induced for EAE and treated with DTx as described above. The mice were scored for EAE severity. (D) Draining LN cells were harvested 5 days post iTreg cell transfer. Total LN cell numbers, percentage, proportion of Foxp3 exTreg cells, Myc and Foxp3 expression, and proliferative activity (Ki67) of CD45.1+CD4+ iTreg cells were examined by flow cytometry. (E-H) Naïve CD4 T cells from WT mice were nucleofected with pMXs-cMyc plasmid (Myc overexpression) and stimulated under Treg cell-polarizing conditions. (E) Representative western blots of Myc protein. (F) ECAR and OCR of iTreg cells with or without Myc overexpression measured by Seahorse. (G) Control or Myc overexpressing WT iTreg cells (CD45.1+) were transferred on day 10 postimmunization as above. The mice were scored for clinical diseases. (H) Draining LN cells were harvested 5 days post iTreg cell transfer. Total LN cell numbers, percentage, proportion of Foxp3 exTregs, Myc and Foxp3 expression, and proliferative activity (Ki67) of CD45.1+CD4+ iTreg cells were examined by flow cytometry. The results shown are the mean ± SD of individually tested mice from two independent experiments. *p < 0.05, **p < 0.01, ***p<0.001, ****p < 0.0001 as determined by Mann-Whitney nonparametric test.
Figure 4.
Figure 4.. Absent of Lag3 cytoplasmic domain on Treg cells exacerbates EAE by modulates Myc expression.
(A) Generation of Treg cell-specific Lag3 cytoplasmic domain (exon 8) mutant mice by the Cre-loxP system. (B) Genomic DNA was extracted from FACS-sorted CD4+Foxp3 T cells (Tcon) and CD4+Foxp3+ Treg cells from TregΔLag3CyD or TregWT mice. Exon specific qPCR was performed. Exon 8 amplification was normalized to the control exon 3. (C) EAE disease score of TregWT or TregΔLag3CyD mice (n=10). (D) Absolute numbers of CD4+ and CD4+Foxp3+ cells in the CNS at the peak of disease. (E) Proportion of eTreg (CD44high) or cTreg (CD44int) cells and the ratio of eTreg to cTreg cells. (F) The mean fluorescence intensity (MFI) of ICOS, CD25 and GITR on CD4+Foxp3+ Treg cells in the CNS at the peak of disease. (G) Proportion and absolute numbers of IFNγ, IL-17 and GM-CSF expressing CD4+ T cells infiltrating the CNS at the peak of disease. (H) TregWT or TregΔLag3CyD mice were induced for EAE. CD4+ Foxp3+ Treg cells was flow cytometry sorted from the CNS at the peak of the disease. RNA was isolated from the sorted cells and evaluated for gene expression by qPCR. (I and J) Basal ECAR and OCR of WT and Lag3CyD−/− tTreg cells measured by Seahorse. The results shown are the mean ± SD of two independent experiments. *p < 0.05, **p < 0.01, ***p < 0.001, ****p < 0.0001 as determined by Mann-Whitney nonparametric test.
Figure 5.
Figure 5.. Lag3 controls Treg cell function via PI3K-Myc pathways.
(A) GSEA analysis of the PI3K-Akt-mTORC signaling pathway in Treg cells from TregΔLag3E1−3 and TregWT mice with EAE. (B) ECAR of WT, Lag3E1–3−/−, and Lag3CyD−/− tTreg cells with or without LY294002 treatment measured by Seahorse. (C-G) Naïve CD4+ T cells isolated from Lag3E1–3−/−, Lag3CyD−/− and wild type control mice were activated under Treg cell-polarizing conditions w/wo LY294002 for 24h. (C) Myc expression was analyzed by western blot analysis. (D and E) Foxp3DTR mice (n=10) were induced with EAE and treated with Diphtheria toxin (DTx) day 7, 8 post induction. 2×10⁶ cells indicated iTreg cells were transferred on day 10 postimmunization. The mice were scored for clinical diseases. (F and G) Total number of IFNγ, IL-17 and GM-CSF expressing CD4+ T cells infiltrating the CNS at the peak of disease. The results shown are the mean ± SD of individually tested mice from two independent experiments. **p < 0.01, ***p < 0.001, ****p < 0.0001 as determined by Mann-Whitney nonparametric test.
Figure 6.
Figure 6.. Lag3 regulates Rictor expression in Treg cells.
(A) tTreg (CD4+Foxp3+) cells were sorted from lymph nodes T cells in Lag3E1–3−/−, Lag3CyD−/− and littermate control mice and stimulated with dynabeads. Rictor, Myc, pAKT (S473 and T308) and PTEN expression were examined by western blot analysis. Relative expression was determined based on the β-actin expression. (B) Naïve CD4+ T cells isolated from Lag3E1–3−/−, Lag3CyD−/− and control mice were activated under Treg cell-polarizing conditions. Rictor, Myc and pAKT(S473 and T308) expression was determined by western blot analysis. (C) Myc and Rictor expression was analyzed by western blot analysis. (D) Naïve CD4+ T cells from LN of Lag3E1–3−/− or control mice nucleofected with control or si-Rictor were activated under Treg cell-polarizing condition for 3 days. Indicated protein expression was determined by western blot analysis. (E) ECAR of WT and Lag3E1–3−/− iTreg cells with or without si-Rictor nucleofection measured by Seahorse. (F) Foxp3DTR mice were induced for EAE and treated with Diphtheria toxin as above. Control or si-Rictor nucleofected iTreg cells were transferred, and EAE development was compared. (G) Total number of CNS-infiltrating CD4+ T cells were enumerated at the peak of the disease. The results shown are a representative of two independent experiments. *p < 0.05, **p < 0.01, ****p < 0.0001 as determined by Mann-Whitney nonparametric test.
Figure 7.
Figure 7.. Myc-dependent Ldha activity alters Lag3-deficient Treg cell functions.
(A) Expression of Ldha in WT and Lag3E1–3−/− iTreg cells was measured by qPCR analysis. (B) Lactate secreted by WT and Lag3E1–3−/− iTreg cells in media. (C) Relative ratio of NAD+ to NADH in WT and Lag3E1–3−/− iTreg cells. (D) ECAR of WT, Lag3E1–3−/−, and Lag3CyD−/− tTreg cells with or without FX11 treatment measured by Seahorse. (E-H) Naïve CD4+ T cells isolated from Lag3E1–3−/− and WT mice were stimulated under Treg cell-polarizing conditions, and FX11 was added to the culture during the last 6 hours. (E) Myc and pAKT (S473 and T308) expression from the indicated cells was determined by western blot analysis. (F) Wild type, Lag3E1–3−/−, or Lag3E1–3−/− iTreg cells treated with FX-11 were adoptively transferred into Treg cell-depleted Foxp3DTR mice (n=10) with EAE as described above. EAE development was monitored. (G) Absolute numbers of IFNγ, IL-17, and GM-CSF expressing CD4+ T cells infiltrating the CNS at the peak of disease. (H) Ldha, Myc and pAKT (S473 and T308) expression from wild type or Lag3E1–3−/− Treg cells nucleofected with si-con or si-Ldha vector was determined by western blot analysis. (I) Basal ECAR of WT and Lag3E1–3−/− iTreg cells with or without si-LDHA nucleofection measured by Seahorse. (J) Naïve CD4 T cells from Lag3E1–3−/− and WT mice were transduced with lenti-EV or lenti-sgRNA Ldha virus and stimulated under Treg cell-polarizing condition. Treg cells were transferred into Treg cell-depleted Foxp3DTR mice (n=10) on day 10 post immunization as described above. (K) Total number of IFNγ, IL-17 and GM-CSF expressing CD4+ T cells infiltrating the CNS at the peak of disease. The results shown are the mean ± SD of individually tested mice from two independent experiments. *p < 0.05, **p < 0.01, ***p < 0.001, ****p < 0.0001 as determined by Mann-Whitney nonparametric test.

References

    1. Sakaguchi S, Yamaguchi T, Nomura T, and Ono M (2008). Regulatory T cells and immune tolerance. Cell 133, 775–787. 10.1016/j.cell.2008.05.009. - DOI - PubMed
    1. Vignali DA, Collison LW, and Workman CJ (2008). How regulatory T cells work. Nat Rev Immunol 8, 523–532. 10.1038/nri2343. - DOI - PMC - PubMed
    1. Kornete M, Sgouroudis E, and Piccirillo CA (2012). ICOS-dependent homeostasis and function of Foxp3+ regulatory T cells in islets of nonobese diabetic mice. J Immunol 188, 1064–1074. 10.4049/jimmunol.1101303. - DOI - PubMed
    1. Lohning M, Hutloff A, Kallinich T, Mages HW, Bonhagen K, Radbruch A, Hamelmann E, and Kroczek RA (2003). Expression of ICOS in vivo defines CD4+ effector T cells with high inflammatory potential and a strong bias for secretion of interleukin 10. J Exp Med 197, 181–193. 10.1084/jem.20020632. - DOI - PMC - PubMed
    1. Busse M, Krech M, Meyer-Bahlburg A, Hennig C, and Hansen G (2012). ICOS mediates the generation and function of CD4+CD25+Foxp3+ regulatory T cells conveying respiratory tolerance. J Immunol 189, 1975–1982. 10.4049/jimmunol.1103581. - DOI - PubMed

Publication types

MeSH terms

LinkOut - more resources