. 2024 Nov:89:102025.
doi: 10.1016/j.molmet.2024.102025. Epub 2024 Sep 3.

Hunger signalling in the olfactory bulb primes exploration, food-seeking and peripheral metabolism

Affiliations

Hunger signalling in the olfactory bulb primes exploration, food-seeking and peripheral metabolism

Romana Stark et al. Mol Metab. 2024 Nov.

Abstract

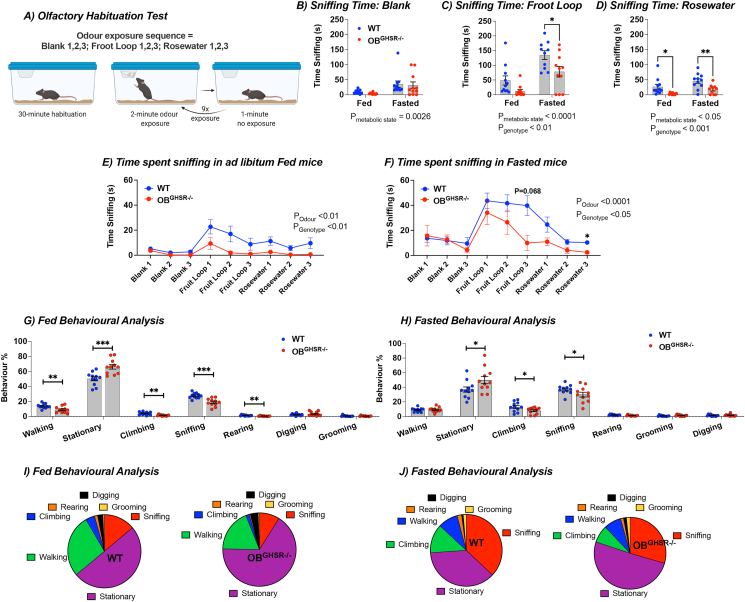
Objective: Although the metabolic state of an organism affects olfactory function, the precise mechanisms and their impact on behavior and metabolism remain unknown. Here, we assess whether ghrelin receptors (GHSRs) in the olfactory bulb (OB) increase olfactory function and influence foraging behaviors and metabolism.

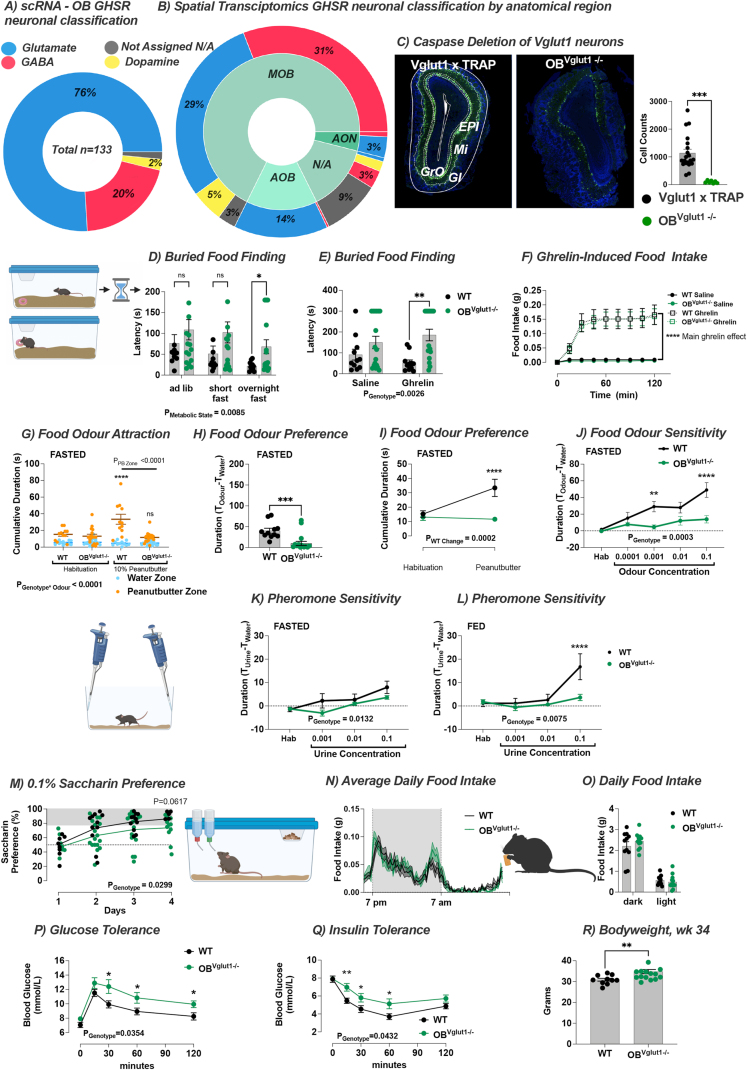
Methods: We performed a detailed behavioural and metabolic analysis in mice lacking GHSRs in the OB (OBGHSR deletion). We also analsyed OB scRNA-seq and spatial transcriptomic datasets to assess GHSR+ cells in the main and accessory olfactory bulbs, as well as the anterior olfactory nucleus.

Results: OBGHSR deletion affected olfactory discrimination and habituation to both food and non-food odors. Anxiety-like and depression-like behaviors were significantly greater after OBGHSR deletion, whereas exploratory behavior was reduced, with the greatest effect under fasted conditions. OBGHSR deletion impacted feeding behavior as evidenced by altered bout number and duration, as well as buried food-seeking. OBGHSR deletion increased body weight and fat mass, spared fat utilisation on a chow diet and impaired glucose metabolism indicating metabolic dysfunction. Cross referenced analysis of OB scRNA-seq and spatial transcriptomic datasets revealed GHSR+ glutamate neurons in the main and accessory olfactory bulbs, as well as the anterior olfactory nucleus. Ablation of glutamate neurons in the OB reduced ghrelin-induced food finding and phenocopied results seen after OBGHSR deletion.

Conclusions: OBGHSRs help to maintain olfactory function, particularly during hunger, and facilitate behavioral adaptations that optimise food-seeking in anxiogenic environments, priming metabolic pathways in preparation for food consumption.

Keywords: Anxiety; Ghrelin; Glutamate; Hunger; Metabolism; Olfaction; Olfactory bulb; Transcriptomics.


Conflict of interest statement

Declaration of competing interest J.M.Z. receives research funding from Novo Nordisk for another project and consulted for Helsinn Healthcare S.A. and Dexcel Pharma Technologies Ltd. during the time these studies were performed. The other authors have nothing to disclose. All other authors report no conflict of interest.

Figures

Image 1
Graphical abstract
Figure 1
Figure 1
GHSR expression in the olfactory bulb during different metabolic conditions and after deletion. A) GHSR mRNA expression in the olfactory bulb and hypothalamus changes during fed (n = 7/7), fasted (n = 11/15) and refed (n = 5/6) conditions. B) Confirmation of GHSR deletion in the olfactory bulb; schematic created with BioRender.com. Deletion efficacy after viral Cre recombination in the GHSR floxed::Ai14 RFP model was confirmed by Western blot analysis. Protein GHSR expression intensities of 3 blots (top, WT = 13, OBGHSR−/− = 12) were normalized to corresponding actin. Representative blot (below). C) Immunohistochemistry for confirmation of injection site. Cre recombinase immunoreactivity (green) and cre-mediated expression of red fluorescence protein (RFP, red) was used to visualise the viral spread in the olfactory bulb ranging from bregma 4.28 to 2.68, in both OBGHSR−/− and WT respectively. AOD anterior olfactory nucleus, dorsal part; AOE anterior olfactory nucleus, external part; AOL anterior olfactory nucleus, lateral part; AOM anterior olfactory nucleus, medial part; AOV anterior olfactory nucleus, ventral part; EPI external plexiform layer of the olfactory bulb; E/OV ependymal and subendymal layer/olfactory ventricle; Gl glomerular layer; GrA granular cell layer of the accessory olfactory bulb; GrO granular cell layer of the olfactory bulb; Mi mitral cell layer of the olfactory bulb. Data are presented as mean +/− SEM. All specific statistical information is reported in supplementary table 1.
Figure 2
Figure 2
Reduced olfactory performance after OBGHSRdeletion in olfactory habituation test. A) Schematic of the olfactory habituation task created with BioRender.com. Mice were acclimatised to testing conditions for 30 min, then exposed to an odor for 3 consecutive times for 2 min each separated by 1 min (WT = 11, OBGHSR−/− = 11). Odor was presented on filter paper inside an Eppendorf tube with a perforated lid. B-D) Sniffing time fed versus fasted (B) Blank (Two-way ANOVA, Pmetabolic state = 0.0026, Pgenotype = 0.5631), (C) Froot Loop (Two-way ANOVA, Pmetabolic state<0.0001, Pgenotype = 0.0024), (D) Rosewater (Two-way ANOVA, Pmetabolic state = 0.0145, Pgenotype = 0.0005). E-F) Time spent sniffing in (E) ad libitum fed condition across the 3 different odor exposures (Two-way ANOVA, Podor = 0.0026, Pgenotype = 0.0036), versus (F) fasted condition (Two-way ANOVA, Podor<0.0001, Pgenotype = 0.0482, Podor∗genotype = 0.0595). G-H) Behavioral analysis during the olfactory habituation test in (G) fed, versus (H) fasted condition, combined for foot loop and rosewater trials (6 trials per mouse). Behavioral differences were observed in exploratory behaviors, such as walking, stationary, climbing, sniffing and rearing behaviors in the (G) fed state (P = 0.0052, P = 0.0007, P < 0.0015, P = 0.0002, P < 0.004), as well as for stationary, climbing and rearing behavior in the (H) fasted state (P = 0.047, P = 0.047, P = 0.048; n = WT = 11, OBGHSR−/− = 11). I-J) Pie charts of behaviors (walking, climbing, rearing, digging, grooming, sniffing, stationary) during (I) fed, and (J) fasted conditions. Data are presented as mean +/− SEM. All specific statistical information is reported in supplementary table 1.
Figure 3
Figure 3
OBGHSRdeletion reduced interest in food-related and social odors A) Schematic of the baited open field test created with BioRender.com. A peanut butter-scented filter paper was placed in the middle of an open field arena, and mice were allowed to roam undisturbed in fed versus fasted conditions (WT = 11, OBGHSR−/− = 10). B-D) Percent Time in Inner Zone (B), and in sniffing zone (C), with the distance moved (D). OBGHSR−/− mice spend less time in the inner zone (Two-way ANOVA, Pgenotype<0.0001), and move less (Two-way ANOVA, Pgenotype = 0.0039). E,F) Behavioral analysis with pie charts of behaviors (stationary, walking, rearing, grooming, sniffing) in fed (E) and fasted (F) conditions. Behavioral analysis during the baited open field task reveals that OBGHSR−/− mice have less interest in active behaviors and spent more time stationary (multiple unpaired t tests). G) Schematic of the 3 chamber exploration with no scent or female urine on filter paper inside an Eppendorf tube with a perforated lid created with BioRender.com (WT = 9, OBGHSR−/− = 10). H, I) Cumulative duration (H) and time sniffing (I) in the different zones with no scent (blank) present. K,L) Cumulative duration (K) and time sniffing (L) in the different zones when mice were presented with female urine. M) Distance during trials. While there was no difference in the exploration task when no scent was present, OBGHSR−/− mice spent significantly less time sniffing the female urine (Two-way ANOVA, Pgenotype∗zone = 0.0008) and explore less (multiple unpaired t tests, Purine = 0.002697). Data are presented as mean +/− SEM. All specific statistical information is reported in supplementary table 1.
Figure 4
Figure 4
OBGHSRdeletion affects mood, anxiety, and hedonia. A-D) Schematic of the elevated plus maze with 2 open arms and 2 closed arms in fed and fasted conditions created with BioRender.com (WT = 11, OBGHSR−/− = 11). Time spent in the more anxiogenic open zone was measured in fed versus fasted conditions. While mice with GHSR deletion spent more time in closed arms (B) and less time in open arms (C), this was significant in the fasted state, where mice also moved less (D) (Two-way ANOVA). E-H) Schematic of the Light-Dark Box in fed and fasted conditions created with BioRender.com (WT = 11, OBGHSR−/− = 11). Percent time in the anxiogenic light zone (F) and light zone entries (G) were significantly lower in OBGHSR−/− mice when fasted, also with less distance travelled (H) during fasted conditions (Two-way ANOVA). I-L) Schematic of the Open Field Test in fed and fasted conditions created with BioRender.com (WT = 11, OBGHSR−/− = 11). Percent time (J) in the anxiogenic inner zone tended to be decreased in both metabolic states with fewer inner zone entries (K), and less distance travelled (L) (Two-way ANOVA). M-O). Schematic of the Two-Bottle Choice Test created with BioRender.com. Mice were offered either water or a palatable non-caloric 0.1% Saccharin solution for 2 h every day (WT = 10, OBGHSR−/− = 9). OBGHSR−/− mice have a significantly lower saccharin intake (N) and calculated saccharin preference score (O) (Two-way ANOVA). P–R). Schematic of the home cage running wheel activity created with BioRender.com. Cumulative distance (Q) and daily distance summary (R) for 4 days show no difference between the genotypes (multiple unpaired t tests). Data are presented as mean +/− SEM. All specific statistical information is reported in supplementary table 1.
Figure 5
Figure 5
OBGHSRdeletion does not affect food intake but feeding behavior and food seeking. A-G) Food intake in BioDaq Feeding Cages (WT = 11, OBGHSR−/− = 11). Cumulative Food Intake (A), with average daily food intake (B), and daily food intake during the dark and light phase (C) during a 7-day period. Average food intake was not different between the genotypes (Two-way ANOVA). However, ingestive behavior was different between the groups as shown with cumulative bouts (D), average daily bouts (E), daily bouts (F), and time spent per bout (G). OBGHSR−/− mice had significantly fewer feeding bouts (Two-way ANOVA) and spent more time per bout (Two-tailed unpaired t test, P = 0.0155). H) Fasting-induced food intake (WT = 11, OBGHSR−/− = 11). Food intake in WT and OBGHSR−/− following an overnight fast 2 h and 5 h after the food was reintroduced. There was no significant different between the groups (Two-way ANOVA). I) Ghrelin-induced food intake (WTsaline = 18, WTghrelin = 20, OBGHSR−/−saline = 21, OBGHSR−/−ghrelin = 20). Food intake in WT and OBGHSR−/− following intraperitoneal injection of ghrelin (0.5 μg/g). While we observed a significant effect of ghrelin on food intake, there was no difference between the two genotypes (Two-way ANOVA). J-L) Schematic of the Buried Food Seeking Test created with BioRender.com, which records the time needed to find familiar palatable food (froot loop) buried in high bedding. K) Fasting-induce food-seeking after a 4- hour fast (WT = 20, OBGHSR−/− = 19). OBGHSR−/− mice took significantly longer time to find the froot loop (Two-tailed unpaired t test, P = 0.0428). L) Ghrelin-induced food seeking (WTsaline = 10, WTghrelin = 10, OBGHSR−/−saline = 9, OBGHSR−/−ghrelin = 9). OBGHSR−/− mice needed more time to find the froot loop (Two-way ANOVA, Pgenotype = 0.03). Data are presented as mean +/− SEM. All specific statistical information is reported in supplementary table 1.
Figure 6
Figure 6
OBGHSRdeletion affects energy metabolism. A) Body weight (WT = 36, OBGHSR−/− = 33, 3 cohorts compiled). OBGHSR−/− mice were significantly heavier (Two-way ANOVA, Pgenotype <0.0001). B-D) EchoMRI body composition at 13 weeks post cre injection (WT = 11, OBGHSR−/− = 10). OBGHSR−/− mice exhibited a higher body weight (B) (two-tailed unpaired t test, P = 0.0052), with greater fat mass (C) and smaller lean mass (D) in an ad libitum or fasted state (Two-way ANOVA, Pgenotype = 0.0002, and Pgenotype = 0.0002 respectively). E,F) Energy expenditure (WT = 8, OBGHSR−/− = 8). OB GHSR deletion did not change energy expenditure in either the dark or light phase (Two-way ANOVA, Pgenotype = 0.9785). G,H) Respiratory exchange ratio. OBGHSR−/− mice displayed an increase in the respiratory exchange ratio that was more pronounced during the light period (Two-way ANOVA, Pgenotype = 0.0268, Pgenotyoe∗time = 0.0002). I,J) Locomotor activity. OB GHSR deletion did not change locomotor activity in either the dark or light phase (Two-way ANOVA, Pgenotype = 0.2616). Data are presented as mean +/− SEM. All specific statistical information is reported in supplementary table 1.
Figure 7
Figure 7
OBGHSRdeletion affects glucose metabolism. A-H) 24-hour fasting time course experiment (WT = 11, OBGHSR−/− = 10). Fasting increased blood glucose in OBGHSR−/− mice over time (Two-way ANOVA, Pgenotype = 0.0025). OBGHSR−/− mice exhibited higher blood glucose (B) and blood insulin levels (C) after 4 h fasting (student's t-tests, P = 0.0002 and P = 0.0023). D,E) Blood corticosterone after 4 h (D), and 24 fasting (E) (student's t-tests, P = 0.369 and P = 0.0549). F–H) Refeeding with blood insulin (F) and non-esterified free fatty acids (G) after 1 h of reintroducing food. OBGHSR−/− mice displayed higher blood insulin levels after refeeding (student's t-tests, P = 0.0077). There was no difference between the genotypes for non-esterified free fatty acids (NEFA) levels (Two-way ANOVA, Pmetabolic state <0.0001). H) Effect of refeeding on NEFA suppression (student's t-tests, P = 0.0006). I-M) Glucose tolerance test (WT = 11, OBGHSR−/− = 10). I) Blood glucose levels after an oral administration of glucose (2 g/kg). OB GHSR deletion impaired glucose clearance (Two-way ANOVA, Pgenotype = 0.0226). J) Area under the curve (AUC) of glucose clearance (student's t-tests, P = 0.0361). K) Blood insulin levels during the glucose tolerance test (Two-way ANOVA, Pgenotype∗time = 0.011). L) Insulin area under the curve (student's t-tests, P = 0.0049). M) Change of insulin during the glucose tolerance test (Two-way ANOVA, Pgenotype∗time <0.0001). N,O) Insulin tolerance test (WT = 10, OBGHSR−/− = 8). N) Blood glucose levels after an intraperitoneal injection of insulin (0.75 mU/g). O) NEFA. Compared to WT animals, insulin was less effective to lower blood glucose levels, or NEFA (Two-way ANOVA, Pgenotype = 0.001 and Pgenotype = 0.0067, respectively). P,Q) 2-Deoxyglucose challenge (WT = 11, OBGHSR−/− = 10). P) Blood glucose levels after an intraperitoneal injection of 2-deoxyglucose (0.5 μg/g) (Two-way ANOVA, Pgenotype = 0.0692). Q) AUC of glucose during 2-deoxyglucose challenge (student's t-tests). Data are presented as mean +/− SEM. All specific statistical information is reported in supplementary table 1.
Figure 8
Figure 8
OBVglut1regulate food-seeking and glucose homeostasis. (A) scRNA-seq analysis from the microdissected OB revealed 76% of GHSR-expressing neurons were glutamatergic, 20% GABAergic, 2% dopaminergic and <2% not assigned (n = 133 GHSR+). (B) Cross-referencing scRNA-seq and MERFISH spatial transcriptomic datasets enabled neuronal classification by anatomical structure and showed ∼ equal expression of GHSRs on glutamate and GABA neurons in the MOB, with almost exclusive GHSR expression on glutamate neurons in the AOB and AON. (C) Expression of caspase in OBVglut1 neurons (OBVglut1−/-) caused significant cell loss (WT = 20, OBVglut1 −/− = 7). (D) Buried food finding was significantly delayed in overnight fasted OBVglut1−/−mice or in response to ghrelin injection (E) with no effect on ghrelin-induced food intake (F) WT = 11, OBVglut1 −/− = 17. (G) In an odour attraction test, fasted OBVglut1−/- mice spent significantly less time in the zone with 10% peanut butter (PB), leading to less food odour preference (H, I) compared to WT mice (WT = 11, OBVglut1 −/− = 17). (J) The sensitivity to diluted peanut butter (PB) solution was significantly impaired in fasted OBVglut1−/- mice compared to WT (WT = 11, OBVglut1 −/− = 17), whereas fed OBVglut1−/- mice were less sensitive to urine diluted in water than WT mice (K, L) (WT = 11, OBVglut1 −/− = 17). (M) OBVglut1−/- mice displayed significantly lower saccharin preference (main effect of genotype) compared to WT mice (WT = 11, OBVglut1 −/− = 17) but no difference in average daily food intake (N, O) (WT = 11, OBVglut1 −/− = 12). Glucose clearance was slower in OBVglut1−/- mice during an oral glucose tolerance test (P) and the insulin-induced suppression of blood glucose was not as great as in WT mice during an insulin tolerance test (O) indicating OBVglut1−/- mice had impaired glucose handling and were less sensitive to insulin. (R) Body weight was significantly higher in OBVglut1−/- mice at the end of the experiment. Data are presented as mean +/− SEM. All specific statistical information is reported in supplementary table.
Suppl. Figure 1
Suppl. Figure 1
GHSR-expressing cells in the brain of GHSR-p2A-cre x TRAP transgenic mice. A) GHSR expressing neurons in OB of GHSR x TRAP transgenic mice. EGFP-labelled neurons are found in the main olfactory and accessory olfactory bulbs but not the AON. aci anterior commissure, intrabulbar part; AO anterior olfactory nucleus; AOB accessory olfactory bulb; AOE anterior olfactory nucleus, external part; AOM anterior olfactory nucleus, medial part; EPI external plexiform layer of the olfactory bulb; E/OV ependymal and subendymal layer/olfactory ventricle; Gl glomerular layer; GrA granular cell layer of the accessory olfactory bulb; GrO granular cell layer of the olfactory bulb; Mi mitral cell layer of the olfactory bulb. B) GHSR expression (green) in various brain regions, especially high expression in the DG of the hippocampus, hypothalamus and midbrain. AHP anterior hypothalamic area, posterior part; BLA basolateral amygdaloid nucleus, anterior part; BLP basolateral amygdaloid nucleus, posterior part, DG dentate gyrus; DMH dorsomedial hypothalamus; GrDG granular layer of the dentate gyrus; LH lateral hypothalamic area; LHb lateral habenular nucleus; LHbl lateral habenular nucleus, lateral part; MeA medial amygdaloid nucleus, anterior part; MHb medial habenular nucleus; PAG periaqueductal gray; PoDG polymorph layer of the dentate gyrus; PP peripeduncular nucleus; SC superior colliculus; SNC substantia nigra, compact part; VLG ventral lateral geniculate nucleus; VMH ventromedial hypothalamic nucleus; VTA ventral tegmental area; Zl zona incerta.
Suppl. Figure 2
Suppl. Figure 2
Olfactory habituation test. A) Number of behavioral changes in ad libitum fed condition, schematic created with BioRender.com. B) Number of behavioral changes in fasted condition. C) Number of behavioral changes during fed and fasted conditions. OBGHSR−/− mice exhibited fewer behavioral changes during the olfactory habituation test, suggesting less engagement and behavioral flexibility in exploratory activities (Two-way ANOVA). Data are presented as mean +/− SEM. All specific statistical information is reported in supplementary table 1.
Suppl. Figure 3
Suppl. Figure 3
Baited open field and female social interaction test. A) Number of behavioral changes in fed condition. B) Behavioral bout frequency in fed condition. C) Time spent in a behavioral bout during fed condition. D) Number of behavioral changes in fasted condition. E) Behavioral bout frequency in fasted condition. F) Time spent in a behavioral bout during fasted condition. OBGHSR−/− mice show different behavioral patterns with more stationary behavior and less involvement in sniffing and walking exploration or behavioral transitions (Students t-test). G-M) A schematic of a female social interaction test using a 3-chamber preference protocol created with BioRender.com, where mice either explore the 3 chambers with 2 empty wire mesh pencil cups, or a social stimulus (female WT mouse) under one or both cups. The amount of time spent interacting with either stimulus was recorded. H,I) Object–Object Interaction, 2 empty wire cups. J,K) Object–Female Interaction. L,M) Female–Female Interaction. No differences in the duration spent in the different zones nor frequencies of investigations between the groups were observed (Two-way ANOVA). Data are presented as mean +/− SEM. All specific statistical information is reported in supplementary table 1.
Suppl. Figure 4
Suppl. Figure 4
Feeding behavior. A-D) Feeding behavior in BioDaq feeding cages (schematic created with BioRender.com; WT = 10, OBGHSR−/− = 9). A) Average Food Intake. B) Average Bouts. C) Food intake after overnight fasting. D) Bouts after overnight fasting. E) Food seeking in ad libitum fed conditions. F) Food seeking after overnight fasting (Student's t-tests and two-way ANOVAs). Data are presented as mean +/− SEM. All specific statistical information is reported in supplementary table 1.
Suppl. Figure 5
Suppl. Figure 5
GHSR expression in the olfactory bulb affects metabolism. A) Faecal triglycerides. B) Faecal NEFA. C) Faecal NEFA/triglyceride ratio. There was no difference in the fat excretion in the faeces between the groups (WT = 25, OBGHSR−/− = 21, student's t-tests). D) Correlation glucose AUC during GTT with body weight. There was no significant effect of body weight on glucose AUC during the GTT (WT = 11, OBGHSR−/− = 10, Pearson r correlation). E) Gastric emptying rate during the GTT using acetaminophen as a marker for gastric emptying. F) AUC of gastric emptying rate. OBGHSR−/− mice had a delayed gastric emptying (WT = 10, OBGHSR−/− = 10, two-way ANOVA Pgenotype = 0.0456, and student's t-test P = 0.0556). Data are presented as mean +/− SEM. All specific statistical information is reported in supplementary table 1.
Suppl. Figure 6
Suppl. Figure 6
scRNA-seq and spatial transcriptomic classification of GHSR + cells in the MOB, AOB and AON. A) The expected number of GHSR + cells from different cell clusters within the MOB, AOB and AON. The dot size reflects the number, whereas shaded blue squares designated glutamatergic clusters, the shaded red squares reflect GABAergic cluster and the yellow shared squares highlight a dopamine cluster. B) Images show the olfactory bulb sections on which spatial transcriptomics was performed. Colours indicate the location of Glutamate, GABA, Dopamine and not assigned neurons according to spatial transcriptomic data. Black areas within sections of the OB indicated a lack of data for that region, as seen most predominantly in sections 638850.67, 638850.64 and 638850.62. C) Images show the location and neurotransmitter designation (Glutamate, GABA, dopamine, N/A) from spatial transcriptomic analysis in which GHSR + cells were detected. D) Images depict the location and neurotransmitter designation of GHSR + cells expressed 10× above the threshold limit.
Suppl. Figure 7
Suppl. Figure 7
Validation of OBVglut1 neuronal ablation. A) Vglut1 GFP neurons were counted from control mice without caspase ablation and from OBVglut1−/- mice with caspase ablation. WT mice were Vglut1-ires-cre mice crossed with cre-dependent fsTRAP-EGFP-L10a (Vglut1 x TRAP) and OBVglut1−/− mice were Vglut1 x TRAP mice injected with AAV-FLEX-caspase into the OB (Vglut1OB−Caspase). There were significantly fewer Vglut1 GFP neurons in all sections from bregma 4.28 to bregma 2.68 in Vglut1OB−Caspase compared to control Vglut1 x TRAP mice. B) NeuN staining was also significantly lower in the OB in Vglut1OB−Caspase compared to WT mice. Data are presented as mean +/− SEM. All specific statistical information is reported in supplementary table 1.
Suppl. Figure 8
Suppl. Figure 8
Behavioural and feeding effects from OBVglut1 neuronal ablation. A) Food odour attraction in the ad libitum fed state with odour preference duration (B, C). Time spent in the inner zone (D) and sniffing zone (E) of the baited open field or light zone of the of the light dark box (F). Distance moved within the light zone of the light dark box (G). Time spent with the open arm (H), closed arm (I) and distance travelled (J) within the elevated plus maze. Average daily feeding bouts (K, L), bout duration (M) and refeeding after fasting (N). Data are presented as mean +/− SEM. All specific statistical information is reported in supplementary table 1.

References

    1. Brandt C., Nolte H., Henschke S., Engstrom Ruud L., Awazawa M., Morgan D.A., et al. Food perception primes hepatic ER homeostasis via melanocortin-dependent control of mTOR activation. Cell. 2018;175(5):1321–1335 e1320. - PMC - PubMed
    1. Chen Y., Lin Y.C., Kuo T.W., Knight Z.A. Sensory detection of food rapidly modulates arcuate feeding circuits. Cell. 2015;160(5):829–841. - PMC - PubMed
    1. Mutlu A.S., Gao S.M., Zhang H., Wang M.C. Olfactory specificity regulates lipid metabolism through neuroendocrine signaling in Caenorhabditis elegans. Nat Commun. 2020;11(1):1450. - PMC - PubMed
    1. Fine L.G., Riera C.E. Sense of smell as the central driver of pavlovian appetite behavior in mammals. Front Physiol. 2019;10:1151. - PMC - PubMed
    1. Jovanovic P., Riera C.E. Olfactory system and energy metabolism: a two-way street. Trends Endocrinol Metabol. 2022;33(4):281–291. - PubMed

Substances

LinkOut - more resources