Comparative Study
. 2024 Oct 3;45(10):1441-1449.
doi: 10.3174/ajnr.A8342.

High-Resolution Head CTA: A Prospective Patient Study Comparing Image Quality of Photon-Counting Detector CT and Energy-Integrating Detector CT

Affiliations
Comparative Study

High-Resolution Head CTA: A Prospective Patient Study Comparing Image Quality of Photon-Counting Detector CT and Energy-Integrating Detector CT

Felix E Diehn et al. AJNR Am J Neuroradiol. .

Abstract

Background and purpose: Photon-counting detector CT (PCD-CT) is now clinically available and offers ultra-high-resolution (UHR) imaging. Our purpose was to prospectively evaluate the relative image quality and impact on diagnostic confidence of head CTA images acquired by using a PCD-CT compared with an energy-integrating detector CT (EID-CT).

Materials and methods: Adult patients undergoing head CTA on EID-CT also underwent a PCD-CT research examination. For both CT examinations, images were reconstructed at 0.6 mm by using a matched standard resolution (SR) kernel. Additionally, PCD-CT images were reconstructed at the thinnest section thickness of 0.2 mm (UHR) with the sharpest kernel, and denoised with a deep convolutional neural network (CNN) algorithm (PCD-UHR-CNN). Two readers (R1, R2) independently evaluated image quality in randomized, blinded fashion in 2 sessions, PCD-SR versus EID-SR and PCD-UHR-CNN versus EID-SR. The readers rated overall image quality (1 [worst] to 5 [best]) and provided a Likert comparison score (-2 [significantly inferior] to 2 [significantly superior]) for the 2 series when compared side-by-side for several image quality features, including visualization of specific arterial segments. Diagnostic confidence (0-100) was rated for PCD versus EID for specific arterial findings, if present.

Results: Twenty-eight adult patients were enrolled. The volume CT dose index was similar (EID: 37.1 ± 4.7 mGy; PCD: 36.1 ± 4.0 mGy). Overall image quality for PCD-SR and PCD-UHR-CNN was higher than EID-SR (eg, PCD-UHR-CNN versus EID-SR: 4.0 ± 0.0 versus 3.0 ± 0.0 (R1), 4.9 ± 0.3 versus 3.0 ± 0.0 (R2); all P values < .001). For depiction of arterial segments, PCD-SR was preferred over EID-SR (R1: 1.0-1.3; R2: 1.0-1.8), and PCD-UHR-CNN over EID-SR (R1: 0.9-1.4; R2: 1.9-2.0). Diagnostic confidence of arterial findings for PCD-SR and PCD-UHR-CNN was significantly higher than EID-SR: eg, PCD-UHR-CNN versus EID-SR: 93.0 ± 5.8 versus 78.2 ± 9.3 (R1), 88.6 ± 5.9 versus 70.4 ± 5.0 (R2); all P values < .001.

Conclusions: PCD-CT provides improved image quality for head CTA images compared with EID-CT, both when PCD and EID reconstructions are matched, and to an even greater extent when PCD-UHR reconstruction is combined with a CNN denoising algorithm.


Figures

FIG 1.
FIG 1.
Data preparation and training mechanism of a dedicated ultra-high resolution convolutional neural network (UHR-CNN) for denoising high resolution images from PCD-CT. The model used a modified 6-layer residual U-Net with 7 slices as input. The high-quality images were from iterative reconstruction (IR) images with a thick section thickness and the low-quality images were generated by adding noise patches from subtraction of filtered back-projection (FBP) and IR images followed by spatial decoupling.
FIG 2.
FIG 2.
Reader evaluation, PCD-CT versus EID-CT. Horizontal percentage stacked bar chart plots demonstrate reader 1 and 2 (R1, R2) scores for PCD-SR versus EID-SR (A) and PCD-UHR-CNN versus EID-SR (B). Bars are split into segments and the length of each bar is 100%. Segments from left to right: significantly superior (+2), somewhat superior (+1), equal quality (0), somewhat inferior (−1), significantly inferior (−2).
FIG 3.
FIG 3.
Data plot of diagnostic confidence of arterial findings. Grouped boxplot figure highlighting PCD-SR versus EID-SR and PCD-UHR-CNN versus EID-SR for diagnostic confidence scores of each reader. The bottom, top, and middle lines of each box indicate the 25th percentiles, 75th percentiles, and sample median of the data. Samples whose notches do not overlap are statistically significantly different at the 5% significance level. (Matlab 2021).
FIG 4.
FIG 4.
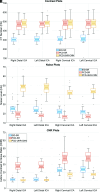
Iodine contrast, noise, and CNR quantitative evaluation. Grouped boxplots for (A) iodine contrast, (B) noise, and (C) iodine CNR results measured in the bilateral distal ICA and midcervical ICA for EID-SR, PCD-SR, and PCD-UHR-CNN. The bottom, top, and middle lines of each box indicate the 25th percentiles, 75th percentiles, and sample median of the data. Samples whose notches do not overlap are significantly different at the 5% significance level. (Matlab 2021).
FIG 5.
FIG 5.
Improved visualization of distal intracranial arterial branches on PCD-CT head CTA compared with EID-CT. Thin section oblique axial head CTA images highlighting the right M3 segment (arrows), by using EID-SR with 0.6-mm section thickness (A) and PCD-UHR-CNN CT with 0.2-mm section thickness (B) techniques. This distal intracranial arterial segment is best visualized by using PCD-CT rather than EID-CT, particularly with PCD-UHR-CNN–but also PCD-SR CT (the latter not shown). The right M3 segment is indeed difficult to visualize on EID-CT compared with PCD-CT. The insets demonstrate the improved visualization of the M3 segment (arrows) in the oblique sagittal plane.
FIG 6.
FIG 6.
Improved confidence for diagnosing infundibula on PCD-CT head CTA compared with EID-CT. Thin section oblique axial head CTA images, by using EID-SR with 0.6-mm section thickness (A) and PCD-UHR-CNN CT with 0.2-mm section thickness (B) techniques. The diagnostic confidence for diagnosing this infundibulum rather than possible aneurysm improves with PCD-SR matched to EID technique (not shown) and even more so with PCD-UHR-CNN CT at the thinnest section thickness. An ∼2-mm left supraclinoid ICA outpouching (infundibulum or aneurysm) is seen in an oblique axial plane on EID-CT (solid arrow in A), but better delineated on PCD-CT (arrow in B). The anterior choroidal artery arising from the apex of the outpouching is much better visualized on PCD-CT (arrowhead in B) than EID-CT (dashed arrow in A), thereby confidently diagnosing an infundibulum rather than an aneurysm. The insets demonstrate the improved visualization of the anterior choroidal artery arising from the apex of the outpouching in the oblique sagittal plane.
FIG 7.
FIG 7.
Improved characterization of arterial pathology on PCD-CT head CTA compared with EID-CT. Thin section oblique axial head CTA images by using EID-SR with 0.6-mm section thickness (A) and PCD-UHR-CNN CT with 0.2-mm section thickness (B) techniques. The diagnostic confidence for arterial pathology improves with PCD-SR matched to EID technique (not shown) and even more so with PCD-UHR-CNN CT at the thinnest section thickness. A right P2 segment stenosis has a relatively high-grade appearance on EID-CT (arrow in A). On PCD-CT, the stenosis is better demonstrated (arrow in B). The PCD-CT image depicts the stenosis as only mild to at most moderate in degree. The insets demonstrate the improved visualization of the right P2 stenosis in the oblique sagittal plane.

References

    1. McCollough CH, Rajendran K, Baffour FI, et al. Clinical applications of photon counting detector CT. Eur Radiology 2023;33:5309–20 10.1007/s00330-023-09596-y - DOI - PMC - PubMed
    1. Nehra AK, Rajendran K, Baffour FI, et al. Seeing more with less: clinical benefits of photon-counting detector CT. Radiographics 2023;43:e220158 10.1148/rg.220158 - DOI - PubMed
    1. Rajendran K, Petersilka M, Henning A, et al. First clinical photon-counting detector CT system: technical evaluation. Radiology 2022;303:130–38 10.1148/radiol.212579 - DOI - PMC - PubMed
    1. Ren L, Huber N, Rajendran K, et al. Dual-contrast biphasic liver imaging with iodine and gadolinium using photon-counting detector computed tomography: an exploratory animal study. Invest Radiology 2022;57:122–29 10.1097/RLI.0000000000000815 - DOI - PMC - PubMed
    1. Inoue A, Johnson TF, White D, et al. Estimating the clinical impact of photon-counting-detector CT in diagnosing usual interstitial pneumonia. Invest Radiology 2022;57:734–41 10.1097/RLI.0000000000000888 - DOI - PubMed

Publication types

LinkOut - more resources