. 2024 Sep 5;15(1):7114.
doi: 10.1038/s41467-024-51266-0.

Genetic diversity within diagnostic sputum samples is mirrored in the culture of Mycobacterium tuberculosis across different settings

Affiliations

Genetic diversity within diagnostic sputum samples is mirrored in the culture of Mycobacterium tuberculosis across different settings

Carla Mariner-Llicer et al. Nat Commun. .

Abstract

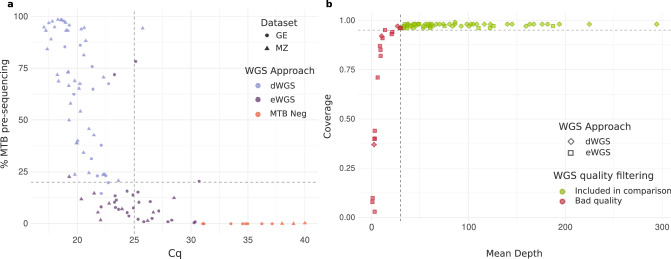
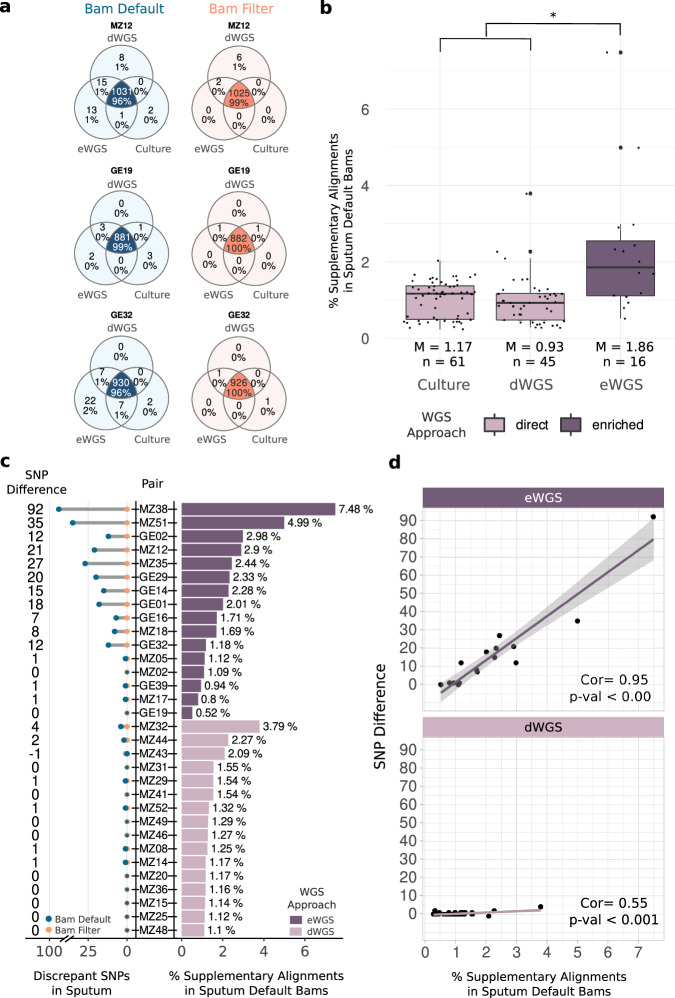
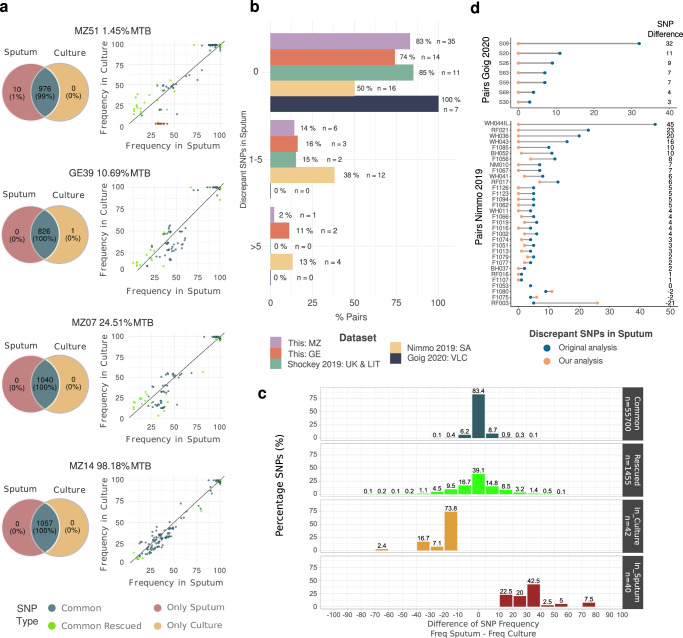
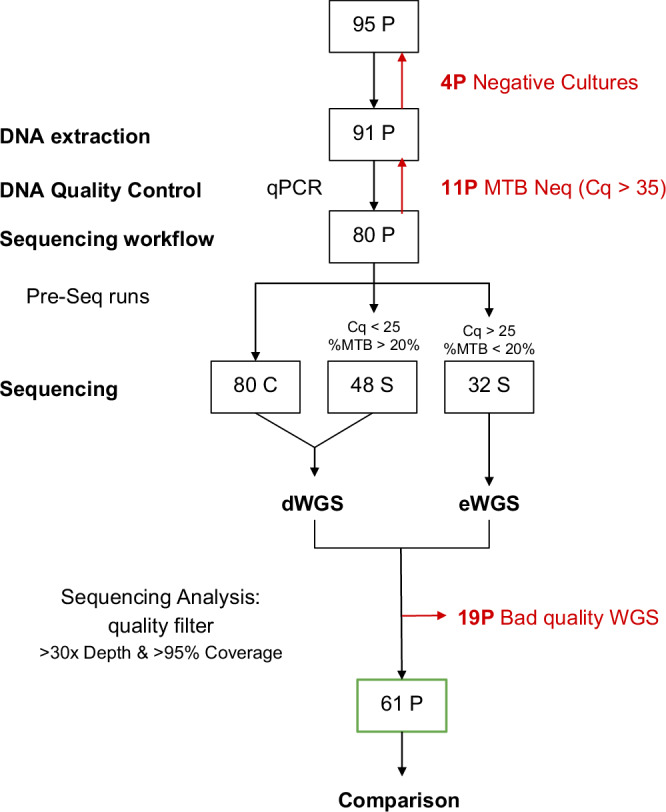
Culturing and genomic sequencing of Mycobacterium tuberculosis (MTB) from tuberculosis (TB) cases is the basis for many research and clinical applications. The alternative, culture-free sequencing from diagnostic samples, is promising but poses challenges to obtain and analyse the MTB genome. Paradoxically, culture is assumed to impose a diversity bottleneck, which, if true, would entail unexplored consequences. To unravel this paradox we generate high-quality genomes of sputum-culture pairs from two different settings after developing a workflow for sequencing from sputum and a tailored bioinformatics analysis. Careful downstream comparisons reveal sources of sputum-culture incongruences due to false positive/negative variation associated with factors like low input MTB DNA or variable genomic depths. After accounting for these factors, contrary to the bottleneck dogma, we identify a 97% variant agreement within sputum-culture pairs, with a high correlation also in the variants' frequency (0.98). The combined analysis from five different settings and more than 100 available samples shows that our results can be extrapolated to different TB epidemic scenarios, demonstrating that for the cases tested culture accurately mirrors clinical samples.


Conflict of interest statement

The authors declare no competing interests.

Figures

Fig. 1
Fig. 1. Evaluation of sputum samples for sequencing.
a qPCR Cq vs %MTB. 95 sputa are each one represented by a point. %MTB was obtained by performing a pre-sequencing run in order to determine if each sputum contained enough MTB DNA to be sequenced directly (light purple) or if it required a previous enrichment step (dark purple). Sputum samples in orange were considered negative (Cq>35 and %MTB < 1%). Shape indicates sample origin: triangles for Mozambique, dots for Georgia. Dashed lines represent thresholds to decide which WGS approach to follow, the horizontal line highlights MTB% = 20%, the vertical line highlights Cq = 25. b Mean depth vs coverage. 86 sputa sequenced with enrichment (eWGS, square) or directly (dWGS, diamond). Colour represents the sequencing quality, good quality samples (the ones used for comparison analysis) are in green and bad quality samples in red. The dashed lines represent the coverage and depth cut-off values to consider a good quality sample, the horizontal line highlights a coverage = 0.95 and the vertical line highlights depth = 30X. Source data is provided as a Source Data file.
Fig. 2
Fig. 2. Analysis of supplementary alignments.
a Venn diagrams of the comparisons between trios of direct sputum (dWGS), enriched sputum (eWGS), culture WGS. Amount and percentage of exclusive and common variants are denoted. Blue and orange Venn diagrams represent comparisons of variant calls from default unfiltered bams (including supplementary alignments and filtered bams, respectively. b Comparison of the amount of supplementary alignments between direct (sputum dWGS and culture WGS, light purple) and enriched sputum samples (eWGS, dark purple) in all 61 paired-samples. Median (M) and the total amount of samples (n) are shown. Asterisk (*) highlights a significant p-value (Wilcox test, p-value = 0.0002049). Data are presented as box-plots: centre line represents the median, upper bound located at 75th percentile, lower bound at 25th percentile, whiskers at minimum and maximum values and the outliers. Each dot represents one sample. c On the left there is the comparison of the discrepant SNPs exclusive in sputum, either dWGS and eWGS, before and after filtering supplementary alignments. Colours stand for variant calls from bams before discarding supplementary alignments (blue) and after discarding them (orange). The x-axis is discontinued. The right part shows the percentage of supplementary alignments in sputum files, either dWGS (light purple) and eWGS (dark purple). Plot c contains 32/61 pairs, the 16 ones containing a higher percentage of supplementary alignments in each eWGS and dWGS. Samples are ordered from the highest to the lowest amount of supplementary alignments. The complete version containing the 61 pairs can be seen in Supplementary Fig. 3. d Correlation between the percentage of supplementary alignments and the amount of SNPs removed when discarding supplementary alignments from sputum bam files (represented as SNP difference and calculated as follows: discrepant SNPs exclusive in sputum in Default Bams—Filtered Bams). Colours represent whether the sputum samples have been sequenced directly (light purple) or previously enriched (dark purple). Regression lines, Pearson correlation coefficients (one-side) (Corr) and p-values are shown in the plot. Source data are provided as a Source Data file.
Fig. 3
Fig. 3. Comparison of variants between sputum-culture pairs.
a Comparison of the amount of common and exclusive variants (Venn diagrams on the left) and comparison of frequency of variants in sputum (dWGS or eWGS) and culture (on the right). Colours represent common or exclusive variants. Percentage of MTB reads in the dWGS is shown above each plot. The complete figures containing the 61 pairs can be seen in Supplementary Fig. 4 and Supplementary Fig. 5. b Analysis of sputum-exclusive variants in this dataset and published ones. Percentage of pairs in each dataset with 0, 1-5 or more than 5 sputum-exclusive SNPs (all were not fixed variants). Colours represent the dataset. Abbreviations of countries/regions stand for: MZ-Mozambique, GE-Georgia, UK-United Kingdom, LIT-Lituania, SA-South Africa, VLC-Valencia (Spain). c Histogram of the difference of frequency (freq) between variants obtained in sputum versus culture (frequency in sputum - frequency in culture). Colours represent whether the variants are common or exclusive. Percentages of SNPs are shown on the top of the bars. The plot includes the percentage of SNPs that have a frequency difference equal to 0.Total number of variants is shown in grey boxes (n). d Differences of sputum-exclusive SNPs published in the original paper (in blue) versus the ones found by running our pipeline (in orange) for Goig et al. (upper panel) and Nimmo et al. (bottom panel) datasets. Source data are provided as a Source Data file.
Fig. 4
Fig. 4. Sequencing workflow.
Diagram summarising the sequencing steps and the amount of samples that have passed or have been discarded (in red). Abbreviations: C-Culture, S-Sputum, P-Pair, dWGS-sputum samples not enriched, eWGS-sputum samples enriched.
Fig. 5
Fig. 5. Comparison of percentage of MTB.
Comparison of %MTB DNA before and after the enrichment step of the 32 sputum samples that have been enriched. Each point represents a sputum sample. Colours represent samples’ origin orange for samples from Georgia and purple for samples for Mozambique. Lines link each sputum sample before and after the enrichment. Source data are provided as a Source Data file.
Fig. 6
Fig. 6. Parameters used for variant calling in VarScan.
Fixed SNPs (fSNPs) are the ones called at a frequency above 90%. After obtaining SNP files additional filters were applied as described in the Core analysis section.

References

    1. Meehan, C. J. et al. Whole genome sequencing of Mycobacterium tuberculosis: current standards and open issues. Nat. Rev. Microbiol.17, 533–545 (2019). 10.1038/s41579-019-0214-5 - DOI - PubMed
    1. Gagneux, S. Ecology and evolution of Mycobacterium tuberculosis. Nat. Rev. Microbiol.16, 202–213 (2018). 10.1038/nrmicro.2018.8 - DOI - PubMed
    1. Gagneux, S. et al. The competitive cost of antibiotic resistance in Mycobacterium tuberculosis. Science312, 1944–1946 (2006). 10.1126/science.1124410 - DOI - PubMed
    1. Miotto, P., Cabibbe, A. M., Borroni, E., Degano, M. & Cirillo, D. M. Role of disputed mutations in the rpob gene in interpretation of automated liquid MGIT culture results for rifampin susceptibility testing of Mycobacterium tuberculosis. J. Clin. Microbiol.56, e01599–17 (2018). 10.1128/JCM.01599-17 - DOI - PMC - PubMed
    1. Gehre, F. et al. Deciphering the growth behaviour of Mycobacterium africanum. PLoS Negl. Trop. Dis.7, e2220 (2013). 10.1371/journal.pntd.0002220 - DOI - PMC - PubMed

Publication types

MeSH terms

LinkOut - more resources