. 2024 Sep 5;15(1):7765.
doi: 10.1038/s41467-024-52071-5.

A robust mouse model of HPIV-3 infection and efficacy of GS-441524 against virus-induced lung pathology

Affiliations

A robust mouse model of HPIV-3 infection and efficacy of GS-441524 against virus-induced lung pathology

Yuxia Lin et al. Nat Commun. .

Abstract

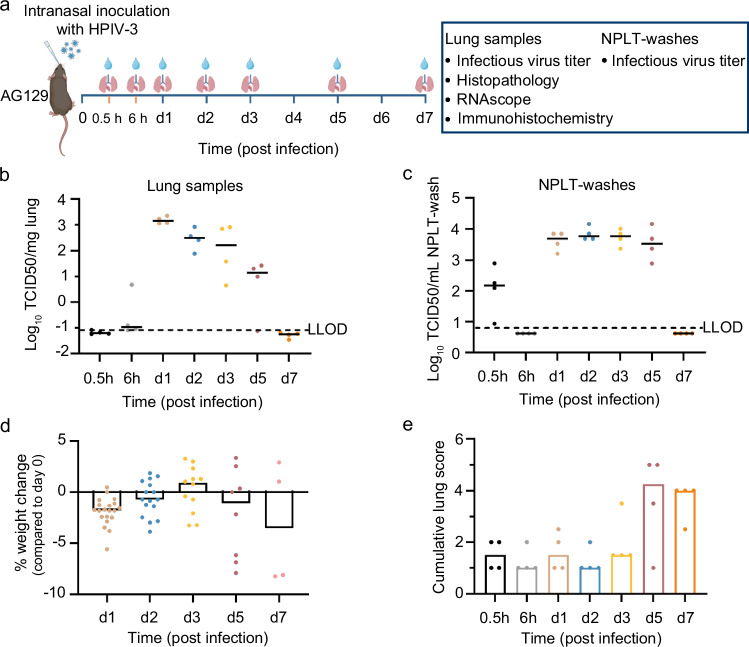
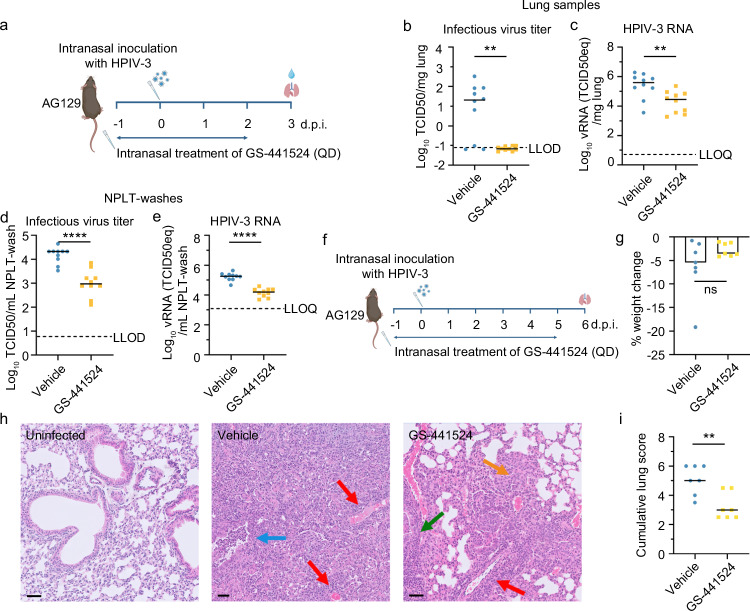
Human parainfluenza virus type 3 (HPIV-3) can cause severe respiratory tract infections. There are no convenient small-animal infection models. Here, we show viral replication in the upper and lower airways of AG129 mice (double IFNα/β and IFNγ receptor knockout mice) upon intranasal inoculation. By multiplex fluorescence RNAscope and immunohistochemistry followed by confocal microscopy, we demonstrate viral tropism to ciliated cells and club cells of the bronchiolar epithelium. HPIV-3 causes a marked lung pathology. No virus transmission of the virus was observed by cohousing HPIV-3-infected AG129 mice with other mice. Oral treatment with GS-441524, the parent nucleoside of remdesivir, reduced infectious virus titers in the lung, with a relatively normal histology. Intranasal treatment also affords an antiviral effect. Thus, AG129 mice serve as a robust preclinical model for developing therapeutic and prophylactic strategies against HPIV-3. We suggest further investigation of GS-441524 and its prodrug forms to treat HPIV-3 infection in humans.


Conflict of interest statement

D.B. and J.B. are employees of Gilead Sciences which owns GS-441524. None of the other authors have any competing interests.

Figures

Fig. 1
Fig. 1. Kinetics of HPIV-3 replication in intranasally inoculated AG129 mice.
a Setup of the study. AG129 mice were intranasally inoculated with 1.5 × 106 TCID50 of HPIV-3. Lung samples and NPLT-washes were collected at various time points post-infection (p.i.). b Infectious virus titers are expressed as log10 TCID50 per milligram of lung sample. c Infectious virus titers are expressed as log10 TCID50 per milliliter of NPLT-wash. d Weight change at various time points post-infection is presented as a percentage of the body weight at the time of inoculation. e Cumulative severity scores of lungs of all infected mice. Individual data and median values (indicated by bars) are presented in all graphs. LLOD presents the lower limit of detection. Data are from one experiment with four mice per group. Source data are provided as a Source Data file. a was designed with BioRender.
Fig. 2
Fig. 2. Tropism of HPIV-3 to ciliated cells and club cells of the bronchiolar epithelium of AG129 mice.
Confocal images of 5 µm sections through lung samples. Multiplex fluorescence with RNAscope and IHC. The name of the mouse gene or viral RNA that is the target for an RNAscope probe, yielding puncta, is in italics. The name of the protein that is the target for an antibody, yielding an immunoreactive (IR) signal, is in roman. DAPI serves as a nuclear stain. ac Uninfected, d, e 1 d.p.i., f 10 d.p.i., gi 3 d.p.i., jl 5 d.p.i. a Transverse section through a bronchiole. The lumen of the bronchiole (the black space at the center) is devoid of cells. Alveoli of the lung parenchyma surround the bronchiole. Foxj1 is a marker for ciliated cells and Scgb1a1 for club cells in the bronchiolar epithelium. Sftpc is a marker for type II pneumocytes in the alveolar wall. b, c As expected, there are no puncta for the HPIV-3-HN probe and the HPIV-3-NP probe in uninfected mice. d The Krt8-IR signal labels most epithelial cells in the bronchiolar epithelium. A fraction of the cells in the bronchiolar epithelium harbor HPIV-3-HN puncta and HPIV-3-NP puncta, colocalizing within the same cells. There are no such puncta in the alveoli surrounding the bronchiole. e Nearly all cells in the bronchiolar epithelium harbor HPIV-3-NP puncta. There are no such puncta in the alveoli surrounding the bronchiole. f A few cells in the bronchiolar epithelium harbor HPIV-3-NP puncta at this late endpoint, 10 d.p.i. g, h Triple RNAscope reveals HPIV-3-HN puncta colocalizing with Foxj1 puncta or Scgb1a1 puncta. h A fraction of the cells harboring Foxj1 puncta or Scgb1a1 puncta also harbor HPIV-3-HN puncta. i A fraction of the cells harboring Scgb1a1 puncta also harbor HPIV-3-NP puncta. jl These fields of view comprise only alveoli. Ager is a marker for type I pneumocytes. Roundish cells harbor densely packed HPIV-3-NP puncta but neither Ager puncta nor Sftpc puncta. The epithelium is referred to as bronchiolar epithelium, as the sections were made through parts of the lungs that are located peripherally. Numbers of biological replicates: a, n = 1; b, c, n = 2; dl, n = 3.
Fig. 3
Fig. 3. Prophylactic oral treatment with GS-441524 of AG129 mice intranasally inoculated with HPIV3 reduces viral loads and lung pathology.
a Setup of the study. AG129 mice were orally treated twice daily with either vehicle or 50 mg/kg GS-441524 from day −1 p.i. to day 2 p.i., and intranasally inoculated with 1.5 × 106 TCID50 of HPIV-3 at day 0 p.i. Lung samples were collected at day 3 p.i. to measure viral loads. b Infectious virus titers are expressed as log10 TCID50 per milligram of lung sample. LLOD presents the lower limit of detection. c HPIV-3 RNA levels are expressed as log10 TCID50 equivalent per milligram of lung sample. LLOQ presents the lower limit of quantification. b, c Data are from two independent experiments, each with 6 mice per group. Data were analyzed by the two-tailed Mann–Whitney U test. ****p < 0.0001. d Setup of the study. AG129 mice were orally treated twice daily with vehicle or 50 mg/kg GS-441524 from day −1 p.i. to day 5 p.i., and intranasally inoculated with 1.5 × 106 TCID50 of HPIV-3 at day 0 p.i. Lungs were collected at day 6 p.i. for lung histopathology assessment. e Weight change at day 6 p.i. is presented as a percentage of the body weight at day −1 p.i., when treatment was started. f Representative H&E-stained images reveal normal lung parenchyma in uninfected mice, centrilobular accentuation of inflammation with bronchopneumonia (green arrows), perivascular inflammation (red arrows), and peribronchial inflammation (blue arrows) in the vehicle-treated mice, and very focal and limited perivascular inflammation (red arrows) in the GS-441524-treated mice. The scale bar is 50 µm. The samples of uninfected mice and infected mice were from the same experiment, but the staining procedure was performed at different moments. g Cumulative severity scores of lungs of all infected mice. e, g Data are from one experiment with 8 mice in the vehicle-treated group and 7 mice in the GS-441524-treated group. Data were analyzed with the two-tailed Mann–Whitney U test. ns nonsignificant, ***p = 0.0002. Individual data and median values (indicated by bars) are presented in all graphs. Source data are provided as a Source Data file. a, d were designed with BioRender.
Fig. 4
Fig. 4. Visualizing HPIV-3 RNA species in vehicle-treated vs. GS-441524-treated AG129 mice.
Confocal images of sections through lung samples. Multiplex fluorescence with double or triple RNAscope. The name of a viral RNA species that is a target for an RNAscope probe, yielding puncta, is in italics. HPIV-3-NP-antigenome puncta visualize positive-sense viral RNA species. DAPI serves as nuclear stain. a Uninfected, bf vehicle-treated, gi GS-441524-treated. a Transverse section through two adjacent bronchioles. The lumen of the bronchioles (the black spaces at the center) is devoid of cells. Foxj1 is a marker for ciliated cells. As expected, there are no puncta for the HPIV-3-HN probe and for the HPIV-3-NP-antigenome probe in this uninfected mouse. b HPIV-3-HN puncta diffusely fill cells in the bronchiolar epithelium, and HPIV-3-NP-antigenome puncta are perinuclear. c An orthogonal projection of a z-stack of confocal slices of the region in (b) indicated with an asterisk. A cell at the center harbors both Foxj1 puncta and HPIV-3-NP-antigenome puncta; these puncta appear yellow in overlay. d Scgb1a1 is a marker for club cells in the bronchiolar epithelium. A great many cells in the epithelium of two adjacent bronchioles harbor HPIV-3-HN puncta, colocalizing with Foxj1 puncta or Scgb1a1 puncta within the same cells. e, f Numerous cells in the bronchiolar epithelium harbor HPIV-3-NP-antigenome puncta. g In contrast, very few cells (g) or no cells (h) in the bronchiolar epithelium harbor HPIV-3-NP-antigenome puncta. i There are no HPIV-3-HN puncta detectable in this larger field of view. The epithelium is referred to as bronchiolar epithelium, as the sections were made through parts of the lungs that are located peripherally. Numbers of biological replicates: a, n = 2; bi, n = 3.
Fig. 5
Fig. 5. Intranasal treatment with GS-441524 of intranasally inoculated AG129 mice reduces viral loads in the lung and NPLT-washes and lung pathology.
a Setup of the study. AG129 mice were intranasally treated once daily with either vehicle or GS-441524 (40 µL/mouse of a 30 mg/mL solution) from day −1 p.i. to day 2 p.i., and intranasally inoculated with 1.5 × 106 TCID50 of HPIV-3 at day 0 p.i. Lung samples and NPLT-washes were collected at day 3 p.i. to measure viral loads. b Infectious virus titers are expressed as log10 TCID50 per milligram of lung sample. c HPIV-3 RNA levels are expressed as log10 TCID50 equivalent per milligram of lung sample. d Infectious virus titers are expressed as log10 TCID50 per milliliter of NPLT-wash. e HPIV-3 RNA levels are expressed as log10 TCID50 equivalent per milliliter of NPLT-wash. be LLOD presents the lower limit of detection. LLOQ presents the lower limit of quantification. Data are from two independent experiments with ten mice per group. Data were analyzed by the two-tailed Mann–Whitney U test. *p = 0.0312, **p = 0.0071, ****p < 0.0001. f Setup of the study. AG129 mice were intranasally treated once daily with either vehicle or GS-441524 (40 µL/mouse of a 30 mg/mL solution) starting from day −1 p.i. and continued for five consecutive days. The mice were intranasally inoculated with 1.5 × 106 TCID50 of HPIV-3 at day 0 p.i. Lung samples were collected at day 6 p.i. for lung histopathology assessment. g Weight change at day 6 p.i. is presented as a percentage of the body weight at day −1 p.i., when treatment was started. h Representative H&E-stained images of the lung show bronchopneumonia (green arrow), perivascular inflammation (red arrows), peribronchial inflammation (blue arrow), and pneumocyte hyperplasia (orange arrow). The scale bar is 50 µm. i Cumulative severity scores of lungs of all infected mice. g, i Data are from one experiment, with seven mice per group. Data were analyzed with the two-tailed Mann–Whitney U test. ns nonsignificant, **p = 0.0070. Individual data and median values (indicated by bars) are presented in all graphs. Source data are provided as a Source Data file. a, f were designed with BioRender.
Fig. 6
Fig. 6. A single intranasal prophylactic dose of GS-441524 in AG129 mice intranasally inoculated with HPIV-3 reduces viral loads in the lung.
a Setup of the study. AG129 mice were administrated intranasally with a single dose of GS-441524 (40 µL/mouse of a 30 mg/mL solution) at 6 or 1 h pre-infection, and then intranasally inoculated with 1.5 × 106 TCID50 of HPIV-3. Lung samples were collected at day 3 p.i. to measure viral loads. b Infectious virus titers are expressed as log10 TCID50 per milligram of lung sample. LLOD presents the lower limit of detection. c HPIV-3 RNA levels are expressed as log10 TCID50 equivalent per milligram of lung sample. Data are from one experiment with five mice per group. Data were analyzed with the Kruskal–Wallis with Dunn’s multiple comparisons test. *p = 0.0390 (b), *p = 0.0392 (c), **p = 0.0060. Individual data and median values (indicated by bars) are presented in all graphs. Source data are provided as a Source Data file. a was designed with BioRender.

References

    1. Branche, A. R. & Falsey, A. R. Parainfluenza virus infection. Semin. Respir. Crit. Care Med.37, 538–554 (2016). 10.1055/s-0036-1584798 - DOI - PMC - PubMed
    1. Pan, Y. et al. Human parainfluenza virus infection in severe acute respiratory infection cases in Beijing, 2014-2016: a molecular epidemiological study. Influenza Other Respir. Viruses11, 564–568 (2017). 10.1111/irv.12514 - DOI - PMC - PubMed
    1. Ben-Shimol, S., Landau, D., Zilber, S. & Greenberg, D. Parainfluenza virus type 3 outbreak in a neonatal nursery. Clin. Pediatr.52, 866–870 (2013). 10.1177/0009922812441674 - DOI - PubMed
    1. Maeda, H., Haneda, K. & Honda, Y. Parainfluenza virus type 3 outbreak in a neonatal intensive care unit. Pediatr. Int.59, 1219–1222 (2017). 10.1111/ped.13389 - DOI - PMC - PubMed
    1. Henrickson, K. J. Parainfluenza viruses. Clin. Microbiol. Rev.16, 242–264 (2003). 10.1128/CMR.16.2.242-264.2003 - DOI - PMC - PubMed

Publication types

MeSH terms

LinkOut - more resources