. 2024 Sep 6;9(1):230.
doi: 10.1038/s41392-024-01942-w.

A new paradigm for generating high-quality cardiac pacemaker cells from mouse pluripotent stem cells

Affiliations

A new paradigm for generating high-quality cardiac pacemaker cells from mouse pluripotent stem cells

Zheyi Lin et al. Signal Transduct Target Ther. .

Abstract

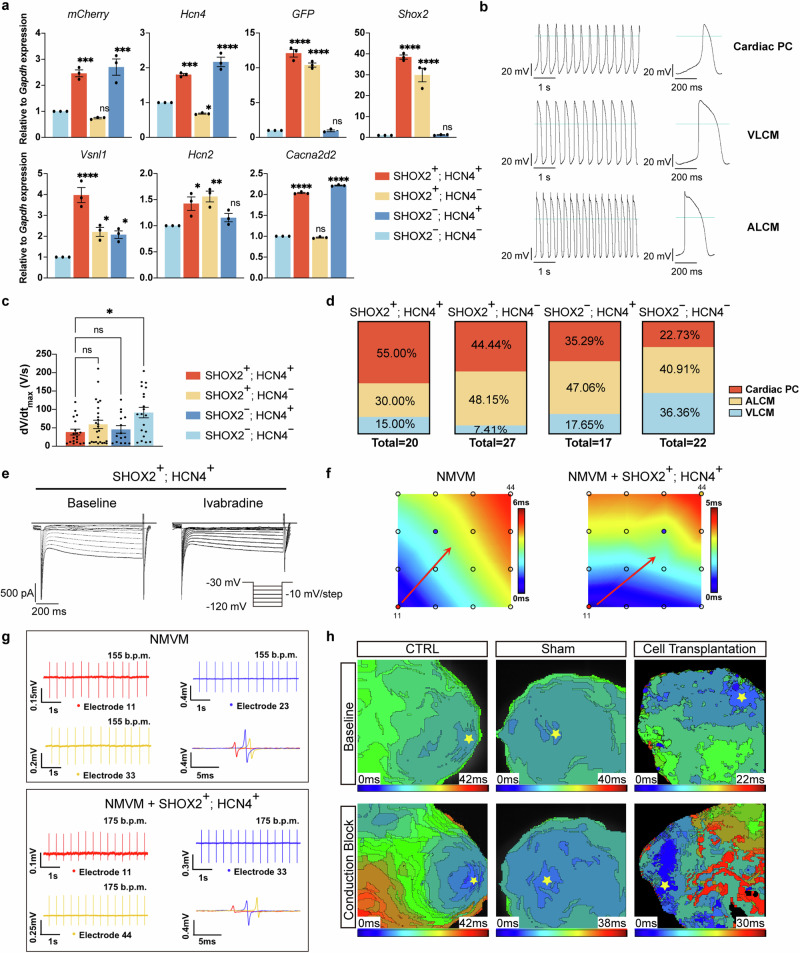
Cardiac biological pacing (BP) is one of the future directions for bradyarrhythmias intervention. Currently, cardiac pacemaker cells (PCs) used for cardiac BP are mainly derived from pluripotent stem cells (PSCs). However, the production of high-quality cardiac PCs from PSCs remains a challenge. Here, we developed a cardiac PC differentiation strategy by adopting dual PC markers and simulating the developmental route of PCs. First, two PC markers, Shox2 and Hcn4, were selected to establish Shox2:EGFP; Hcn4:mCherry mouse PSC reporter line. Then, by stepwise guiding naïve PSCs to cardiac PCs following naïve to formative pluripotency transition and manipulating signaling pathways during cardiac PCs differentiation, we designed the FSK method that increased the yield of SHOX2+; HCN4+ cells with typical PC characteristics, which was 12 and 42 folds higher than that of the embryoid body (EB) and the monolayer M10 methods respectively. In addition, the in vitro cardiac PCs differentiation trajectory was mapped by single-cell RNA sequencing (scRNA-seq), which resembled in vivo PCs development, and ZFP503 was verified as a key regulator of cardiac PCs differentiation. These PSC-derived cardiac PCs have the potential to drive advances in cardiac BP technology, help with the understanding of PCs (patho)physiology, and benefit drug discovery for PC-related diseases as well.


Conflict of interest statement

The authors declare no competing interests.

Figures

Fig. 1
Fig. 1
Construction of Shox2:EGFP; Hcn4:mCherry mESC reporter line and cardiac PCs differentiation. a Schematic overview of the construction of Shox2:EGFP; Hcn4:mCherry mESC reporter line. 2A-EGFP and mCherry were inserted into 3’UTR of Shox2 and Hcn4, respectively, by CRISPR/Cas9 system. HA, homologous arm. b qRT-PCR analysis of pluripotency marker gene expression of Shox2:EGFP; Hcn4:mCherry mESCs cultured in 2i/LIF, relative to Gapdh expression, normalized to WT E14TG2a mESCs (2i/LIF). HM Shox2:EGFP; Hcn4:mCherry mESC clones cultured in 2i/LIF at least three passages. Data were presented as means ± standard error of the mean (SEM) from biological triplicates (n = 3). c Immunofluorescence of Shox2:EGFP; Hcn4:mCherry mESCs cultured in 2i/LIF. Pluripotency markers: OCT4 (green) and NANOG (red). Scale bar: 100 µm. d Flow cytometry analysis of fluorescent subpopulations during cardiac PCs differentiation from days 0 to 11 by the EB method. Red square, SHOX2+; HCN4+ cells; yellow circle, SHOX2+; HCN4 cells; blue triangle, SHOX2; HCN4+ cells. Data were presented as means ± SEM from biological triplicates (n = 3). e Flow cytometry analysis of fluorescent subpopulations during cardiac PCs differentiation from days 0 to 13 by the M10 method. Red square, SHOX2+; HCN4+ cells; yellow circle, SHOX2+; HCN4 cells; blue triangle, SHOX2; HCN4+ cells. Data were presented as means ± SEM from biological triplicates (n = 3)
Fig. 2
Fig. 2
Development of the FSK method for efficient cardiac PCs generation. a qRT-PCR analysis revealed that the FSK method induced the transition from naïve to formative state on differentiation day 3. Relative to Gapdh expression, normalized to Shox2:EGFP; Hcn4:mCherry mESCs (2i/LIF). Pluripotency marker: Oct4; formative markers: Otx2, Oct6, and Fgf5; naïve markers: Nanog, Tbx3, and Esrrb. Data were presented as means ± SEM from technical triplicates (n = 3). b qRT-PCR analysis revealed that ACC induced the commitment of FSCs into mesoderm on differentiation day 5. Relative to Gapdh expression, normalized to Shox2:EGFP; Hcn4:mCherry mESCs (2i/LIF). Primitive streak markers: T and Foxa2; endoderm markers: Hhex and Sox17; pluripotency marker: Oct4; mesoderm markers: Mesp1 and Flk1; cardiac lineage marker: Nkx2-5. Data were presented as means ± SEM from technical triplicates (n = 3). c Flow cytometry analysis of T+ and MESP1+ cells during differentiation from days 4 to 6. CTRL, control represented differentiated cells collected on day 5 stained with the fluorescent secondary antibody only. Data were presented as means ± SEM from biological triplicates (n = 3). d Flow cytometry analysis of SHOX2+; HCN4+ cells on differentiation day 13 after induction by the M10 method or FS + ACC induction. ‘FS + ACC’ represented the FS transition (days 0–3) and mesoderm induction (ACC induction, days 5–7). Data were presented as means ± SEM from biological triplicates (n = 3). e Comparison of cardiac PCs differentiation efficiency on day 13. In addition to FS + ACC, AIRC induction was combined to treat cells from days 6–8 in the FSK group, while only an equal volume of dimethyl sulfoxide (DMSO) was added in the DMSO group. Red, SHOX2+; HCN4+ cells; yellow, SHOX2+; HCN4 cells; blue, SHOX2; HCN4+ cells. Data were presented as means ± SEM from biological triplicates (n = 3). f Representative live cell images displayed the expression pattern of HCN4 and SHOX2 by the FSK method on day 13 using Shox2:EGFP; Hcn4:mCherry mESC reporter line. Scale bar: 100 µm. g Percentage of three fluorescent subpopulations in the process of the FSK method. Red square, SHOX2+; HCN4+ cells; yellow circle, SHOX2+; HCN4 cells; blue triangle, SHOX2; HCN4+ cells. Data were presented as means ± SEM from biological triplicates (n = 3). h Expression pattern of cardiac-related markers in day 8 differentiated cells by the FSK method. Experiments were performed on Shox2:EGFP; Hcn4:mCherry mESC reporter line. Relative to Gapdh expression, normalized to day 6 differentiated cells. Cardiac PC markers: Shox2, Tbx5, Tbx18, and Hcn4; early cardiac lineage markers: Tbx20, Gata4, Gata5, Gata6, and Nkx2-5. Data were presented as means ± SEM from technical triplicates (n = 3). i Transcriptional level of cardiac-related markers in day 13 differentiated cells by the FSK method. Relative to Gapdh expression, normalized to Shox2:EGFP; Hcn4:mCherry mESCs (2i/LIF). Cardiac PC markers: Isl1, Tbx18, Tbx5, Hcn4, Smoc2, Hcn1, and Shox2; VLCM markers: Cx43 and Myl2; ALCM markers: Nppa, Scn5a, Myl7, Cx40, and Myh6. Data were presented as means ± SEM from technical triplicates (n = 3). j Flow cytometry analysis of fluorescent subpopulations on differentiation day 13. Data were presented as means ± SEM from 9 biological samples of 3 independent experiments. k Differences in the expression of cardiac-related markers between the FSK and EB methods. qRT-PCR analysis of gene expression on day 13 differentiated cells. Relative to Gapdh expression, normalized to day 13 Shox2:EGFP; Hcn4:mCherry EBs. Cardiac PC markers: Shox2, Hcn4, Vsnl1, Cacna2d2, Rgs6, and Tbx5 (orange); ALCM markers: Myh6 and Myl7 (green); cardiac lineage markers: Tnnt2 and Nkx2-5 (deep blue); VLCM markers: Myl2 and Cx43 (light blue). Data were presented as means ± SEM from technical triplicates (n = 3). l Diagram of the FSK method. mESCs cultured in 2i/LIF were used as seed cells. RB-i, RPMI1640 plus B27 minus insulin; RB, RPMI1640 plus B27. P values were calculated using a two-tailed student t-test to compare two groups of data (b, d, e). Comparisons between multiple groups in the FSK and EB methods were performed with the one-way ANOVA test (k). Statistical significance was indicated as follows: ns, not significant; P < 0.05 (*); P < 0.01 (**); P < 0.001 (***); P < 0.0001 (****)
Fig. 3
Fig. 3
SHOX2+; HCN4+ cells displayed cardiac PC characteristics. a qRT-PCR analysis of the expression of cardiac lineage and cardiac PC marker genes in sorted cells. Relative to Gapdh expression, normalized to SHOX2; HCN4 cells. mCherry and EGFP were closely correlated to Hcn4 and Shox2 expression, respectively. Cardiac PC-related TF marker: Shox2; cardiac PC-related ion channels: Hcn4, Hcn2, and Cacna2d2; cardiac PC enriched gene: Vsnl1. Red, SHOX2+; HCN4+ cells; yellow, SHOX2+; HCN4 cells; deep blue, SHOX2; HCN4+ cells; light blue, SHOX2; HCN4 cells. Data were presented as means ± SEM from technical triplicates (n = 3). b Representative sAP recording of single cells differentiated from Shox2:EGFP; Hcn4:mCherry mESCs via the FSK method. c The maximum uplink speed of four different subpopulations. Red, SHOX2+; HCN4+ cells (n = 20); yellow, SHOX2+; HCN4 cells (n = 27); deep blue, SHOX2; HCN4+ cells (n = 17); light blue, SHOX2; HCN4 cells (n = 22). Data were presented as means ± SEM, n indicated the number of recorded cells. d The proportion of different cell types according to AP forms in the sorted subpopulations. Red, cardiac PC; yellow, ALCM; light blue, VLCM. e The If current recording of SHOX2+; HCN4+ cells. Baselines were recorded before adding 1 µM ivabradine into Tyrode’s solution with 1 mM Ba2+. f Activation maps of electrical signal propagation revealed that impulses generated from cardiac PC aggregates. Colormap indicated the origin of impulses generated from the electrode 11. Cardiac PC aggregate was laid next to electrode 11 and propagated electrical signal to pace NMVMs. Red arrows represented the directions of impulse propagation. g Representative raw traces showed the addition of cardiac PC aggregate increased the beating rate. Representative raw traces of the monolayer NMVMs with cardiac PC aggregate were recorded at electrodes 11, 33, and 44 with the speed of 175 b.p.m. h Differentiated cells from the FSK method acted as an ectopic pacemaker in rat atrioventricular conduction block model. Yellow stars indicated the pacemaking sites. Cells were sorted and collected on day 13 differentiation (ae). sAP recording and If current recording were performed on HEKA EPC-10 amplifier (be). Comparisons between multiple groups were performed with a one-way ANOVA test (a) and Kruskal-Wallis rank sum test (c). Statistical significance was indicated as follows: ns not significant; P < 0.05 (*); P < 0.01 (**); P < 0.001 (***); P < 0.0001 (****)
Fig. 4
Fig. 4
Cardiac PC cluster was identified by scRNA-seq during in vitro cardiac PCs differentiation. a Schematic representation of the timeline of sample collection for scRNA-seq (days 5, 8, and 13) (n = 2). b UMAP dimensionality reduction plot of samples on days 5, 8, and 13. 22,527, 11,236, and 28,918 cells were sequenced from days 5, 8, and 13 samples, respectively. c UMAP and clustering of scRNA-seq data identified 16 distinct clusters (VLCM, TC, SHF, Cardiac PC, Primitive streak-derived tissues, Paraxial mesoderm, Pacemaker progenitor cell, Nascent mesoderm, Mesendoderm/epiblast, Immature cardiomyocyte, Fibroblast, Endothelial, Endoderm, CPC, Cardiac fibroblast, and ALCM). Each dot represented an individual cell colored by an annotated cluster. TC transitional cell; SHF second heart field. d Dot plot of cell-specific markers defining each cluster. e UMAP dimensionality reduction plots divided by samples on days 5, 8, and 13. Different colors represent scRNA-seq clusters defined in (c, d). f Violin plots of the normalized unique molecular identifier (UMI) counts for two cardiac PC markers (Shox2 and Hcn4) in days 5, 8, and 13 samples. Each dot in the plot represents one cell. The expression level means the log normalized data. Kruskal–Wallis rank sum test: P < 0.001 (***). g GO (gene ontology) term analysis for the genes upregulated in the Cardiac PC cluster. GO terms with P < 0.05 was considered significant. h UMAPs depicting the expression density of typical PC markers genes (Hcn4, Shox2, Bmp4, and Vsnl1) upregulated in the Cardiac PC cluster
Fig. 5
Fig. 5
Cardiac PCs differentiation trajectory was successfully charted. a Unsupervised transcriptional trajectory of cardiac PCs differentiation, colored by pseudo-time and cell states (States 1–3). b Trajectory reconstruction of cardiac PCs differentiation revealed three branches: pre-branch (State 1), failed branch (State 2), and successful branch (State 3). Colors represented different cell clusters. c The expression of marker genes of three branches. Mesoderm markers: Gsc; cardiac PC markers: Hcn4, Shox2, Tbx18, and Isl1; cardiac fibroblast marker: Col1a1. d The differentially expressed genes along the pseudo-time were divided into six clusters (C1–C6) showing different patterns. The top GO terms of each cluster were shown. Highly expressed TFs of each gene expression cluster were shown. e The expression of representative genes (Nkx2-5, Otx2, Klf6, Nfat5, Zeb1, Zfp503, Shox2, and Tbx20) in the in the pseudo-time trajectory. The expression level means the log normalized data
Fig. 6
Fig. 6
ZFP503 functioned effectively in SHOX2+; HCN4+ cardiac PCs differentiation. a UMAPs depicting the expression density of Zfp503 in the scRNA-seq data. b Violin plot showed Zfp503 expression level at different time points (days 5, 8, and 13) during cardiac PCs differentiation. The expression level means the log normalized data. c The dynamic change of Zfp503 expression at different differentiation time points during cardiac PCs differentiation following the FSK method. Experiments were performed on Shox2:EGFP; Hcn4:mCherry mESC line. Relative to Gapdh expression. Data were presented as means ± SEM from technical triplicates (n = 3). d Dot plot of Zfp503 in different cell clusters in scRNA-seq data. The size and color of the circles represent the gene expression percentage and average expression level, respectively. e qRT-PCR analysis revealed that day 13 SHOX2+; HCN4+ cells enriched Zfp503 expression. Relative to Gapdh expression, normalized to SHOX2; HCN4 cells. Data were presented as means ± SEM from technical triplicates (n = 3). f Expression of ZFP503 in mouse SAN at E15.5. Arrows point to ZFP503+; HCN4+ cells. Scale bar: 50 μm. g The transcriptional expression of Zfp503 on day 8 differentiation after 48 h treatment with different chemicals (0.5 mM Vc, 5 μM IWP2, 0.25 μM RA, 5 μM A83-01, 2 μM BMS493, or AIRC induction). CTRL, cells cultured in RB-i medium only during differentiation days 6–8. Relative to Gapdh expression, normalized to CTRL. Data were presented as means ± SEM from technical triplicates (n = 3). h Phase and live cell fluorescence images of Zfp503 KO Shox2:EGFP; Hcn4:mCherry naïve mESC line (2i/LIF). Scale bar: 200 μm. i Live cell fluorescence images displayed impaired cardiac PCs differentiation in Zfp503 KO Shox2:EGFP; Hcn4:mCherry mESCs by the FSK method on day 13. Scale bar: 200 μm. j Flow cytometry analysis showed Zfp503 KO Shox2:EGFP; Hcn4:mCherry mESCs reduced cardiac PCs differentiation by the FSK method on day 13. WT represented Zfp503+/+ Shox2:EGFP; Hcn4:mCherry cells; KO represented Zfp503 KO Shox2:EGFP; Hcn4:mCherry cells. Data were presented as means ± SEM from biological triplicates (n = 3). k qRT-PCR analysis of the expression of Zfp503, Shox2, and Hcn4 on day 13 differentiation. Relative to Gapdh expression, normalized to differentiated cells on day 13 with Zfp503+/+ Shox2:EGFP; Hcn4:mCherry mESCs. WT represented Zfp503+/+ Shox2:EGFP; Hcn4:mCherry cells; KO represented Zfp503 KO Shox2:EGFP; Hcn4:mCherry cells. Data were presented as means ± SEM from technical triplicates (n = 3). Comparisons between multiple groups were performed with a one-way ANOVA test (e, j, k). P values were calculated using a two-tailed student t-test to compare two groups of data (g). Statistical significance was indicated as follows: ns not significant; P < 0.05 (*); P < 0.01 (**); P < 0.001 (***); P < 0.0001 (****)

References

    1. van Weerd, J. H. & Christoffels, V. M. The formation and function of the cardiac conduction system. Development143, 197–210 (2016). 10.1242/dev.124883 - DOI - PubMed
    1. Anderson, R. H. et al. The anatomy of the cardiac conduction system. Clin. Anat.22, 99–113 (2009). 10.1002/ca.20700 - DOI - PubMed
    1. van Eif, V. W. W., Devalla, H. D., Boink, G. J. J. & Christoffels, V. M. Transcriptional regulation of the cardiac conduction system. Nat. Rev. Cardiol.15, 617–630 (2018). 10.1038/s41569-018-0031-y - DOI - PubMed
    1. Dobrzynski, H., Boyett, M. R. & Anderson, R. H. New insights into pacemaker activity: promoting understanding of sick sinus syndrome. Circulation115, 1921–1932 (2007). 10.1161/CIRCULATIONAHA.106.616011 - DOI - PubMed
    1. Mulpuru, S. K. et al. Cardiac pacemakers: function, troubleshooting, and management: Part 1 of a 2-Part series. J. Am. Coll. Cardiol.69, 189–210 (2017). 10.1016/j.jacc.2016.10.061 - DOI - PubMed

Publication types

MeSH terms

Substances

LinkOut - more resources