. 2024 Sep 5;15(1):7769.
doi: 10.1038/s41467-024-52096-w.

Immune landscape of oncohistone-mutant gliomas reveals diverse myeloid populations and tumor-promoting function

Affiliations

Immune landscape of oncohistone-mutant gliomas reveals diverse myeloid populations and tumor-promoting function

Augusto Faria Andrade et al. Nat Commun. .

Abstract

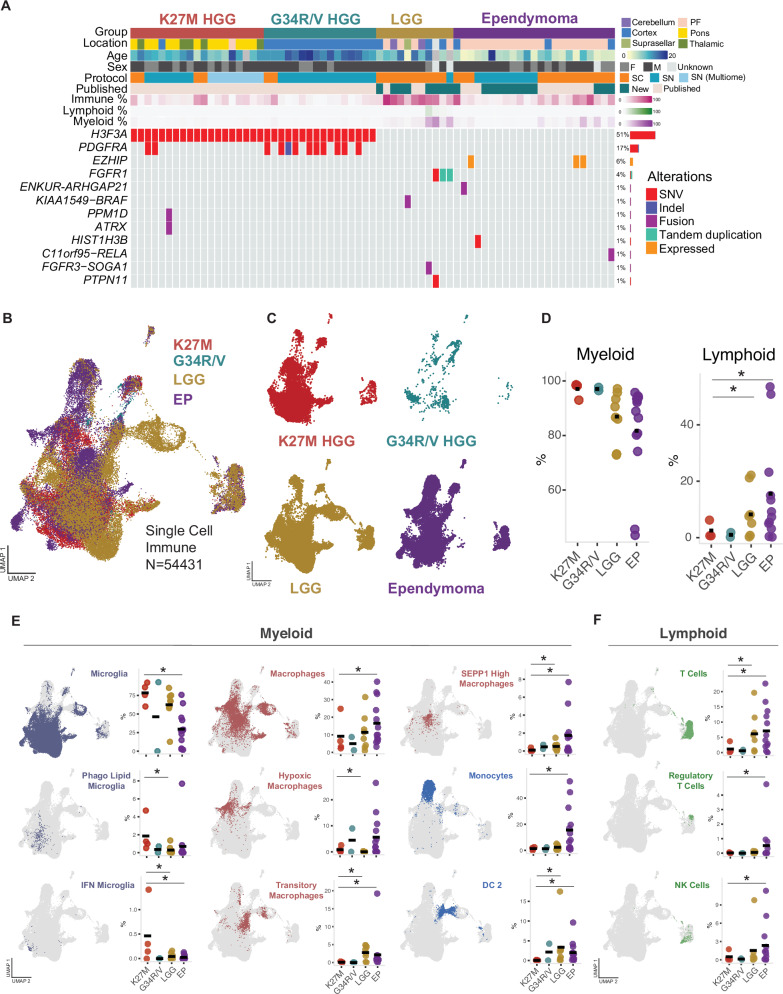
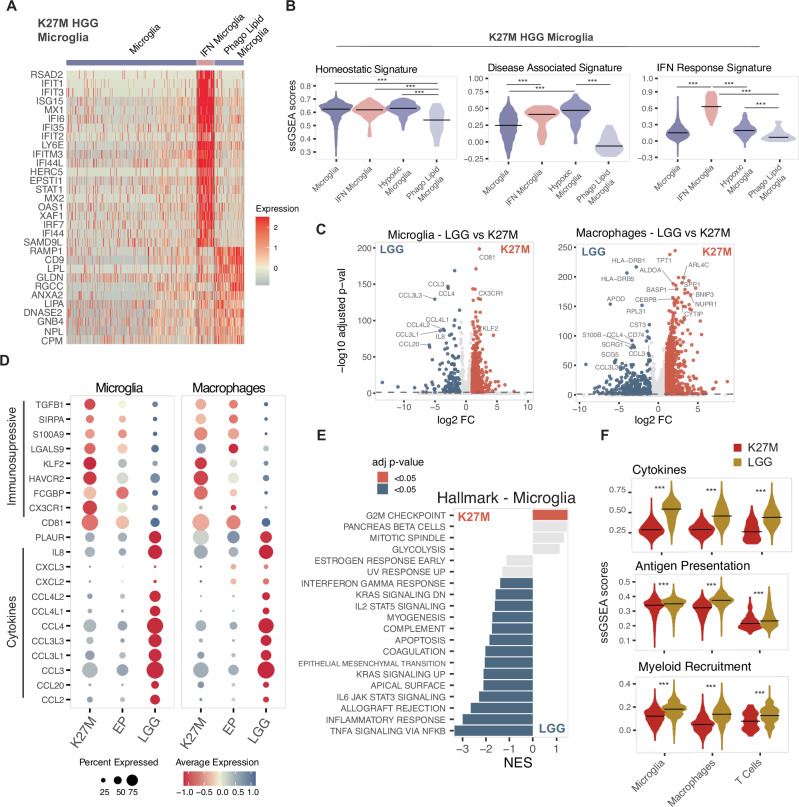
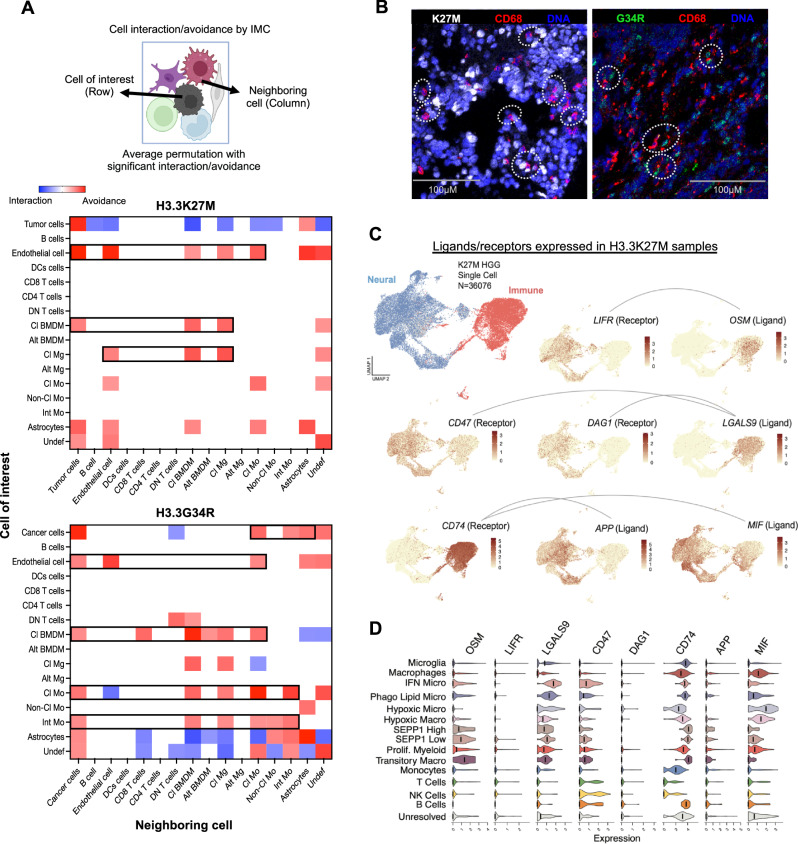
Histone H3-mutant gliomas are deadly brain tumors characterized by a dysregulated epigenome and stalled differentiation. In contrast to the extensive datasets available on tumor cells, limited information exists on their tumor microenvironment (TME), particularly the immune infiltrate. Here, we characterize the immune TME of H3.3K27M and G34R/V-mutant gliomas, and multiple H3.3K27M mouse models, using transcriptomic, proteomic and spatial single-cell approaches. Resolution of immune lineages indicates high infiltration of H3-mutant gliomas with diverse myeloid populations, high-level expression of immune checkpoint markers, and scarce lymphoid cells, findings uniformly reproduced in all H3.3K27M mouse models tested. We show these myeloid populations communicate with H3-mutant cells, mediating immunosuppression and sustaining tumor formation and maintenance. Dual inhibition of myeloid cells and immune checkpoint pathways show significant therapeutic benefits in pre-clinical syngeneic mouse models. Our findings provide a valuable characterization of the TME of oncohistone-mutant gliomas, and insight into the means for modulating the myeloid infiltrate for the benefit of patients.


Conflict of interest statement

The authors declare no competing interests.

Figures

Fig. 1
Fig. 1. Pediatric gliomas are infiltrated with a rich diverse myeloid cell population.
A Oncoprint summarizing single-cell tumor samples, including clinical information, immune cell proportions and genetic alterations. B UMAP of immune cells from 27 pediatric brain tumor samples (H3.3 K27M (N = 4) and G34R (N = 2) mutant gliomas, low-grade gliomas (LGG, N = 8) and ependymomas (EP, N = 13)) by scRNA-seq, with cells colored by projected tumor type. C UMAP of immune cells split by tumor entity. D Proportion of myeloid and lymphoid cells H3.3 K27M (N = 4) vs LGG (N = 8) and H3.3 K27M (N = 4) vs Ependymoma (N = 13) (* denotes adjusted p value < 0.05 and log fold change >1, permutation test; n = 10,000). E Proportions of myeloid cell types and activation states in H3.3 K27M (N = 4) vs LGG (N = 8) and H3.3 K27M (N = 4) vs Ependymoma (N = 13) (* denotes FDR adjusted p value < 0.05 and log fold change >1, permutation test; n = 10,000). F Proportions of lymphoid cell types and activation states in H3.3 K27M (N = 4) vs LGG (N = 8) and H3.3 K27M (N = 4) vs Ependymoma (N = 13) (* denotes adjusted p value < 0.05 and log fold change >1, permutation test; n = 10,000).
Fig. 2
Fig. 2. H3.3 K27M HGG myeloid cells express immunosuppressive genes.
A Expression of differently expressed genes in H3.3K27M HGG microglia populations. B Enrichment (ssGSEA score) for immune gene sets in H3.3K27M HGG microglia populations (*** denotes adjusted p value < 0.0001, two-sided t test). C Differentialy expressed genes between H3.3K27M HGG and LGG microglia and macrophages. Genes with an adjusted p value < 0.05 and log2 fold change >0.5 are shown in red/blue (two-sided Wilcoxon ranked sum tets). D Expression of cytokines and immune checkpoints in H3.3K27M, Ependymoma and LGG. E Pathway analysis (MSigDB Hallmarks) for H3.3K27M microglia compared to LGG microglia. Significant pathways (adjusted p value < 0.05, GSEA Kolmogorov-Smirnov test) shown in red/blue. F Enrichment (ssGSEA score) for immune gene sets in H3.3K27M HGG and LGG microglia, macrophage and T-cell populations (*** denotes adjusted p value < 0.0001, two-sided t test).
Fig. 3
Fig. 3. IMC reveals microglia and bone-marrow derived macrophage populations as the main infiltrated-immune cells in pediatric histone mutant tumors.
A Schematic representation of the approaches used to profile the immune infiltration of human H3.3K27M and H3.3G34R mutant tumors by IMC. B Cell lineage assignment tree. Cancer cells were identified using K27M and G34R markers. Cell surface markers were used to identify and classify the immune cells. Glial fibrillary acidic protein (GFAP) positive cells were annotated as astrocytes and cells negative for the markers mentioned were annotated as undefined (not represented in the image). Cl Classic, Alt Alternative. Panels (A, B) created with BioRender.com, released under a Creative Commons Attribution-NonCommercial-NoDerivs 4.0 International license. C Representative image of in silico cell annotation. All samples were annotated using the same approach. DE Representative multichannel IMC images. Histone H3 mutation status was confirmed for all samples. K27M (green) and G34R (red) markers were used to identify cancer cells. K27me3 (red in D) is reduced in K27M positive cells. DNA in blue. F Cell composition and (G). Percentage of immune populations per tumor type identified by IMC, H3.3K27M (N = 7) and H3.3G34R (N = 5). H–I Representative multichannel IMC images of microglia (CD68+ P2Y12+ ), BMDM (CD68+ P2Y12-), monocytes (CD14+ CD16+ ) and T cells (CD3+ ) identified in H3.3K27M and H3.3G34R patient samples.
Fig. 4
Fig. 4. Mutant H3.3K27M and G34R cell interactions in the TME.
A Heat map indicates IMC spatial analysis among cell phenotypes and their patterns of cell-cell interactions (red) or avoidance (blue) for H3.3K27M (top) and H3.3G34R (bottom) tumors, determined by pairwise scores. Only interaction/avoidance >50% (random chance) are shown. Associations should be read row-to-column. Rows represent the relationship of a cell type of interest. Columns represent the relationship of other surrounding cell types. Panel illustrating cell interactions created with BioRender.com, released under a Creative Commons Attribution-NonCommercial-NoDerivs 4.0 International license. B Representative multichannel IMC images of myeloid cells (CD68+ ) interacting with K27M and G34R cells. C UMAP plots colored by expression of ligand or receptor pairs in H3.3K27M tumors (N = 4). Both immune and non-immune cells were used to predict ligand-receptor interactions. D Expression of ligand-receptor pairs in H3.3K27M immune cell populations.
Fig. 5
Fig. 5. H3.3K27M syngeneic mouse model results in a highly penetrant model that recapitulates human tumors.
A IHC immune markers from previous established H3K27M models (Pathania et al. and Golbourn et al). KD knockdown, oe overexpression. B IHC immune markers of tumors arose in humanized CD34+ mice (N = 2) engrafted with human SU-DIPGXIII cells (700,000 cells injected in the pons). C Schematic representation of the generation of H3.3K27M syngeneic mouse model. In utero electroporation (IUE) was used to deliver piggyBac transposable elements and gRNA/Cas9 into lower rhombic lip NPCs, using E12.5 embryos of C57Bl6/J (BL6) mice. IUE de novo tumors were used to establish cell line models. GFP+ cells were isolated and sorted. Cells were expanded in vitro and able to be engrafted and grown in immunocompetent C57Bl6/J mice. 4-hit established cell line was used for serial transplantations experiments in C57Bl6/J. GFP+ tumor regions were dissociated and single cells re-engrafted into secondary hosts. Panel created with BioRender.com, released under a Creative Commons Attribution-NonCommercial-NoDerivs 4.0 International license. D IHC immune markers using de novo 4-hit engrafted model. E Overall survival curve of engrafted C57Bl6/J mice. 4-hit cells (150 or 350k, N = 5 each) were injected in the pons or thalamus (thal) of mice. F Cell frequencies by flow CyTOF analysis (percentage of CD45+ live cells) from 4-hit tumors injected in the pons or thalamus of mice (N = 3). G Representative IHC images of lymphocytic (CD3), and myeloid (F4/80) markers using H3.3K27M 4-hit model, engrafted in the pons and thalamus of C57Bl6/J mice.
Fig. 6
Fig. 6. Myeloid recruitment is a major event in K27M tumor formation and is associated with anti-PD1 response in mouse tumors.
A Overall survival of C57Bl6/J mice from serial transplantation experiments using the 4-hit established cell line model. Log-rank test ***p = 0.001. Engraftment 1 (N = 12) cohort was generated using in vitro cultured cells. Engraftment 2 (N = 10) cohort was generated from Engraftment 1 dissociated tumors. Lastly, Engraftment 2 tumors were dissociated and injected into new hosts, generating the Engraftment 3 (N = 5) cohort. B t-SNEs from CyTOF immune infiltration profiles. t-SNEs map representing entire cell populations identified (N = 3). C Percentage of CD45+ live cells in 4-hit serial engraftment by flow CyTOF analysis (Engraftment 1 N = 3, Engraftment 2 N = 5, Engraftment 3 N = 3). Data are presented as mean values ± SEM. D Cell frequencies from Engraftment 1, 2 and 3 tumors. E Schema of drug treatment and overall survival of C57Bl6/J mice treated with anti-CSF1R and/or anti-PD1. Mice were treated with isotypes (Vehicle, N = 16), anti-CSF1R antibody (N = 13) (three doses of 300 µg, during one week), anti-PD1 antibody (4H2, N = 6) (two doses of 200 µg per week, during four weeks), and the combination of anti-CSF1R+anti-PD1 (N = 14). F Mice were also treated for four weeks with anti-CSF1R antibody alone (N = 8) (three doses of 300 µg), anti-CSF1R+anti-PD1 (N = 7) or the Vehicles (N = 7). Two mice treated with the combination developed tumors and were used to assess the tumor immune infiltrate. Panels (E, F) created with BioRender.com, released under a Creative Commons Attribution-NonCommercial-NoDerivs 4.0 International license. G IHC representative images for CD3+ lymphocytic and F4/80+ myeloid markers and (H). Immune clusters identified by flow CyTOF analysis from tumors found at endpoint in mice treated with anti-CSF1R alone or combined with anti-PD1, during four weeks (cohort from panel F). Vehicle: N = 4, anti-CSF1R: N = 3, anti-CSF1R + PD1: N = 2. Data are presented as mean values ± SEM.

References

    1. Ostrom, Q. T., Cioffi, G., Waite, K., Kruchko, C. & Barnholtz-Sloan, J. S. CBTRUS statistical report: primary brain and other central nervous system tumors diagnosed in the United States in 2014–2018. Neuro Oncol.23, iii1–iii105 (2021). 10.1093/neuonc/noab200 - DOI - PMC - PubMed
    1. Schwartzentruber, J. et al. Driver mutations in histone H3.3 and chromatin remodelling genes in paediatric glioblastoma. Nature482, 226–231 (2012). 10.1038/nature10833 - DOI - PubMed
    1. Wu, G. et al. Somatic histone H3 alterations in pediatric diffuse intrinsic pontine gliomas and non-brainstem glioblastomas. Nat. Genet44, 251–253, (2012). 10.1038/ng.1102 - DOI - PMC - PubMed
    1. Harutyunyan, A. S. et al. H3K27M induces defective chromatin spread of PRC2-mediated repressive H3K27me2/me3 and is essential for glioma tumorigenesis. Nat. Commun.10, 1262 (2019). 10.1038/s41467-019-09140-x - DOI - PMC - PubMed
    1. Lewis, P. W. et al. Inhibition of PRC2 activity by a gain-of-function H3 mutation found in pediatric glioblastoma. Science340, 857–861 (2013). 10.1126/science.1232245 - DOI - PMC - PubMed

Publication types

MeSH terms

Associated data