. 2024 Sep 5;15(1):7776.
doi: 10.1038/s41467-024-51784-x.

RAD52 resolves transcription-replication conflicts to mitigate R-loop induced genome instability

Affiliations

RAD52 resolves transcription-replication conflicts to mitigate R-loop induced genome instability

Manisha Jalan et al. Nat Commun. .

Abstract

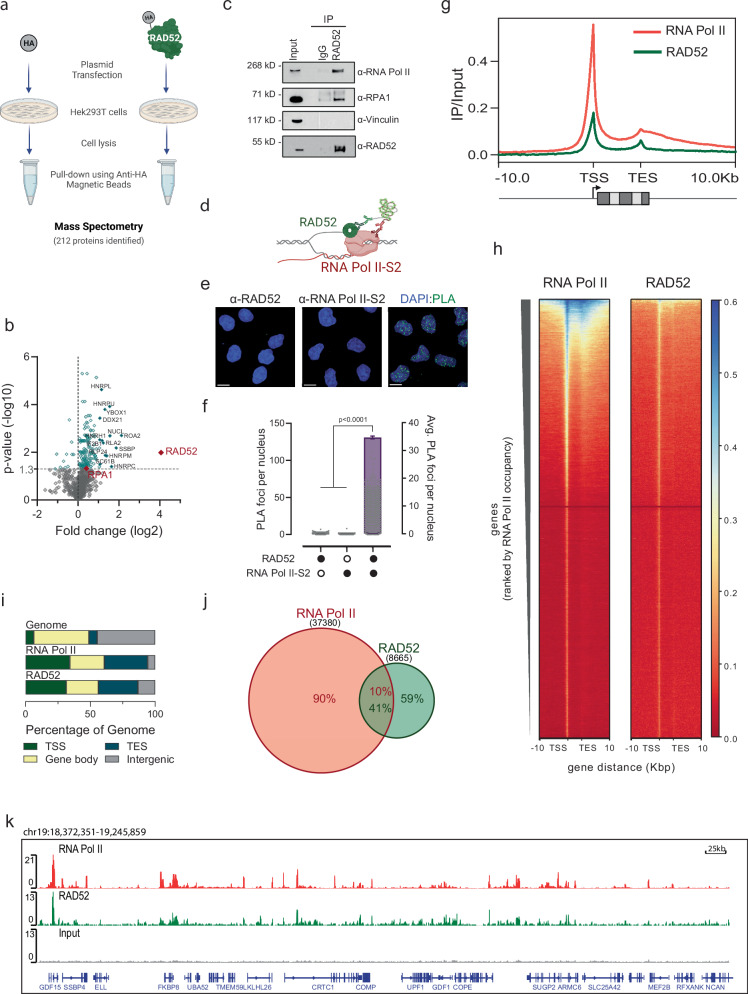
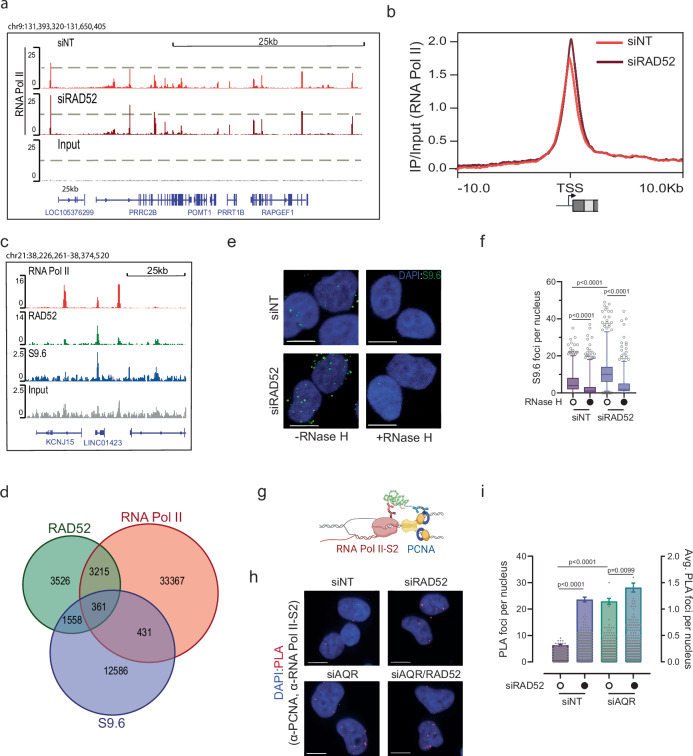
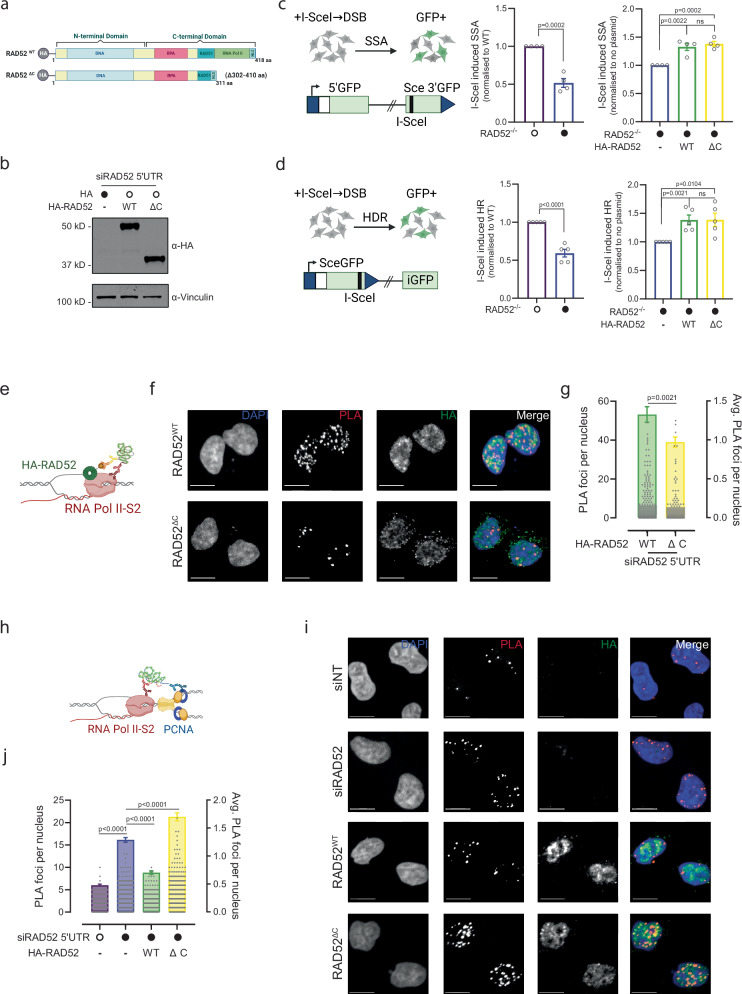
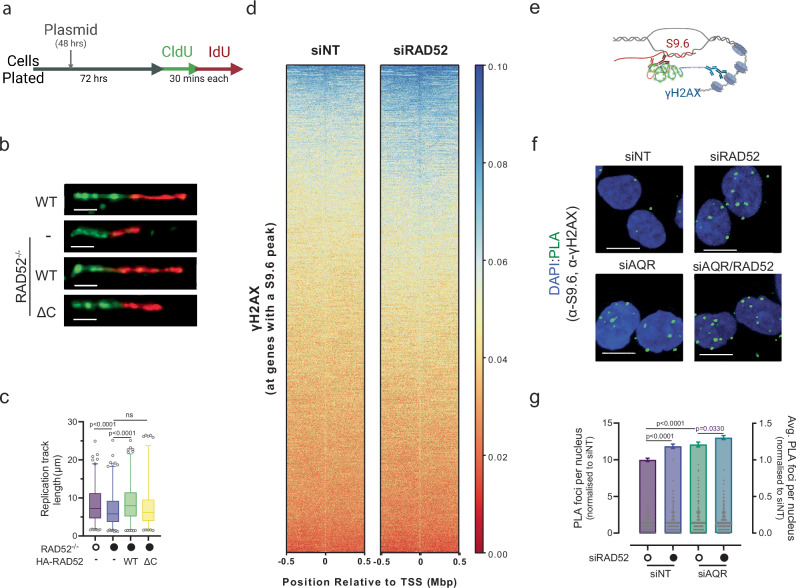
Collisions of the transcription and replication machineries on the same DNA strand can pose a significant threat to genomic stability. These collisions occur in part due to the formation of RNA-DNA hybrids termed R-loops, in which a newly transcribed RNA molecule hybridizes with the DNA template strand. This study investigated the role of RAD52, a known DNA repair factor, in preventing collisions by directing R-loop formation and resolution. We show that RAD52 deficiency increases R-loop accumulation, exacerbating collisions and resulting in elevated DNA damage. Furthermore, RAD52's ability to interact with the transcription machinery, coupled with its capacity to facilitate R-loop dissolution, highlights its role in preventing collisions. Lastly, we provide evidence of an increased mutational burden from double-strand breaks at conserved R-loop sites in human tumor samples, which is increased in tumors with low RAD52 expression. In summary, this study underscores the importance of RAD52 in orchestrating the balance between replication and transcription processes to prevent collisions and maintain genome stability.


Conflict of interest statement

S.F.B. owns equity in, receives compensation from, and serves as a consultant for and serves on the Scientific Advisory Board (SAB) and Board of Directors (BOD) of Volastra Therapeutics Inc and he serves on the scientific advisory board of Meliora Therapeutics. J.S.R.-F. reports current employment at AstraZeneca and stocks in AstraZeneca, Repare Therapeutics, Paige.AI; J.S.R.-F. previously held a fiduciary role in Grupo Oncoclinicas and was a consultant with Goldman Sachs Merchant Banking, Bain Capital, Repare Therapeutics, Paige.AI, Volition Rx and MultiplexDx. S.N.P. reports consulting fees from the following companies outside the scope of this study: Varian Medical Systems, Philips Healthcare and AstraZeneca, as well as research funding from Philips Healthcare and Varian Medical Systems. The remaining authors declare no competing interests.

Figures

Fig. 1
Fig. 1. RAD52 association with the transcriptional complex.
a Schematic representation of the workflow for the identification of RAD52 interacting proteins. HA-control and HA-RAD52 immunoprecipitation was performed in HEK293T cells using α-HA tagged magnetic beads for the pulldown followed by Mass spectrometry (MS). b Volcano plot of the proteins identified in RAD52 IP-MS in n = 3 biologically independent experiments. Mean log2 fold change in protein intensities on the x-axis of all replicates between HA and HA-RAD52 are plotted against the −log10 adjusted p-value (Student’s two-sided t-test with equal variance) on the y-axis. 212 proteins were identified to be significantly enriched. Significantly enriched proteins in blue (p < 0.05) and non-significant in grey. c Co-immunoprecipitation of endogenous RAD52 binding proteins in HeLa cells. RAD52 and IgG antibodies were used to immuno-precipitate proteins and analyzed by immunoblotting with indicated antibodies. Results reproducible for at least 2 biological replicates. d Schematic representation of PLA to visualize proximity of RAD52 protein and RNA Pol II. e Representative images of the nuclear PLA foci (α-RAD52: α-RNA Pol II S2) across stated conditions (Scale bar 10 µM). f Quantitative analysis of nuclear PLA foci from (e) Data are plotted as mean ± SEM. The data presented shows ≥ 500 nuclei from 3 biological replicates; p-values calculated using unpaired two tailed t-tests. g Metagene plots showing the distribution of the RNA Pol II and RAD52 Chromatin immunoprecipitation sequencing (ChIP-seq) peaks (IP/input) in HeLa cells across genes and the flanking regions ( ± 10 kb). TSS: Transcription Start Site, TES: Transcription End Site. h Heatmap representing RNA Pol II and RAD52 ChIP-seq tracks, centered at the TSS and TES ± 10 kb, and rank-ordered according to RNA Pol II occupancy. i Bar chart showing how RNA Pol II and RAD52 peaks are distributed across different genomic regions as indicated. Peaks were obtained with MACS2. Genome wide distribution is shown on top for comparison. j Venn diagram showing the overlap of peaks RNA Pol II ChIP and RAD52 ChIP according to MACS2 across the genome. k A representative snapshot of chromosome 19 depicting RNA Pol II (red) and RAD52 (green) ChIP binding sites in control HeLa cells. Input DNA (grey) represents a negative control for background normalization. Schematics in Fig. 1 (a) and (d) were created with BioRender.com released under a Creative Commons Attribution-NonCommercial-NoDerivs 4.0 International license. Source data are provided as a Source Data file.
Fig. 2
Fig. 2. Loss of RAD52 increases R-loop formation and exacerbates transcription-replication conflicts.
a Representative snapshot of chromosome 9 depicting RNA Pol II occupancy from ChIP-seq analysis (IP/input) in siNT (red) and siRAD52 (dark red) transfected HeLa cells. (b) Metagene plot showing the distribution of the RNA Pol II occupancy at the TSS and flanking regions ( ± 10 kb) of genes with overlapping RNA Pol II and RAD52 peaks. Plots shown: siNT (control) and siRAD52 transfected HeLa cells. (c) ChIP-seq of RNA Pol II (red), RAD52 (green) and S9.6 (R-loops; blue) occupancy in control HeLa cells. Representative snapshot of chromosomes 21 are shown. Input (grey) DNA as negative control for background normalization. d Venn diagram of the percentage of genes overlapping with RNA Pol II, RAD52 and S9.6 ChIP peaks (MACS2). e Representative images of S9.6 immunostaining to detect R-loops in siNT (control) and siRAD52 transfected HeLa cells. RNase H treatment was added as a negative control to eliminate R-loops (Scale bar 10 µM). f Quantitative analysis of nuclear S9.6 foci across stated conditions from (e). Data plotted as box and whiskers. Boxes extend from the 25th–75th percentiles, with the median displayed as a line. The whiskers mark the minimum (1 percentile) and maximum (99th percentile). The data presented shows ≥ 500 nuclei from 3 biological replicates; p-values calculated using unpaired two tailed t-tests. g Schematic representation of PLA to visualize proximity of PCNA and RNA Pol II to measure TRCs. The schematic illustration was created with BioRender.com released under a Creative Commons Attribution-NonCommercial-NoDerivs 4.0 International license. h Representative images of the nuclear PLA foci (α-PCNA: α-RNA Pol II S2) across stated conditions (Scale bar 10 µM). i Quantitative analysis of nuclear PLA foci from (h). Data are plotted as mean ± SEM. The data presented shows ≥ 500 nuclei from 3 biological replicates; p-values calculated using unpaired two tailed t-tests. Source data are provided as a Source Data file.
Fig. 3
Fig. 3. C-terminal domain of RAD52 is essential for the prevention of transcription-replication conflicts.
a Schematics of the domain structures of wild type (WT) - RAD52 protein and C-terminal (ΔC) deleted RAD52 (Δ302-410 amino acids). From N-terminal to C-terminal, RAD52 protein has DNA binding domain, RPA binding domain, RAD52 binding domain, RNA Pol II binding domain and a nuclear localization signal (NLS). The domains are not drawn to scale. b Western blot confirming the expression of HA-RAD52WT and HA-RAD52ΔC. Results reproducible for at least 2 biological replicates. c (Left) Scheme of the single stranded annealing (SSA) reporter system: The SSA-GFP reporter contains a 5′ fragment of the GFP (5′-GFP) gene, and a 3′ fragment of the GFP (3′-GFP) with an I-SceI site. Repair of the I-SceI-induced DSB by SSA leads to formation of GFP+ cells. (Middle) Quantification of SSA repair assay in WT and RAD52−/− HCT116 cells. (Right) Quantification of SSA repair assay in RAD52−/− HCT116 cells with overexpression of either RAD52WT or RAD52ΔC (n = 4 biological replicates). d (Left) Scheme of the homology dependent recombination (HDR) reporter system The HDR-GFP reporter system contains the GFP gene interrupted by a I-SceI site, and a fragment of the GFP with truncated 3′- and 5′-terminus. Repair of the I-SceI-induced DSB by HDR leads to formation of GFP+ cells. (Middle) Quantification of HDR repair assay in WT and RAD52−/− HCT116 cells. (Right) Quantification of HDR repair assay in RAD52−/− HCT116 cells with overexpression of either RAD52WT or RAD52ΔC. (n = 5 biological replicates). e Schematic representation of PLA to visualize proximity of HA-tagged RAD52 (HA-RAD52) and RNA Pol II. f Representative images of the nuclear PLA foci (α-HA: α-RNA Pol II S2) across stated conditions with overexpression of either RAD52WT or RAD52ΔC (Scale bar 10 µM). g Quantitative analysis of nuclear PLA foci across stated conditions described in (f). The data presented shows ≥ 500 nuclei from 3 biological replicates. h Schematic representation of PLA to visualize proximity of PCNA and RNA Pol II to measure TRCs. i Representative images of the nuclear PLA foci (α-PCNA: α-RNA Pol II S2) across stated conditions with overexpression of either RAD52WT or RAD52ΔC in HeLa cells (Scale bar 10 µM). j Quantitative analysis of nuclear PLA foci from across stated conditions described in (i). The data presented shows ≥ 500 nuclei from 3 biological replicates. In Fig. 3 (c) (d) (g) and (j), data are plotted as mean ± SEM and p-values calculated using unpaired two tailed t-tests. Schematics in Fig. 3 (a) (c) (d) (e) and (h) were created with BioRender.com released under a Creative Commons Attribution-NonCommercial-NoDerivs 4.0 International license. Source data are provided as a Source Data file.
Fig. 4
Fig. 4. RAD52 recruits TOP2A to mitigate transcription-replication conflicts.
a Schematic representation of PLA to visualize proximity of RAD52 and TOP2A. b Representative images of the nuclear PLA foci (α-RAD52: α-TOP2A) in siNT (control) and siAQR transfected HeLa cells (Scale bar 10 µM). c Quantitative analysis of nuclear PLA foci across stated conditions described in (b). The data presented shows ≥ 500 nuclei from 3 biological replicates. d Schematic representation of PLA to visualize proximity of HA-tagged RAD52 (HA-RAD52) and TOP2A. e Representative images of the nuclear PLA foci (α-HA: α-TOP2A) in siRAD52 (5’UTR) transfected HeLa cells with overexpression of either RAD52WT or RAD52ΔC (Scale bar 10 µM). f Quantitative analysis of nuclear PLA foci across stated conditions described in (e). The data presented shows ≥ 500 nuclei from 3 biological replicates. g Representative images of S9.6 immunostaining to detect R-loops in siNT (control) and siTOP2A transfected HeLa cells. RNase H treatment was added as a negative control to eliminate R-loops (Scale bar 10 µM). h Quantitative analysis of nuclear S9.6 foci across stated conditions from (g). Data plotted as box and whiskers. Boxes extend from the 25th to 75th percentiles, with the median displayed as a line. The whiskers mark the minimum (1 percentile) and maximum (99th percentile). The data presented shows ≥ 500 nuclei from 3 biological replicates; p-values calculated using unpaired two tailed t-tests. i Schematic representation of PLA to visualize proximity of PCNA and RNA Pol II to measure TRCs. j Representative images of the nuclear PLA foci (PCNA: RNA Pol II S2) in siNT (control) and siTOP2A transfected HeLa cells (Scale bar 10 µM). k Quantitative analysis of nuclear PLA foci across stated conditions described in (j). The data presented shows ≥ 500 nuclei from 3 biological replicates (l) Schematic representation of PLA to visualize proximity of S9.6 and TOP2A. m Representative images of the nuclear PLA foci (α-S9.6: α-TOP2A) in siNT (control), siRAD52 and siAQR transfected HeLa cells (Scale bar 10 µM). n Quantitative analysis of nuclear PLA foci across stated conditions described in (m) normalized to siNT. The data presented shows ≥ 500 nuclei from 3 biological replicates. o Mechanistic model of RAD52 role in preventing transcription-replication conflicts. In Fig. 4 (ck) and (n), data are plotted as mean ± SEM and p-values calculated using unpaired two tailed t-tests. Schematics in Fig. 4 (a) (d) (i) (l) and (o) were created with BioRender.com released under a Creative Commons Attribution-NonCommercial-NoDerivs 4.0 International license. Source data are provided as a Source Data file.
Fig. 5
Fig. 5. Loss of RAD52 causes replication stress and increased DNA damage.
a Schematic representation of DNA fiber assay performed in HCT116 wild type (WT) and RAD52 knockout cells (RAD52-/-) cells with plasmid overexpression of either RAD52WT or RAD52ΔC followed by incubation with 5-Chloro-2′-deoxyuridine (CldU) and 5-iodo-2′-deoxyuridine (IdU) for 30 min each to label nascent DNA. b Representative images of DNA fiber images in HCT116 WT and RAD52-/- cells with overexpression of either RAD52WT or RAD52ΔC (Scale bar 2 µM). (c) Measurement of DNA fiber lengths across stated conditions described in (b) to measure replication rates. Data plotted as box and whiskers. Boxes extend from the 25th to 75th percentiles, with the median displayed as a line. The whiskers mark the minimum (1 percentile) and maximum (99th percentile). The data presented shows ≥100 DNA fibers from 3 biological replicates; p-values calculated using unpaired two tailed t-tests. d Heat map of the intensity of γH2AX ChIP signals (siNT and siRAD52 transfected HeLa cells) at genes that have a detectable R-loop peak as determined in Supplementary Fig. 6b. The γH2AX occupancy is displayed relative to the TSS ± 0.5 Mb. e Schematic representation of PLA to visualize proximity of S9.6 and γH2AX. f Representative images of the nuclear PLA foci (α-S9.6: α-γH2AX) in siNT (control), siRAD52 and siAQR transfected HeLa cells (Scale bar 10 µM). g Quantitative analysis of nuclear PLA foci across stated conditions described in (f). Data are plotted as mean ± SEM. The data presented shows ≥ 500 nuclei from 3 biological replicates; p-values calculated using unpaired two tailed t-tests.  Schematics in Fig. 5 (a) and (e) were created with BioRender.com released under a Creative Commons Attribution-NonCommercial-NoDerivs 4.0 International license. Source data are provided as a Source Data file.
Fig. 6
Fig. 6. Increased mutational burden and genomic instability associated with R-loops were observed in human tumor samples.
a The genomic distribution of the consensus R-loop dataset as identified in Supplementary Fig. 7b. Various genomic regions are color coded according to the labels on the bottom. The expected distribution in case peaks were randomly positioned in the genome is shown for comparison. TTS and TES are significantly enriched in the R-loop dataset (P < 0.001) as determined by the Fisher’s exact test. b Circos plots showing structural variations and genomic alterations caused by breakpoints enriched in R-loop (right) forming regions versus non-R-loop regions (left). ce Genomic windows depicting the frequencies of single nucleotide variants (SNV-left), long InDels > 1 bp (middle) and structural variants (SV-right), analyzed at R-loop vs non-R-loop across various cancer types. The horizontal coordinate represents different types of cancers and vertical coordinates represents coverage at all genomic regions, TSS and TES. Data is quantified by log fold change between mutational burden at R-loop versus non-R-loop regions. fh Quantification of the average number of SNVs, Long indels, SVs per Mb of genome at TSS and TES in R-loop versus non-R-loop forming regions. Data are plotted as mean ± SEM; p-values calculated using unpaired two tailed t-tests. i Schematic to show the two types of TRCs: co-directional collisions (top) and Head on collision (bottom). The schematic illustration was created with BioRender.com released under a Creative Commons Attribution-NonCommercial-NoDerivs 4.0 International license. j Quantification of the percentage of collisions occur at R-loop sites in terms of co-directional collisions and head-on collisions. Data are plotted as a bar graph with absolute percentage. (Fisher’s exact test). k Quantification of the comparison of average number of alterations per Mb of genome which are mapped to collision sites between CD and HO. Data are plotted as mean ± SEM. p-values were calculated by two-sided non-parametric Mann–Whitney test. l Quantification of the comparison of average number of alterations per Mb of genome at R-loop sites between tumors with high and low expression of RAD52. Tumors were categorized as expressing low (RAD52 low; bottom quartile) or high levels of RAD52 mRNA (RAD52 high; top quartile). Data plotted as box and whiskers. Boxes extend from the 25th to 75th percentiles, with the median displayed as a line. The whiskers mark the minimum (5th percentile) and maximum (95th percentile). (n = 95 (RAD52 high), n = 94 (RAD52 low)); p-values calculated using unpaired two tailed t-tests. Source data are provided as a Source Data file.

References

    1. Gómez-González, B. & Aguilera, A. Transcription-mediated replication hindrance: a major driver of genome instability. Genes Dev.33, 1008–1026 (2019). 10.1101/gad.324517.119 - DOI - PMC - PubMed
    1. Goehring, L., Huang, T. T. & Smith, D. J. Transcription–replication conflicts as a source of genome instability. Annu. Rev. Genet.57, 157–179 (2023). 10.1146/annurev-genet-080320-031523 - DOI - PMC - PubMed
    1. Thomas, M., White, R. L. & Davis, R. W. Hybridization of RNA to double-stranded DNA: formation of R-loops. Proc. Natl Acad. Sci. USA73, 2294–2298 (1976). 10.1073/pnas.73.7.2294 - DOI - PMC - PubMed
    1. Petermann, E., Lan, L. & Zou, L. Sources, resolution and physiological relevance of R-loops and RNA–DNA hybrids. Nat. Rev. Mol. Cell Biol.23, 521–540 (2022). 10.1038/s41580-022-00474-x - DOI - PubMed
    1. Crossley, M. P., Bocek, M. & Cimprich, K. A. R-loops as cellular regulators and genomic threats. Mol. Cell73, 398–411 (2019). 10.1016/j.molcel.2019.01.024 - DOI - PMC - PubMed

Publication types

Associated data