. 2024 Sep 5;15(1):7751.
doi: 10.1038/s41467-024-52097-9.

Gut metagenomes of Asian octogenarians reveal metabolic potential expansion and distinct microbial species associated with aging phenotypes

Affiliations

Gut metagenomes of Asian octogenarians reveal metabolic potential expansion and distinct microbial species associated with aging phenotypes

Aarthi Ravikrishnan et al. Nat Commun. .

Abstract

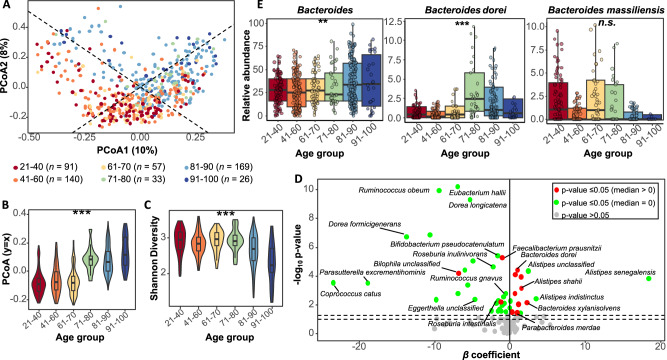
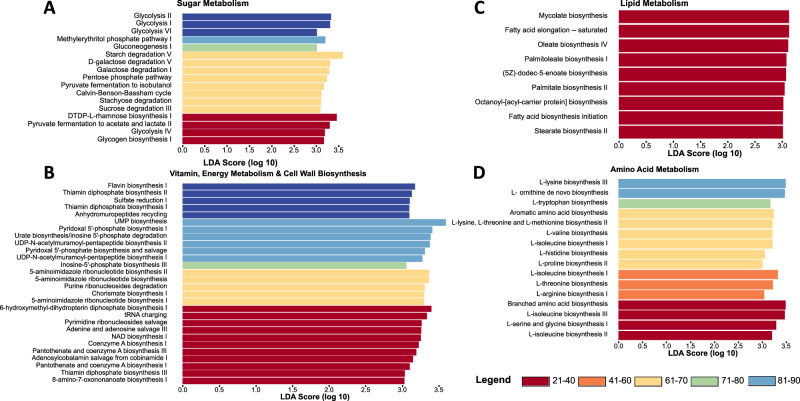
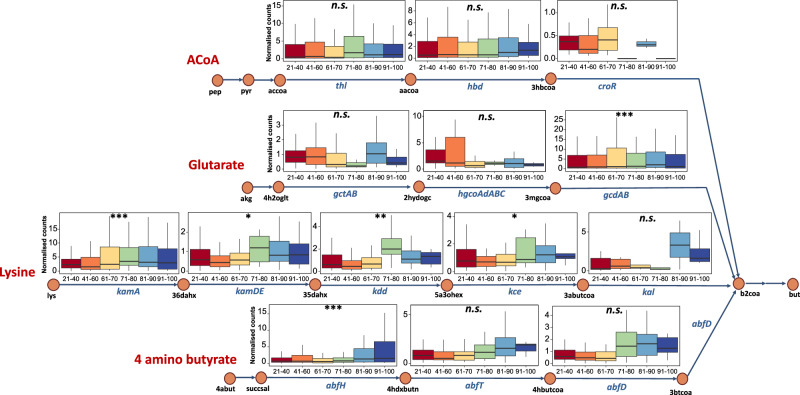
While rapid demographic changes in Asia are driving the incidence of chronic aging-related diseases, the limited availability of high-quality in vivo data hampers our ability to understand complex multi-factorial contributions, including gut microbial, to healthy aging. Leveraging a well-phenotyped cohort of community-living octogenarians in Singapore, we used deep shotgun-metagenomic sequencing for high-resolution taxonomic and functional characterization of their gut microbiomes (n = 234). Joint species-level analysis with other Asian cohorts identified distinct age-associated shifts characterized by reduction in microbial richness, and specific Alistipes and Bacteroides species enrichment (e.g., Alistipes shahii and Bacteroides xylanisolvens). Functional analysis confirmed these changes correspond to metabolic potential expansion in aging towards alternate pathways synthesizing and utilizing amino-acid precursors, vis-à-vis dominant microbial guilds producing butyrate in gut from pyruvate (e.g., Faecalibacterium prausnitzii, Roseburia inulinivorans). Extending these observations to key clinical markers helped identify >10 robust microbial associations to inflammation, cardiometabolic and liver health, including potential probiotic species (e.g., Parabacteroides goldsteinii) and pathobionts (e.g., Klebsiella pneumoniae), highlighting the microbiome's role as biomarkers and potential targets for promoting healthy aging.


Conflict of interest statement

The authors declare no competing interests.

Figures

Fig. 1
Fig. 1. Aging-associated shifts in gut microbiome richness and relative abundance of key species.
A Principal coordinates analysis (PCoA) plot based on species-level Bray–Curtis dissimilarity of gut microbiome profiles across age groups after batch correction. Dashed lines indicate the y = x and y = –x axes. B, C Violin plots showing the distribution across age groups. B PCoA1 and PCoA2 values projected on the y = x axes (n = 516 independent samples; The symbol ‘***’ represents p-value < 0.005, obtained from two-sided test with Ordinal logistic regression across all age groups, p-value 8.09 × 10–33). In all the inset boxplots, the center line represents the median, box limits represent upper and lower quartiles, and whiskers represent minimum and maximum values. C Shannon diversity indices; The symbol ‘***’ represents p-value < 0.005, obtained from two-sided test with Ordinal logistic test using n = 516 independent samples across all age groups, p-value 1.58 × 10–12). In all the inset boxplots, the center line represents the median, box limits represent upper and lower quartiles, and whiskers represent minimum and maximum values. Data points that are either less than Q1–1.5 × IQR or more than Q3 + 1.5 × IQR, where Q1, Q3 and IQR refers to the first quartile, third quartile and interquartile range, respectively, were removed for this analysis to reduce the impact of outliers. D Volcano plot showing the β coefficient on the x-axis and FDR-adjusted –log10 p-values (FDR-adjusted using Benjamini–Hochberg test, p-values obtained with two-sided tests from Generalized Linear Model (GLM) for taxa association with age) on the y-axis. Points for statistically significant taxa from “high stringency list” and those with high beta coefficients are highlighted in the volcano plot as red colored points for median abundance in the SG90 cohort greater than zero and green otherwise, with non-significant taxa shown with grey dots. E Relative abundance boxplots for the Bacteroides genus, and corresponding species that was identified to be associated significantly and not significantly with age. The symbols “n.s.”, “*” and “***” represent p-value > 0.05, p-value ≤ 0.05 and p-value < 0.005, respectively (GLM for taxa association with age using n = 516 independent samples; FDR-adjusted p-value using Benjamini–Hochberg test; Bacteroides: 6.4 × 10–3, B. dorei: 7.61 × 10–5). In all boxplots, the center line represents the median, box limits represent upper and lower quartiles, and whiskers represent minimum and maximum values (outlier points are not included in the visualization). Source data are provided as a Source Data file.
Fig. 2
Fig. 2. Associations of microbial metabolic pathways across age groups.
Bar plot showing pathways that are significantly associated and enriched specifically in different age groups (p-value ≤ 0.05, two-sided Wilcoxon rank-sum test) based on LEfSe analysis. Pathways were grouped into the broad categories of (A) Sugar metabolism, B Vitamin, energy metabolism and cell wall biosynthesis, C Lipid metabolism and (D) Amino acid metabolism. The effect size is depicted in the form of an LDA Score (log 10). Source data are provided as a Source Data file.
Fig. 3
Fig. 3. Differential representation of butyrate synthesis pathways in gut metagenomes across age groups.
Pathway diagram where nodes represent major metabolites involved in various steps of butyrate production (but) starting from 4 different precursors (pyruvate, glutarate, lysine and 4-aminobutyrate), and edges are labelled with the genes involved in the conversion. Boxplots present normalized counts for the corresponding gene across different age groups (n = 516 independent samples). The labels “n.s.”, “*”, “**” and “***” represent p-value > 0.05, p-value ≤ 0.05, p-value < 0.01 and p-value < 0.001, respectively (two-sided tests using GLM for gene association with age with FDR-adjustment using Benjamini–Hochberg test per pathway; gcdAB – 2.68 × 10–16, kamA – 9.97 × 10–5, kamDE – 1.65 × 10–2, kdd – 1.51 × 10–3, kce – 1.65 × 10–2, abfH – 3.93 × 10–6). In all the boxplots, the center line represents the median, box limits represent upper and lower quartiles, and whiskers represent minimum and maximum values. Expansions of the abbreviated metabolites are as follows: pep - Phosphoenolpyruvate, pyr - Pyruvate, accoa - Acetyl-CoA, aacoa - Acetoacetyl-CoA, 3hbcoa - (S)-3-Hydroxybutanoyl-CoA, akg - 2-Oxoglutarate, 4h2oglt - 4-Hhydroxy-2-oxoglutarate, 2hydogc - 2-Hydroxy-glutaryl-CoA, 3mgcoa - 3-Methylyglutaconyl-CoA, lys – L-lysine, 36dahx - (3S)-3,6-Diaminohexanoate, 35dahx - (3S)-3,5-Diaminohexanoate, 5a3ohex - 5-Amino-3-oxohexaonate, 3abutcoa - L-3-Aminobutyryl-CoA, 4abut - 4-Aminobutyrate, succsal - Succinic semialdehyde, 4hdxbutn - 4-Hydroxybutyrate, 4-hbutcoa - 4-Hydroxybutyrate-CoA, 3btcoa - Vinylacetyl CoA, b2coa - Crotonyl CoA, but - Butyrate. Source data are provided as a Source Data file.
Fig. 4
Fig. 4. Microbiome associations with key clinical markers.
Volcano plots showing the β coefficient on the x-axis and the FDR-adjusted –log10 p-values on the y-axis (FDR-adjusted using Benjamini–Hochberg test, p-values obtained with two-sided tests from GLM) for gut microbial associations with clinical markers for (A) Glucose control as measured by fasting blood glucose levels (Bifidobacterium adolescentis: 2.61 × 10–2, Parabacteroides goldsteinii: 2.63 × 10–2, Lactobacillus mucosae: 4.30 × 10–2), B Lipid control as measured by total cholesterol in plasma (Haemophilus parainfluenzae: 7.95 × 10–4, Lachnospiraceae bacterium 1 4 56FAA: 3.92 × 10–3), C Liver health, as measured by plasma levels of aspartate aminotransferase (Klebsiella pneumoniae: 3.99 × 10–3), and (D) Systemic inflammation, as measured by high-sensitivity CRP levels (Eggerthella unclassified: 4.45 × 10–2, Escherichia coli: 4.45 × 10–2, Streptococcus salivarius: 4.45 × 10–2), E Vitamin B12 (Streptococcus parasanguinis: 4.54 × 10–9, Bacteroides coprocola: 9.76 × 10–5). Points in all plots are colored with red for FDR-adjusted p-value ≤ 0.05 and grey otherwise. Dotted lines represent the thresholds of p-value = 0.05 and p-value = 0.1. Source data are provided as a Source Data file.

References

    1. Goldman, D. P. et al. Consequences of health trends and medical innovation for the future elderly. Health Aff.24, W5R5–W5R17 (2005). 10.1377/hlthaff.W5.R5 - DOI - PMC - PubMed
    1. Rowe, J. W., Fulmer, T. & Fried, L. Preparing for better health and health care for an aging population. JAMA316, 1643–1644 (2016). - PubMed
    1. Malhotra, R. et al. The aging of a young nation: population aging in Singapore. Gerontologist59, 401–410 (2019). - PubMed
    1. Jaul, E. & Barron, J. Age-related diseases and clinical and public health implications for the 85 years old and over population. Front. Public Health5, 335 (2017). 10.3389/fpubh.2017.00335 - DOI - PMC - PubMed
    1. Brody, J. A. & Grant, M. D. Age-associated diseases and conditions: implications for decreasing late life morbidity. Aging13, 64–67 (2001). - PubMed

Publication types

LinkOut - more resources