. 2024 Sep 5;14(1):20760.
doi: 10.1038/s41598-024-71443-x.

Quantifying DNA damage following light sheet and confocal imaging of the mammalian embryo

Affiliations

Quantifying DNA damage following light sheet and confocal imaging of the mammalian embryo

Darren J X Chow et al. Sci Rep. .

Abstract

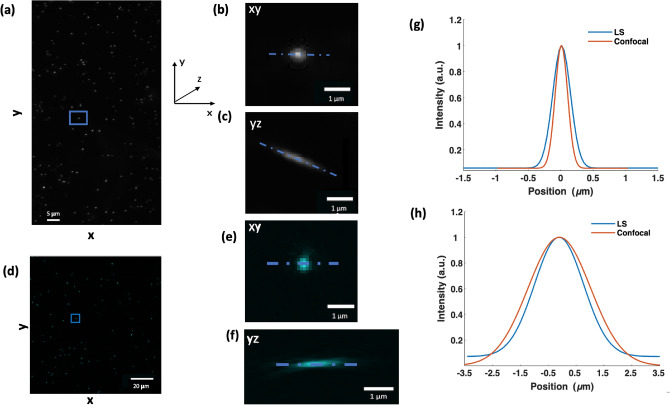
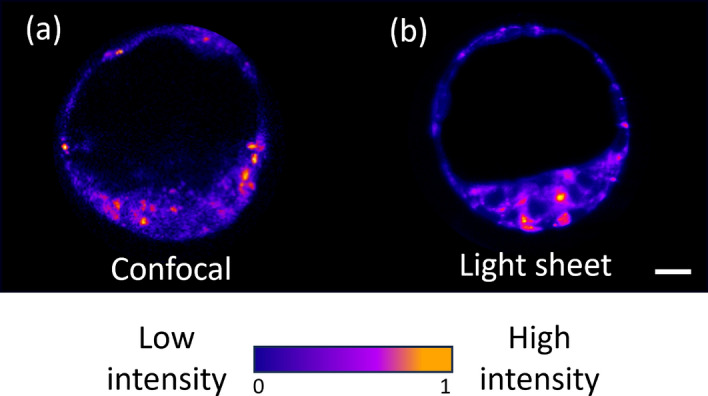
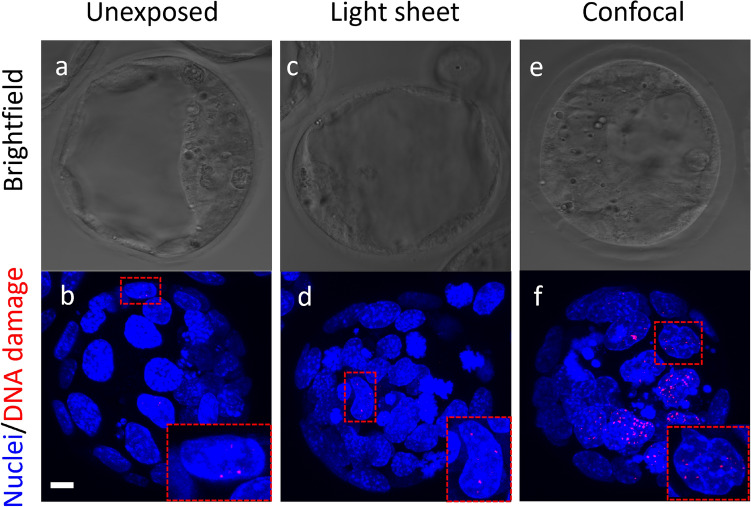
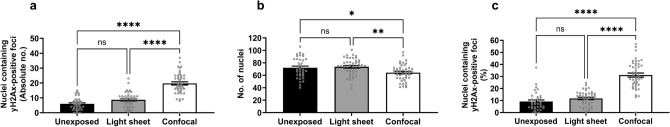
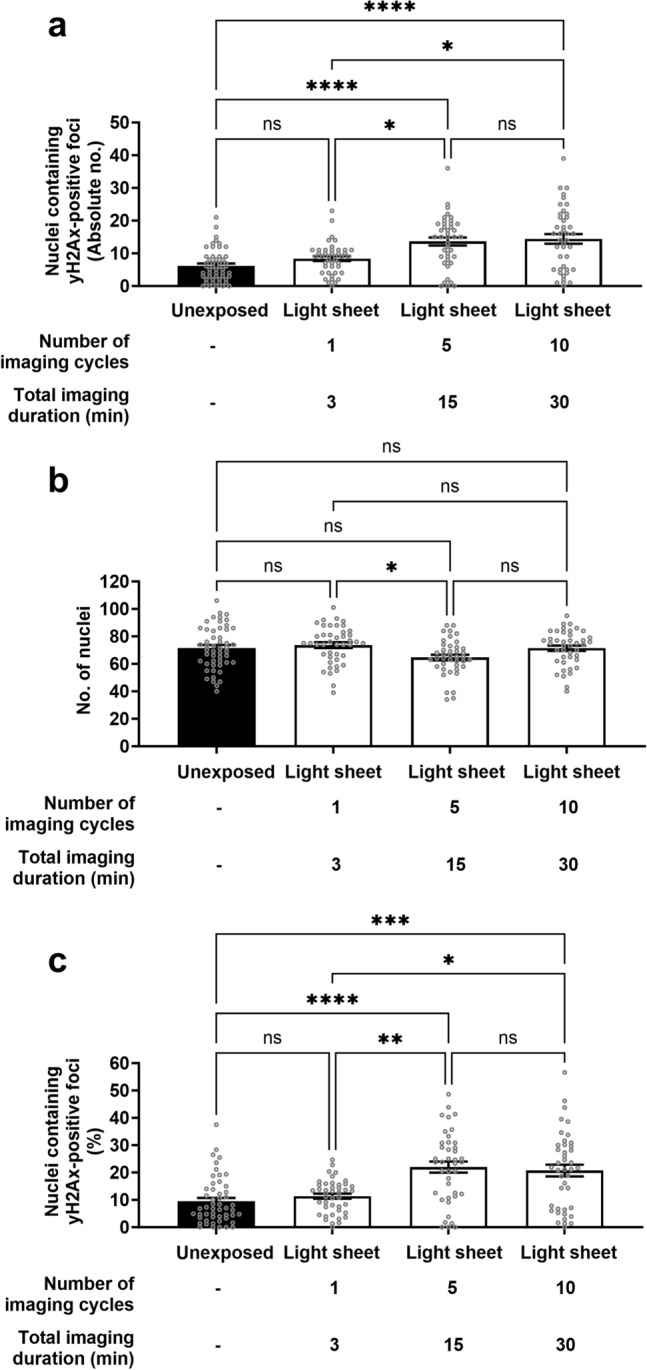
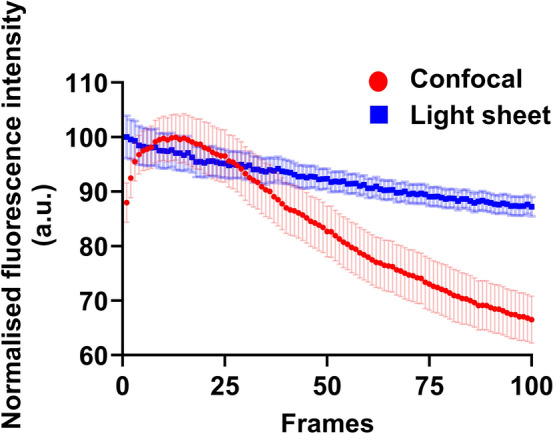
Embryo quality assessment by optical imaging is increasing in popularity. Among available optical techniques, light sheet microscopy has emerged as a superior alternative to confocal microscopy due to its geometry, enabling faster image acquisition with reduced photodamage to the sample. However, previous assessments of photodamage induced by imaging may have failed to measure more subtle impacts. In this study, we employed DNA damage as a sensitive indicator of photodamage. We use light sheet microscopy with excitation at a wavelength of 405 nm for imaging embryo autofluorescence and compare its performance to laser scanning confocal microscopy. At an equivalent signal-to-noise ratio for images acquired with both modalities, light sheet microscopy reduced image acquisition time by ten-fold, and did not induce DNA damage when compared to non-imaged embryos. In contrast, imaging with confocal microscopy led to significantly higher levels of DNA damage within embryos and had a higher photobleaching rate. Light sheet imaging is also capable of inducing DNA damage within the embryo but requires multiple cycles of volumetric imaging. Collectively, this study confirms that light sheet microscopy is faster and safer than confocal microscopy for imaging live embryos, indicating its potential as a label-free diagnostic for embryo quality.


Figures

Fig. 1
Fig. 1
The light sheet (LS) propagates along the x-axis and is scanned with respect to the sample in the direction of the z-axis. (a) and (d) show the maximum intensity projections of images of 200 nm diameter fluorescent microspheres embedded in agarose acquired with the light sheet and the confocal setup, respectively. (b) and (e) are magnified views that show the single bead marked by the target in (a) and (d) in the xy plane. (c) and (f) are magnified views that show the intensity projection of the beads marked in (a) and (d) in the yz plane. In (c) the point-spread function is skewed due to the 45-degree illumination and detection angle with respect to the sample in the light sheet setup. (g) and (h) show the line profile across the beads marked by the targets and the line profile across the beads intensity projection in the xy and yz plane, respectively.
Fig. 2
Fig. 2
Representative images of autofluorescence signals recorded with excitation at a wavelength of 405 nm for blastocyst-stage embryos using (a) confocal (SNR = 15.7) or (b) light sheet (SNR=15.5) microscopy. The images displayed in (a) and (b) were derived from a single z-slice from the total collected z-planes. 3D reconstruction for embryos acquired on both imaging systems can be found in Supplementary File S2: Videos 1 and 2 for confocal and light sheet microscopy, respectively. Images have been cropped to a comparable scale with no sharpening or other post-processing applied. Scale bar = 20 μm.
Fig. 3
Fig. 3
Representative images of DNA damage within embryos. Blastocyst-stage embryos were either not imaged (Unexposed; a, b), or imaged (at a wavelength of 405 nm) using light sheet microscopy (c,d) or confocal microscopy (e,f). Representative brightfield images of embryos (a,c,e) with corresponding maximum intensity projection of DNA damage (red: b,d,f) within individual nuclei (blue) are shown. Embryos were stained with DAPI (blue) and γH2AX (red foci) to visualise individual cell nuclei and DNA double-stranded breaks, respectively (see insets). Scale bar = 20 μm.
Fig. 4
Fig. 4
Imaging of embryos using confocal microscopy resulted in significantly fewer cells and higher levels of DNA damage. Blastocyst-stage embryos were kept in the dark (unexposed) or exposed to 405 nm laser excitation on either a light sheet or confocal microscope. Embryos were then returned to culture for 30 min prior to fixation. DNA damage and cell nuclei were identified via γH2AX immunohistochemistry and DAPI staining, respectively. (a) shows the absolute number of nuclei containing γH2AX-positive foci per embryo. (b) shows the total number of cells per embryo (DAPI-stained nuclei), while (c) expresses the levels of DNA damage as a proportion of nuclei containing γH2AX-positive foci per embryo. Data are presented as mean ± SEM, n = 36–45 embryos per treatment group, from 3 independent experimental replicates, and analysed by one-way ANOVA with Tukey’s multiple comparison test (a,b) or Kruskal–Wallis with Dunn’s multiple comparison test (c). *P<0.05; **P<0.01; ****P<0.0001.
Fig. 5
Fig. 5
Increasing cycles of light sheet imaging induces increased levels of DNA damage. Blastocyst-stage embryos were either kept in the dark (unexposed), or subjected to increasing rounds of imaging using light sheet microscopy (one, five or ten z-stacks). The total imaging duration to acquire these z-stack(s) is shown. Following imaging, embryos were returned to the incubator for an additional 30 min prior to fixation. DNA damage and cell nuclei were identified via γH2AX immunohistochemistry and DAPI staining, respectively. (a) shows the absolute number of nuclei containing γH2AX-positive foci per embryo. (b) shows the total number of cells per embryo (DAPI-stained nuclei), while (c) expresses the levels of DNA damage as a proportion of nuclei containing γH2AX-positive foci per embryo. Data are presented as mean ± SEM, n = 41–51 embryos, from 3 independent experimental replicates, analysed using Kruskal–Wallis with Dunn’s multiple comparison test. *P<0.05; **P<0.01; ***P<0.001; ****P<0.0001.
Fig. 6
Fig. 6
A semi-quantitative comparison of the photobleaching rate during confocal and light sheet imaging. Autofluorescence from blastocyst-stage embryos were recorded during confocal or light sheet imaging (both at 405 nm). To compare photobleaching, images at a single z-plane were acquired on both systems, using the same conditions as Fig. 2. Each embryo was imaged for 100 frames (n = 13 and 17 embryos for the light sheet and confocal groups, respectively). Data are presented as mean ± standard error of the mean.
Fig. 7
Fig. 7
(a) Experimental setup for light-sheet measurements. Laser = 405 nm (Toptica iBeam Smart, 300 mW), NF = Notch Filter (407 nm), WP = half-waveplate, PBS = polarising beam splitter, L1 = 75 mm, L2 = 100 mm, L3 = 100 mm, L4 =100 mm, L5= 50 mm, L6 = 75 mm, M1–2= mirrors, SM = Scanning Mirror (Galvo, Thorlabs, NJ), OBJ1 = 10X, Nikon and OBJ2 = 16X, Nikon, S = sample holder, LP = long pass filter (405 nm), TL= Tube lens (400 mm), CAM = sCMOS camera (Iris 15, Teledyne Photometrics, AZ). (b) A top view of the sample holder lined with FEP film on top of the setup with a drop of imaging media, overlaid with paraffin oil, used for embryo imaging.

Similar articles

Cited by

References

    1. Balasubramanian, H., Hobson, C. M., Chew, T.-L. & Aaron, J. S. Imagining the future of optical microscopy: Everything, everywhere, all at once. Commun. Biol.6, 1096. 10.1038/s42003-023-05468-9 (2023). 10.1038/s42003-023-05468-9 - DOI - PMC - PubMed
    1. Ghosh, B. & Agarwal, K. Viewing life without labels under optical microscopes. Commun. Biol.6, 559. 10.1038/s42003-023-04934-8 (2023). 10.1038/s42003-023-04934-8 - DOI - PMC - PubMed
    1. Wang, S., Larina, I. V. & Larin, K. V. Label-free optical imaging in developmental biology [invited]. Biomed. Opt. Express11, 2017–2040. 10.1364/BOE.381359 (2020). 10.1364/BOE.381359 - DOI - PMC - PubMed
    1. Jensen, E. C. Use of fluorescent probes: Their effect on cell biology and limitations. Anat. Rec. (Hoboken)295, 2031–6. 10.1002/ar.22602 (2012). 10.1002/ar.22602 - DOI - PubMed
    1. Adolfsson, E. & Andershed, A. N. Morphology vs morphokinetics: A retrospective comparison of inter-observer and intra-observer agreement between embryologists on blastocysts with known implantation outcome. JBRA Assist. Reprod.22, 228–237. 10.5935/1518-0557.20180042 (2018). 10.5935/1518-0557.20180042 - DOI - PMC - PubMed

LinkOut - more resources