. 2024 Sep 5;14(1):20773.
doi: 10.1038/s41598-024-71227-3.

New dual inducible cellular model to investigate temporal control of oncogenic cooperating genes

Affiliations

New dual inducible cellular model to investigate temporal control of oncogenic cooperating genes

Matthew R Kent et al. Sci Rep. .

Abstract

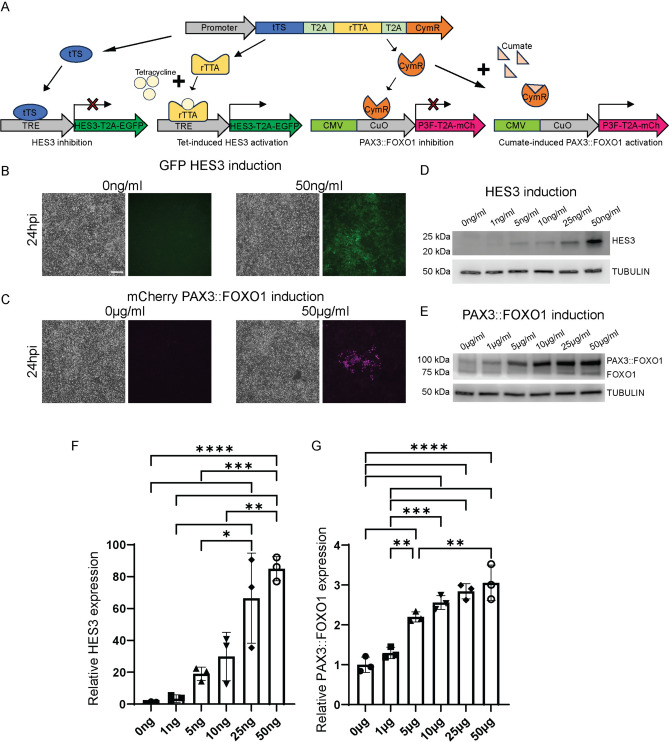
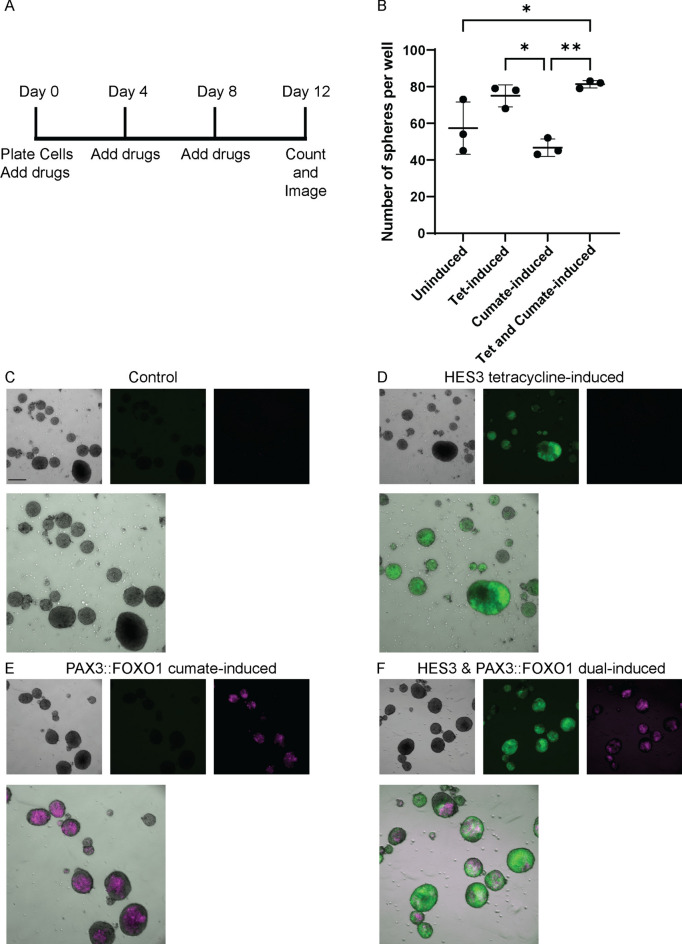
The study of cooperating genes in cancer can lead to mechanistic understanding and identifying potential therapeutic targets. To facilitate these types of studies, we developed a new dual-inducible system utilizing the tetracycline- and cumate-inducible systems driving HES3 and the PAX3::FOXO1 fusion-oncogene, respectively, as cooperating genes from fusion-positive rhabdomyosarcoma. With this model, we can independently induce expression of either HES3 or PAX3::FOXO1, as well as simultaneously induce expression of both genes. This new model will allow us to further investigate the cooperation between HES3 and PAX3::FOXO1 including the temporal requirements for genetic cooperation. Functionally, we show that dual-induction of PAX3::FOXO1 and HES3 modifies sphere formation in a HEK293T-based system. More broadly, this lentiviral dual-inducible system can be adapted for any cooperating genes (overexpression or knockdown), allowing for independent, simultaneous, or temporally controlled gene expression.

Keywords: Cooperating genes; Cumate-inducible expression; Fusion-oncogene; Inducible expression; Temporal control; Tetracycline-inducible expression.


Conflict of interest statement

The authors declare no competing interests.

Figures

Fig. 1
Fig. 1
Anhydrotetracycline induction of HES3 and cumate induction of PAX3::FOXO1 is titratable. Schematic of tetracycline and cumate induced expression of HES3 and PAX3::FOXO1 (A). Dual inducible HEK293T cells (referred to as 293Tii) were plated on 12-well plates at a density of 250,000 cells per well. After overnight adherence, cells were treated with titrating amounts of either: anhydrotetracycline at 0, 1, 5, 10, 25, or 50 ng/ml; or cumate at 0, 1, 5, 10, 25, or 50 µg/ml. Shown are representative images of cells imaged at 24 h post-induction (hpi) on a Leica DMI microscope with a 10 × objective for GFP fluorescence (HES3) or mCherry fluorescence (PAX3::FOXO1) and then harvested for western blotting (B,C). Brightfield images were exposed for 5 ms. GFP and mCherry images were exposed for 2 s. Scale bar is 500 µm. (D,E) Cells were lysed, and then 20 µg of protein was loaded into each well of a 4–15% gradient gel. After transferring to a PVDF membrane, the membrane pieces were blotted with either a HES3 primary antibody (D), FOXO1 primary antibody that recognizes the PAX3::FOXO1 fusion and endogenous FOXO1 (E), or TUBULIN primary antibody (D,E). (F,G) Quantification of western blot data for HES3 (F) or PAX3::FOXO1 (G) protein expression. Shown is the ratio of HES3 or PAX3::FOXO1 expression normalized to TUBULIN, and presented as the fold-change to no drug treatment (far left on both graphs). Each point represents a biological replicate (n = 3 for each condition). The error bars represent the mean ± standard deviation. The p values were calculated using a one-way ANOVA followed by Tukey’s multiple comparisons post hoc test. This was repeated three times. Anhydrotetracycline p-values: 0 ng vs 25 ng, p = 0.00081; 0 ng vs 50 ng, p = 0.00008; 1 ng vs 25 ng, p = 0.00112; 1 ng vs 50 ng, p = 0.0001; 5 ng vs 25 ng, p = 0.0108; 5 ng vs 50 ng, p = 0.00075; 10 ng vs 50 ng, 0.00348. Cumate p-values: 0 µg vs 5 µg, p = 0.0005; 0 µg vs 10 µg, p = 0.00004; 0 µg vs 25 µg, p = 0.00001; 0 µg vs 50 µg, p = 0.000002; 1 µg vs 5 µg, p = 0.0055; 1 µg vs 10 µg, p = 0.0003; 1 µg vs 25 µg, p = 0.00004; 1 µg vs 50 µg, p = 0.00001; 5 µg vs 50 µg, p = 0.008. HES3 and associated TUBULIN blot were cut from the same membrane prior to primary antibody hybridization. PAX3::FOXO1 and associated TUBULIN blot were cut from the same membrane prior to primary antibody hybridization. Western blots have been cropped from original and the uncropped blots are presented in Supplemental Fig. 7. Acronyms: tTS, tetracycline-controlled transcriptional silencer; rtTA, reverse tetracycline transactivator; TRE, tetracycline response element promoter; cymR, cumate repressor; cuO, cumate operator site; P3F, PAX3::FOXO1; mCh, mCherry.
Fig. 2
Fig. 2
HES3 and PAX3::FOXO1 induction are both reversible. 293Tii cells were plated on 6-well plates at a density of 250,000 cells per well. After overnight adherence, cells were treated with either 50 ng/ml anhydrotetracycline (HES3 induction) or 50 µg/ml cumate (PAX3::FOXO1 induction). Shown are representative images of uninduced cells (A), anhydrotetracycline-induced cells at 24 h post-induction (hpi) and 120hpi (B), and cumate-induced cells at 24hpi and 192hpi (C). Cells were imaged on a Leica DMI microscope with a 10 × objective. Brightfield images were exposed for 5 ms. GFP and mCherry images were exposed for 2 s. Scale bar is 500 µm. Cells were then harvested for western blotting. Cells were lysed, and 20 µg of protein was loaded into each well of a 4–15% gradient gel. After transferring to a PVDF membrane, the membrane pieces were blotted with either a HES3 primary antibody (D), FOXO1 primary antibody that recognizes the PAX3::FOXO1 fusion and endogenous FOXO1 (E), or TUBULIN primary antibody (D,E). Relative expression of either HES3 (D) or PAX3::FOXO1 (E) was then quantified using ImageJ (relative to TUBULIN, and presented as the ratio compared to uninduced cells). Each point represents a biological replicate (n = 3 for each condition). The error bars represent the mean ± standard deviation. The p values were calculated using a one-way ANOVA followed by Tukey’s multiple comparisons post hoc test. This was repeated three times. HES3 reversibility p-values: uninduced vs 24hpi, p = 0.00006; 24hpi vs 120hpi, p = 0.00006; uninduced vs 120hpi, p = 0.99. PAX3::FOXO1 reversibility p-values: uninduced vs 24hpi, p = 0.00001; uninduced vs 120hpi, p = 0.0003; uninduced vs 192hpi, p = 0.11; 24hpi vs 120hpi, p = 0.019; 24hpi s 192hpi, p = 0.00009; 120hpi vs 192hpi, p = 0.005. Blots have been cropped from original (D,E). HES3 and associated TUBULIN blot were cut from the same membrane prior to primary antibody hybridization. PAX3::FOXO1 and associated TUBULIN blot were cut from the same membrane prior to primary antibody hybridization. Western blots have been cropped from original and the uncropped blots are presented in Supplemental Fig. 8.
Fig. 3
Fig. 3
HES3 and PAX3::FOXO1 can be independently or simultaneously induced in post-sort 293Tii cells. Timeline of experiments for FAC-sorting and post-sort induction (A). Post-sort 293Tii cells were plated on 12-well plates at a density of 250,000 cells per well. After overnight adherence, cells were treated with either 50 ng/ml anhydrotetracycline, 50 µg/ml cumate, or both 50 ng/ml anhydrotetracycline and 50 µg/ml cumate. Cells were imaged at 24 h post-induction (hpi) (B). Cells were imaged on a Leica DMI microscope with a 10 × objective. Brightfield images were exposed for 5 ms. GFP and mCherry images were exposed for 2 s. Scale bar is 500 µm. Treated cells were harvested for a western blot and were lysed, and then 20 µg of protein was loaded into each well of a 4–15% gradient gel. After transferring to a PVDF membrane, the membranes were cut and hybridized with either a HES3 primary antibody, FOXO1 primary antibody, or TUBULIN primary antibody (C). Relative expression of HES3 (D) and PAX3::FOXO1 (E) was then quantified. Shown is the ratio of HES3 or PAX3::FOXO1 protein expression normalized to TUBULIN, and presented as the fold-change to no drug treatment (far left on both graphs). Each point represents a biological replicate (n = 3 for each condition). The error bars represent the mean ± standard deviation. The p values were calculated using a one-way ANOVA followed by Tukey’s multiple comparisons post hoc test. This was repeated three times. HES3 expression p-values: uninduced vs tet-induced, p = 0.00007; uninduced vs cumate-induced, p = 0.9999; uninduced vs tet- and cumate-induced, p = 0.0004; tet-induced vs cumate-induced, p = 0.00007; tet-induced vs tet- and cumate-induced, p = 0.28; cumate-induced vs tet- and cumate-induced, p = 0.0004. PAX3::FOXO1 expression p-values: uninduced vs cumate-induced, p = 0.000004; uninduced vs tet- and cumate-induced, p = 0.000007; tet-induced vs cumate-induced, p = 0.000006; tet-induced vs tet- and cumate-induced, p = 0.00001. All three blots were cut from the same membrane prior to primary antibody hybridization. Western blots have been cropped from original and the uncropped blots are presented in Supplemental Fig. 9.
Fig. 4
Fig. 4
PAX3::FOXO1-induced cells produce fewer spheres than cells with PAX3::FOXO1 and HES3 dual induction. Sphere formation and non-adherent growth in HEK293T cells is a proxy for oncogenic capacity. (A) Timeline of drug addition, counting, and imaging spheres. 10,000 post-sort 293Tii cells were plated on ultralow-attachment 6-well plates, treated with either 0.1% DMSO and 0.1% PBS, 0.1% PBS and 50 ng/ml anhydrotetracycline, 0.1% DMSO and 50 µg/ml cumate, or 50 ng/ml anhydrotetracycline and 50 µg/ml cumate. Every four days after plating, cells were given additional drug at the same concentrations until day 12 (drugs provided on day 0, day 4, and day 8). Spheres were imaged on day 12 on a Leica DMI microscope with a 5 × objective. (B) Plotted is the number of spheres per well on day 12. Each point is a technical replicate, the bar represents the mean, and the error bar is the standard deviation. This was repeated an additional two times with similar results. (C-F) Representative images were taken of each condition. Brightfield images were exposed for 5 ms. GFP and mCherry images were exposed for 2 s. Scale bars are 500 µm. Representative images include (C) control-induced cells, (D) HES3 tetracycline-induced cells, (E) PAX3::FOXO1 cumate-induced cells, and (F) HES3/PAX3::FOXO1 dual-induced cells The p values in B were calculated using a one-way ANOVA followed by Tukey’s multiple comparisons post hoc test. Control vs dual-induced, p = 0.029; tetracycline-induced vs cumate-induced, p = 0.012; cumate-induced vs dual-induced, p = 0.0037.

Update of

Similar articles

Cited by

References

    1. Fang, C., Jiang, B., Shi, X. & Fan, C. Hes3 enhances the malignant phenotype of lung cancer through upregulating cyclin D1, cyclin D3 and MMP7 expression. Int. J. Med. Sci.16, 470–476. 10.7150/ijms.28139 (2019). 10.7150/ijms.28139 - DOI - PMC - PubMed
    1. Yu, W. et al. PD-L1 promotes tumor growth and progression by activating WIP and beta-catenin signaling pathways and predicts poor prognosis in lung cancer. Cell Death Dis.11, 506. 10.1038/s41419-020-2701-z (2020). 10.1038/s41419-020-2701-z - DOI - PMC - PubMed
    1. Kendall, G. C. et al. PAX3-FOXO1 transgenic zebrafish models identify HES3 as a mediator of rhabdomyosarcoma tumorigenesis. Elife10.7554/eLife.33800 (2018). 10.7554/eLife.33800 - DOI - PMC - PubMed
    1. Bose, M. et al. Overexpression of MUC1 induces non-canonical TGF-beta signaling in pancreatic ductal adenocarcinoma. Front. Cell Dev. Biol.10, 821875. 10.3389/fcell.2022.821875 (2022). 10.3389/fcell.2022.821875 - DOI - PMC - PubMed
    1. Watson, S. et al. VGLL2-NCOA2 leverages developmental programs for pediatric sarcomagenesis. Cell Rep.42, 112013. 10.1016/j.celrep.2023.112013 (2023). 10.1016/j.celrep.2023.112013 - DOI - PMC - PubMed

MeSH terms

Substances