. 2024 Sep 5;15(1):7754.
doi: 10.1038/s41467-024-51931-4.

Prion protein alters viral control and enhances pathology after perinatal cytomegalovirus infection

Affiliations

Prion protein alters viral control and enhances pathology after perinatal cytomegalovirus infection

Dubravka Karner et al. Nat Commun. .

Abstract

Cytomegalovirus (CMV) infection poses risks to newborns, necessitating effective therapies. Given that the damage includes both viral infection of brain cells and immune system-related damage, here we investigate the involvement of cellular prion protein (PrP), which plays vital roles in neuroprotection and immune regulation. Using a murine model, we show the role of PrP in tempering neonatal T cell immunity during CMV infection. PrP-null mice exhibit enhanced viral control through elevated virus-specific CD8 T cell responses, leading to reduced viral titers and pathology. We further unravel the molecular mechanisms by showing CMV-induced upregulation followed by release of PrP via the metalloproteinase ADAM10, impairing CD8 T cell response specifically in neonates. Additionally, we confirm PrP downregulation in human CMV (HCMV)-infected fibroblasts, underscoring the broader relevance of our observations beyond the murine model. Furthermore, our study highlights how PrP, under the stress of viral pathogenesis, reveals its impact on neonatal immune modulation.


Conflict of interest statement

The authors declare no competing interests.

Figures
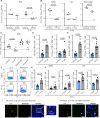
Fig. 1
Fig. 1. Lower MCMV titers in PrP KO newborn mice due to enhanced viral control mediated by CD8 T cells.
A Viral titers in the brain of congenitally infected C57BL/6J and PrP KO mice at 8 and 14 days post-infection (dpi); dpi 8 (n = 5); dpi 14 (n = 6). B Viral titers in spleens (n = 6; both groups); livers (C57BL/6J n = 7; PrP KO n = 3), and salivary glands (n = 5; both groups) at 14 dpi. C Brain viral titers in MCMV-infected animals with and without CD8 T cell depletion at 14 dpi (C57BL/6J n = 6; PrP KO n = 6; C57BL/6J αCD8 n = 8; PrP KO αCD8 n = 8). Production of IFNγ and TNFα in CD8 T cells from spleens (D; C57BL/6J n = 8, PrP KO n = 7) and livers (E; C57BL/6J n = 8, PrP KO n = 7) of congenitally infected animals at 14 dpi determined by flow cytometry staining after a 4 h incubation in the presence of Brefeldin A. F Representative dot blots (second lowest signal in the group) showing liver MCMV-M45 tetramer staining, quantified in Fig. 1G. G Frequency of MCMV-M45 tetramer-positive CD8 T cells in the liver of congenitally infected animals at 14 dpi; (C57BL/6J n = 5; PrP KO n = 4); H Frequency (%) and total number (#) of MCMV-M45 (n = 6; both groups) and MCMV-M57 (C57BL/6 J n = 5; PrP KO n = 8) tetramer-positive CD8 T cells in the spleen of congenitally infected animals at 14 dpi. I Immunohistochemical staining of CD8 T cells (CD8 antigen) and MCMV infected nuclei (IE1 antigen) in the brain of congenitally infected PrP KO mice at 14 dpi. Nuclei were visualized with DAPI. Images were acquired using a Leica TCS SP8 confocal microscope and edited with LAS X software. Scale bar represents 50 μm (left panel) and 25 μm (right panel). Biological replicates: A (7), B ( ≥ 2), CE (2), F, G (2), H (2–4) and I (1). Titer values for individual mice are shown, with median values indicated by horizontal bars. DL detection limit. Statistical analysis was performed with GraphPad Prism using the two-tailed Mann–Whitney (U) test. Data on graphs are shown as mean ± SEM with p-values indicated. Source data are provided as a Source Data file.
Fig. 2
Fig. 2. Phenotypic and functional differences of PrP KO CD8 T cells revealed through scRNAseq analysis and functional assays.
AD scRNAseq analysis of CD8 T cells harvested from spleen tissue of MCMV-infected and naїve PrP KO and C57BL/6J mice. To obtain a purified population, CD8 T cells were FACS-sorted as FVD-CD45+CD3+CD19-CD8+. A UMAP visualization of CD8 T cell scRNAseq data with highlighted Seurat clusters. Clusters 0, 1, and 2 are marked on the UMAP. B Violin plot displaying cluster-specific gene expression. Clusters 0, 1, and 2 are indicated, with solid and dotted lines representing the most important genes. C UMAP visualization of CD8 T cell scRNAseq data with the sample names highlighted. D Bar plot showing the distribution of clusters in the MCMV-infected groups. Clusters 1 and 2 are labeled on the barplot. E Frequency of KLRG1 and CD62L (Sell) positive CD8 T cells in the spleen and liver of congenitally infected C57BL/6J and PrP KO mice at 14 dpi by flow cytometry. C57BL/6J mice (n = 8); PrP KO mice (n = 7); representative of 2 biological replicates. Statistical analysis was performed with GraphPad Prism using the two-tailed Mann–Whitney (U) test. Data on graphs are shown as mean ± SEM with p-values indicated. F Production of IFNγ in Maxi CD8 T cells upon antigen presentation by MCMV-infected BMDCs derived from the bone marrow of one female PrP KO mouse or one C57BL/6J mouse. Each symbol represents the average of a technical duplicate (adults) or a technical triplicate (young). The x-axis denotes the ratio of dendritic cells (DCs) to CD8 T cells. Source data are provided as a Source Data file.
Fig. 3
Fig. 3. Upregulation of PrP is followed by its clearance in MCMV-infected cells.
Representative histograms showing PrP levels in mock or MCMV-infected DC2.4 cells (A) or mouse embryonic fibroblasts (MEF) (B) at 24 h post-infection (p.i.) with a 3 PFU/cell infection-dose. C Surface PrP levels in various murine cells at 24 h p.i., with the median fluorescence intensity (MFI) of the isotype control subtracted from the MFI of the PrP signal. D Surface PrP levels 48 h post HCMV infection in human foreskin fibroblast (HFF) cells. E PrP gene (Prnp) transcription in mock or MCMV-infected DC2.4 cells at 3 and 18 h p.i. (left) and RT-qPCR of mock or MCMV-infected N2a cells at 3, 12, and 30 h p.i. F Total PrP kinetics during MCMV infection, determined by intracellular flow cytometry and immunoblot at 6 and 24 h p.i. G Surface PrP kinetics during MCMV infection, determined by surface flow cytometry at 2, 6, and 24 h p.i. In mouse cell line experiments for flow cytometry, PrP staining was conducted using the D18 antibody. PrP staining on the surface of HFF was carried out utilizing the HuPrP.02 antibody. Immunoblot staining was performed with the MoPrP.03 clone, and actin was used as a loading control. AG present typical data illustrating the key observations from the respective biological replicates, with data being repeated as follows: A (2 repetitions); BD (over 10 times for MEFs, 1–5 times for other cells); E (1 repetition; technical replicates are shown; transcriptome 3; RT-qPCR average of two); F, G (2–10 repetitions depending on the technique and time point).
Fig. 4
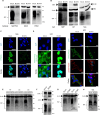
Fig. 4. MCMV induces selective depletion of mature PrP independent of cellular degradation pathways.
A, B Immunoblots of PrP in mock or MCMV-infected lysates at 24 h post-infection. Different antibodies were used on MEF lysates (A) or different cell types were used (B). MCMV-M57 and -m04 were used as markers of successful infection. C N2a cells, mock- or MCMV-infected, stained for PrP (D18 antibody used). Nuclei visualized with DAPI. D Left: Mock-infected HFF cells showed membrane PrP expression (clone huPrP.02), while in HCMV-infected cells, nuclei were stained with anti-IE1 HCMV (clone E13; Argene), with minimal PrP signals. Both cases utilized the huPrP.02 clone and anti-IE1 HCMV (clone E13; Argene), both of IgG1 isotype. Right: Independent analysis showed reduced PrP levels exclusively in HCMV-infected cells, confirmed by UL56.07 antibody recognizing UL56 protein in the nucleus (arrows). Distinct secondary antibodies were employed (anti-IgG1 for huPrP.02 and anti-IgG2b for UL56.07). Nuclei visualized with DAPI. E Immunoblot of mock or MCMV-infected MEF cells grown in the presence of lactacystin (Lac) or leupeptin (Leu) at 24 h p.i. F Immunoblot of PrP and PVR in mock- or MCMV-infected MEF cells at 24 h p.i. G Immunoblot of PrP in lysates of mock- or MCMV-infected cells at 24 h p.i., prepared with a higher concentration of sodium dodecyl sulfate (SDS). H Immunoblot of PrP in mock or MCMV-infected MEF cells at 22 h p.i., grown in the presence of Brefeldin A, which was added 4 hpi and then replenished at 18 hpi. Images (C, D) were acquired using a Leica TCS SP8 confocal microscope and edited with LAS X software. Scale bars: 50 μm (C), 10 μm (D); (AH) present typical data illustrating the key observations from the respective experimental conditions, with data being repeated as follows: A (2 repetitions); B (over 10 repetitions per MoPrP.03/MEF); C (3 repetitions); D (2 repetitions); E (3 repetitions); FH (1 repetition).
Fig. 5
Fig. 5. CMV infection triggers shedding of PrP.
Introductory scheme to Fig. 5A, B: (left) classic detection with anti-PrP antibody after the indicated duration of infection. PrP expression is induced, and newly synthesized PrP emerges at the cell surface. All surface PrP found at the chosen time point of infection is detected. (right) PrP labeled with an anti-PrP antibody at 0 h of infection. At certain hours post infection, only previously labeled PrP (PrP-Ab complex) is detected using a secondary antibody. A Flow cytometry analysis of surface PrP in MEF cells labeled with the D18 antibody prior to a 2-h, 6-h, or 24-h infection. The data is presented as the percentage of surface PrP relative to the 2 h post-infection time-point (100%). B Confocal microscopy of N2a cells labeled with D18 antibody prior to infection, captured 24 hpi. CE N2a and MEF cells mock- or MCMV-infected for 24 h, treated with or without GI254023X (GI), an ADAM10 inhibitor. C N2A cells stained with D18 anti-PrP antibody, anti-IE1 MCMV infection marker, and DAPI for nuclei visualization. D N2a cells stained with POM1 anti-PrP antibody, and DAPI. E MEF cells stained with D18 anti-PrP antibody, and DAPI. F MEF and MEF ADAM10 KO cells mock- or MCMV-infected. 16 hpi cells were stained with D18 anti-PrP antibody, anti-IE1 infection marker, and DAPI. G Opti-MEM cell medium was harvested from MCMV-infected MEF cells at the indicated hpi and analyzed using the Mouse Prion Protein (PRNP) ELISA kit (Abbexa). H MEF cells were mock- or MCMV-infected and treated with or without GI in Opti-MEM cell medium. Medium was harvested at 20 hpi and subjected to NaDOC/TCA precipitation. Immunoblot performed using anti-shed-PrP antibody (sPrPG227). Biological replicates: A (2 repetitions for parallel staining); B (3); C (2); D, E, F (1 repetition each); G, H (2 repetitions each). BE Leica TCS SP8 confocal microscope, LAS X software. Scale bars: 25 μm (B, D, E), 50 μm (F); NaDOC - Sodium deoxycholate. TCA - Trichloroacetic acid. Scheme created in BioRender.com.
Fig. 6
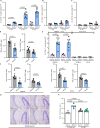
Fig. 6. Soluble PrP binding by CD8 T cells from infected newborn mice leads to reduced cytokine production.
AC Frequencies of PrP binding to CD8 T cells, CD4 T cells, and CD19 B cells from splenocytes of naïve and congenitally MCMV-infected C57BL/6J mice at indicated days post-infection (dpi); (CD8 T cells − 9 dpi: naive n = 4, MCMV n = 5; 12 dpi: naive n = 6, MCMV n = 8; 14 dpi: naive n = 4, MCMV n = 6; CD4 T cells − 9 dpi: naive n = 4, MCMV n = 5; 12 dpi: naive n = 5, MCMV n = 4; CD19 B cells − 9 dpi: naive n = 4, MCMV n = 5; 12 dpi: n = 5, both groups). D Frequencies of IFNγ and TNFα-positive CD8 T cells after incubation with PrP (PrP-hFc) or irrelevant protein (PVR-hFc) in the presence of cell stimulation cocktail and protein transport inhibitors. Splenocytes were harvested from congenitally MCMV-infected C57BL/6J mice at 14 dpi (n = 8; both groups). E Frequencies of PrP binding to CD8 T cells from splenocytes of naїve and congenitally MCMV-infected newborn C57BL/6J and PrP KO mice at 14 dpi (left); or naïve and MCMV-infected adult C57BL/6J and PrP KO mice at 8 dpi (right) (naïve groups: n = 3 each; newborn MCMV: n = 6; adult MCMV: n = 4). F Frequencies of IFNγ and TNFα-positive CD8 T cells after incubation with PrP or an irrelevant protein in the presence of cell stimulation cocktail and protein transport inhibitors. Splenocytes were harvested from congenitally MCMV-infected C57BL/6J mice or PrP KO mice at 14 dpi (n = 6; all groups). G Immunohistochemical staining of microglia (IBA-1) in brains of naive and congenitally MCMV infected mice (H) Thickness of the cerebellar external granular layer (EGL) in brains of uninfected and congenitally MCMV-infected C57BL/6J and PrP KO animals harvested at 9 dpi (n = 7 for MCMV PrP KO; n = 5 for other groups). Biological replicates: AD (≥3), E (2), F (2), G (1) and H (2). Values for individual mice are shown. Statistical analysis was performed with GraphPad Prism using the two-tailed Mann–Whitney (U) test (AF) or two-tailed unpaired t-test (H). Data on graphs are shown as mean ± SEM with p values indicated. Source data are provided as a Source Data file.

Similar articles

Cited by

References

    1. Plotkin, S. A. et al. The status of vaccine development against the human cytomegalovirus. J. Infect. Dis.221, S113–S122 (2020). 10.1093/infdis/jiz447 - DOI - PMC - PubMed
    1. Zuhair, M. et al. Estimation of the worldwide seroprevalence of cytomegalovirus: a systematic review and meta-analysis. Rev. Med. Virol.29, e2034 (2019). 10.1002/rmv.2034 - DOI - PubMed
    1. Marsico, C. & Kimberlin, D. W. Congenital cytomegalovirus infection: advances and challenges in diagnosis, prevention and treatment. Ital. J. Pediatr.43, 38 (2017). 10.1186/s13052-017-0358-8 - DOI - PMC - PubMed
    1. Gantt, S., Bitnun, A., Renaud, C., Kakkar, F. & Vaudry, W. Diagnosis and management of infants with congenital cytomegalovirus infection. Paediatr. Child Health22, 72–74 (2017). 10.1093/pch/pxx002 - DOI - PMC - PubMed
    1. Pass, R. F., Fowler, K. B., Boppana, S. B., Britt, W. J. & Stagno, S. Congenital cytomegalovirus infection following first trimester maternal infection: symptoms at birth and outcome. J. Clin. Virol.35, 216–220 (2006). 10.1016/j.jcv.2005.09.015 - DOI - PubMed

Publication types