. 2024 Sep 5;15(1):7758.
doi: 10.1038/s41467-024-51966-7.

The scaffolding function of LSD1 controls DNA methylation in mouse ESCs

Affiliations

The scaffolding function of LSD1 controls DNA methylation in mouse ESCs

Sandhya Malla et al. Nat Commun. .

Abstract

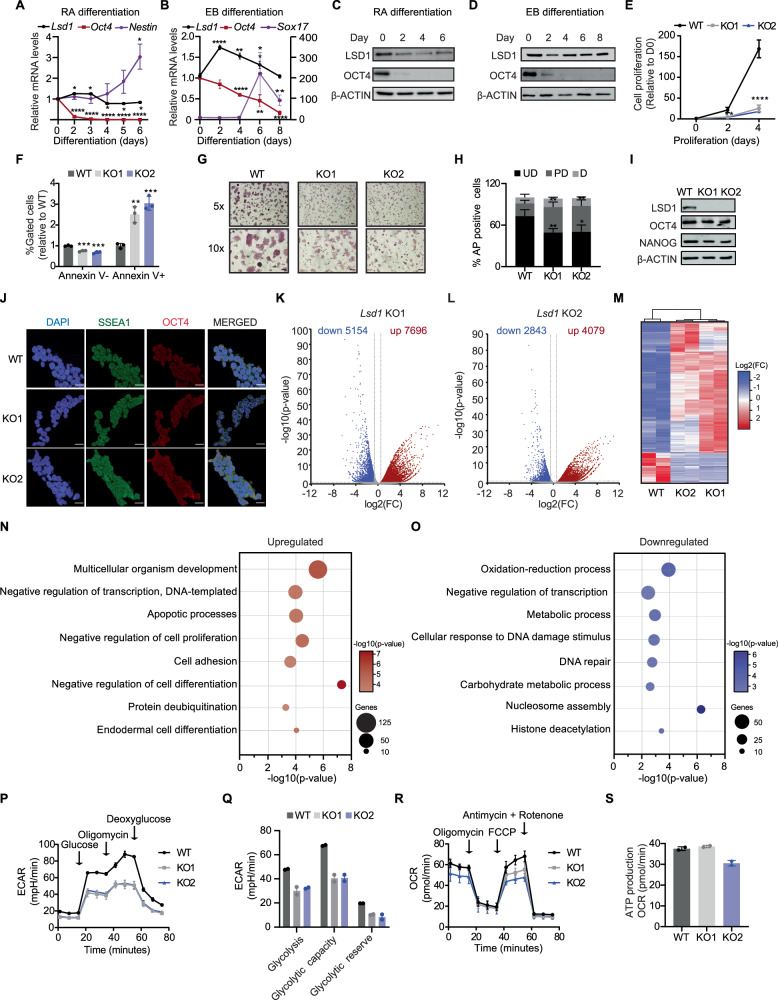
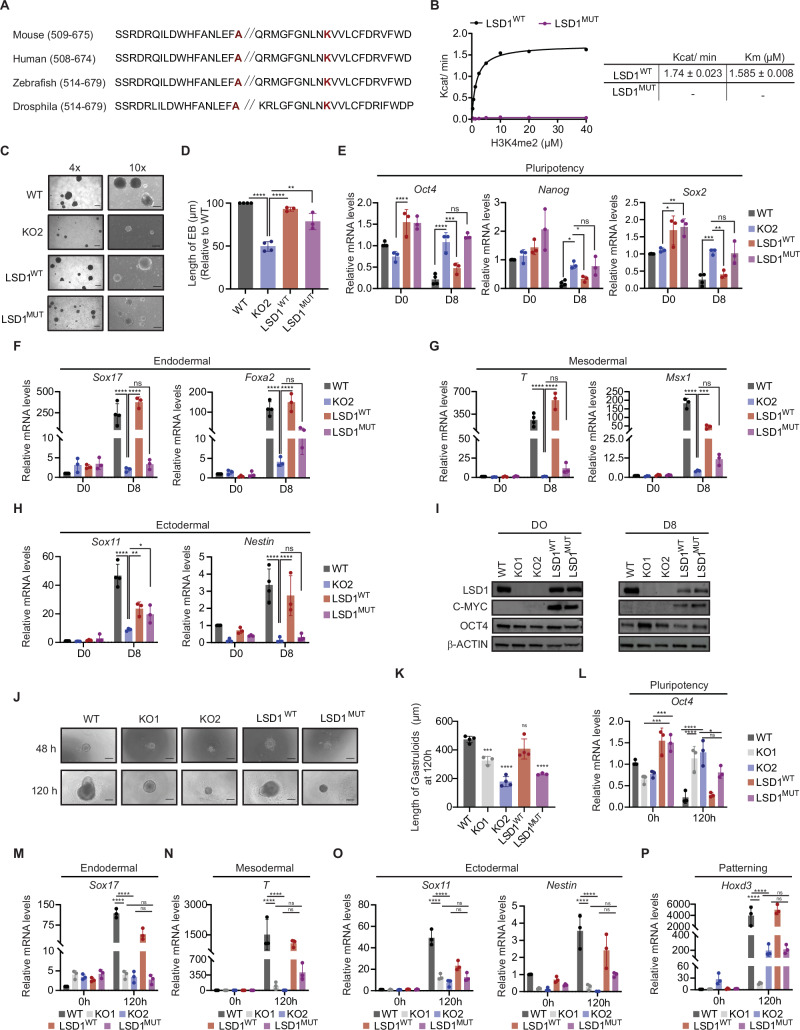
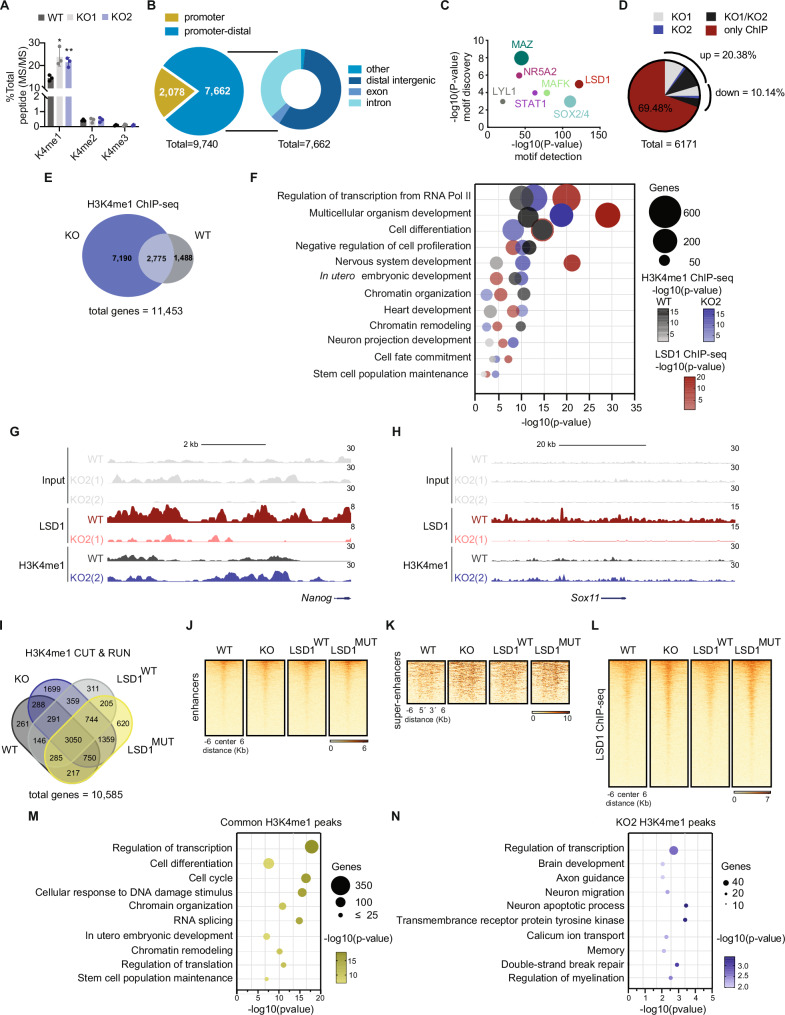
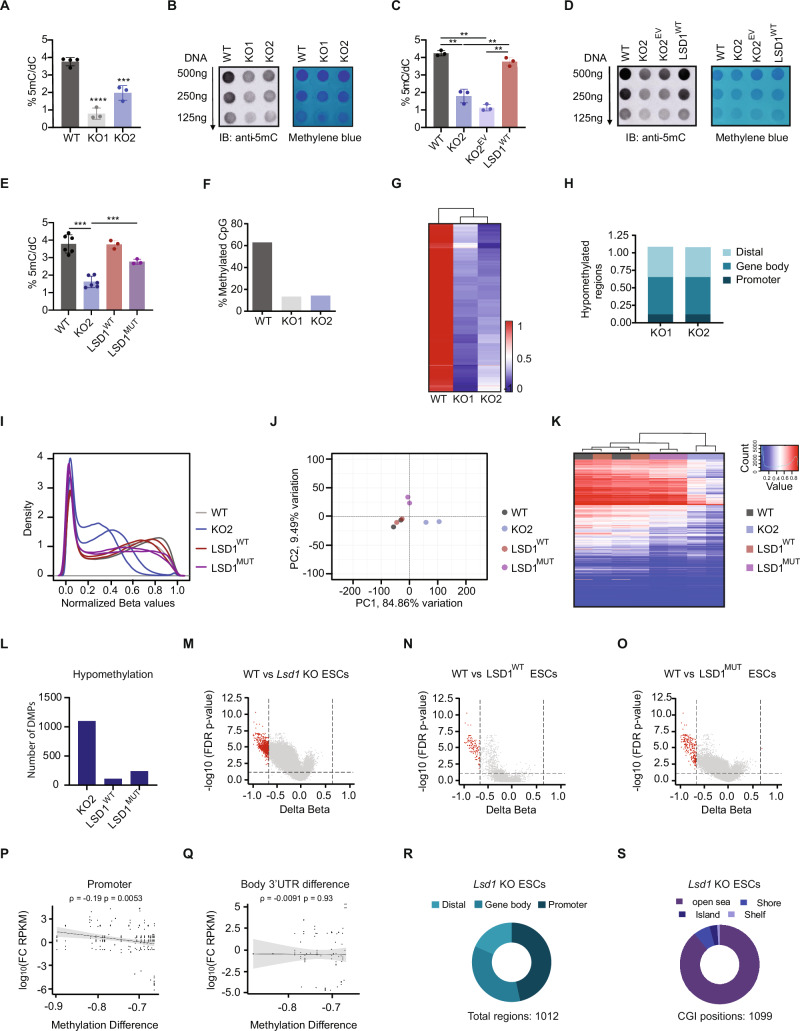
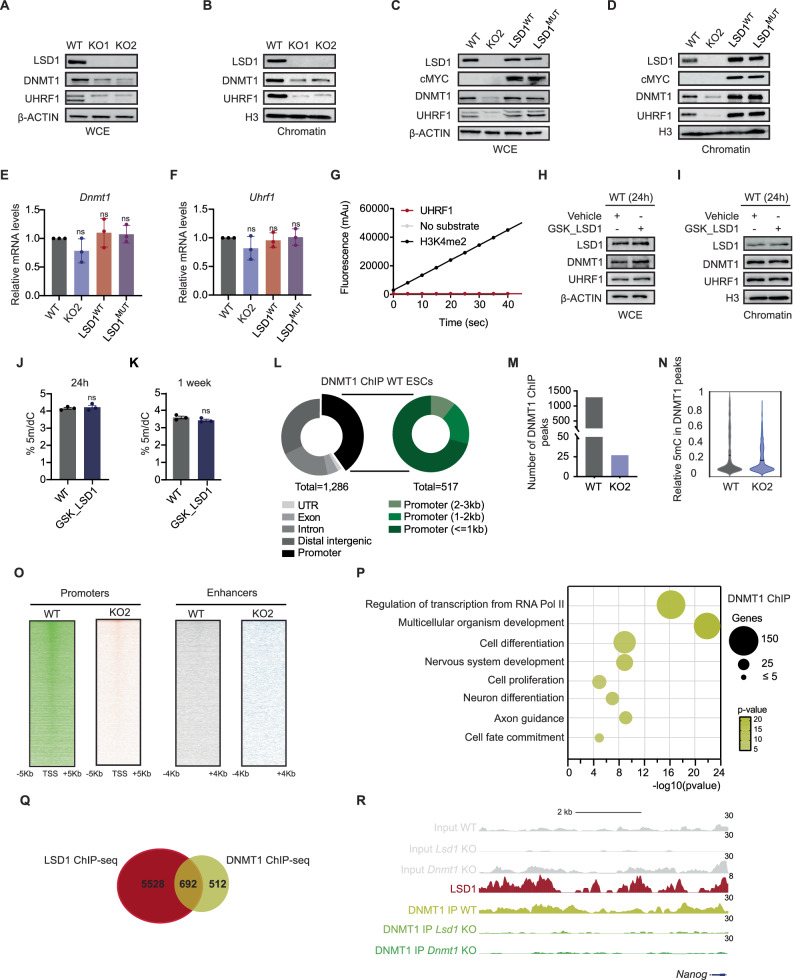
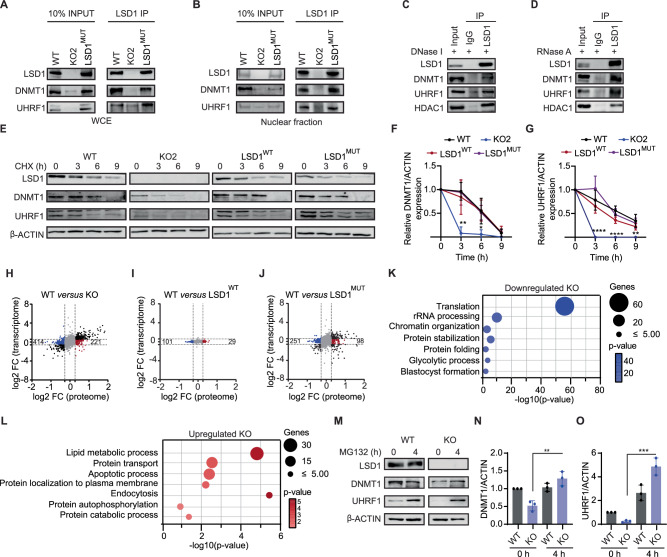
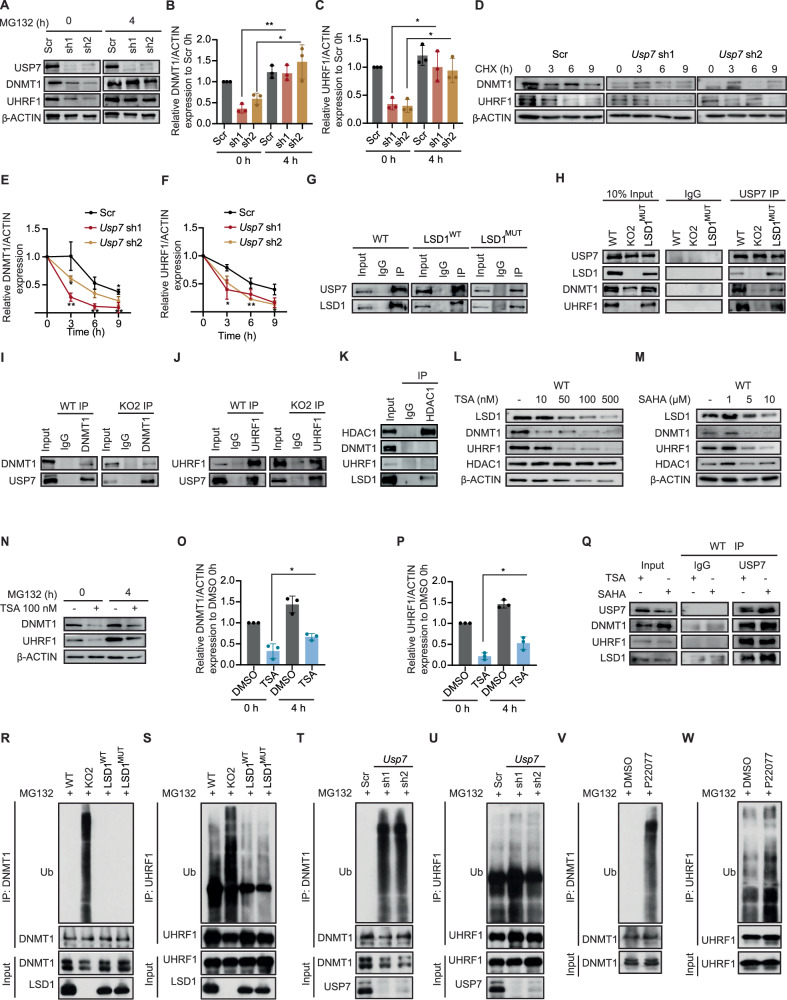
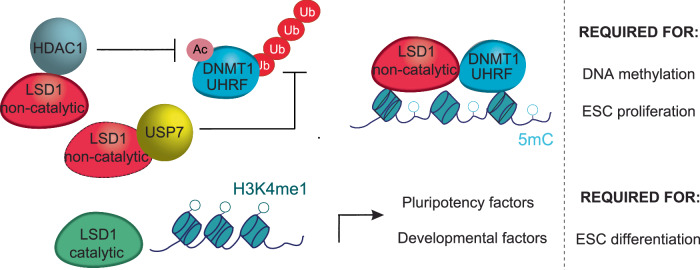
Lysine-specific histone demethylase 1 (LSD1), which demethylates mono- or di- methylated histone H3 on lysine 4 (H3K4me1/2), is essential for early embryogenesis and development. Here we show that LSD1 is dispensable for mouse embryonic stem cell (ESC) self-renewal but is required for mouse ESC growth and differentiation. Reintroduction of a catalytically-impaired LSD1 (LSD1MUT) recovers the proliferation capability of mouse ESCs, yet the enzymatic activity of LSD1 is essential to ensure proper differentiation. Indeed, increased H3K4me1 in Lsd1 knockout (KO) mouse ESCs does not lead to major changes in global gene expression programs related to stemness. However, ablation of LSD1 but not LSD1MUT results in decreased DNMT1 and UHRF1 proteins coupled to global hypomethylation. We show that both LSD1 and LSD1MUT control protein stability of UHRF1 and DNMT1 through interaction with HDAC1 and the ubiquitin-specific peptidase 7 (USP7), consequently, facilitating the deacetylation and deubiquitination of DNMT1 and UHRF1. Our studies elucidate a mechanism by which LSD1 controls DNA methylation in mouse ESCs, independently of its lysine demethylase activity.


Conflict of interest statement

The authors declare no competing interests.

Figures

Fig. 1
Fig. 1. Loss of Lsd1 does not lead to transcriptional deregulation of pluripotency genes.
RT-qPCR analysis of Lsd1 in mouse ESCs along the course of (A) retinoic acid (RA)-mediated and (B) embryoid body (EB) differentiation. Oct4 was used as a marker for pluripotency. A Nestin and (B) Sox17 were employed as markers for neuronal and EB differentiation, respectively. In (B), the relative Sox17 mRNA levels are represented on the right Y-axis. The mRNA levels are relative to the expression at day 0. Western blot of LSD1 and OCT4 on the whole-cell extracts (WCE) of mouse ESC subjected to (C) RA or (D) EB differentiation. β-ACTIN is used as the loading control. E Relative cell proliferation rate of WT and Lsd1 KO mouse ESCs. F Percentage of live (Annexin V-) and apoptotic cells (Annexin V + ) in Lsd1 KO mouse ESCs relative to WT. G AP staining images and (H) quantification of colonies in WT and Lsd1 KO mouse ESCs. Undifferentiated (UD), partially differentiated (PD), and differentiated (D). Scale bars, 50 μm. I Western blot of LSD1, OCT4, and NANOG on WCE of WT and Lsd1 KO mouse ESCs. β-ACTIN is used as the loading control. J Immunofluorescence images of SSEA1 and OCT4 in WT and Lsd1 KO mouse ESCs. DAPI was used as the nuclear marker. Scale bars, 20 μm. Volcano plots of differentially expressed transcripts in (K) Lsd1 KO1 and (L) Lsd1 KO2 mouse ESCs in comparison to WT mouse ESCs. Significantly upregulated and downregulated transcripts are represented in red and blue, respectively (p < 0.05 and Fold change (FC) > 1.5). Non-significant hits are shown in gray dots. FDR value was calculated with the Benjamini–Hochberg correction. M Heatmap of differentially expressed genes in WT and Lsd1 KO mouse ESCs. The upregulated and downregulated genes are indicated in red and blue, respectively. Gene ontology (GO) analysis of biological processes related to the common (N) upregulated and (O) downregulated genes of Lsd1 KO mouse ESCs compared to WT mouse ESCs (p < 0.05 and FC > 1.5). P-values were adjusted with the Benjamini–Hochberg correction. P Measurement of extracellular acidification rate (ECAR) at indicated time points to determine glycolysis stress and (Q) glycolytic metabolic parameters in WT and Lsd1 KO mouse ESCs. R, S Quantification of Oxygen consumption rate (OCR) over time and (S) ATP production in Lsd1 KO mouse ESCs compared to WT mouse ESCs using the Seahorse mito stress test. Statistical analysis: Two-tailed unpaired t-test (A, B, H, and KL), and ordinary one-way ANOVA (E, and F). ∗p < 0.05, ∗∗p < 0.01, ∗∗∗p < 0.001, and ∗∗∗∗p < 0.0001. Error bars denote mean ± SD; n = 3 (A, B (except for Sox17 D2), and E); n = 4 (H); and n = 2 (PS). Each dot in the bar graphs represents independent biological replicates (F). The exact P-values for panels (A, B, E, F and H) are represented in the source data. Results are one representative of n = 3 independent biological experiments (C, D, G, I and J). Uncropped blots are represented in the source data.
Fig. 2
Fig. 2. LSD1 is essential for mouse ESC differentiation.
A Sequence alignment of LSD1 in different species, with mutated amino acid residues highlighted in red. B Saturation curves of histone demethylase activity of purified WT and mutant LSD1 (LSD1MUT) proteins with increasing concentrations of H3K4me2 as a substrate. Each enzymatic curve was derived from the Michaelis-Menten equation (left panel) and their reaction kinetics (right panel). C Representative bright field images at (4x (left) and 10x (right)) magnification (D) quantification of the size of EB derived from WT, Lsd1 KO2, LSD1WT, and LSD1MUT mouse ESCs at day 8 of differentiation. Scale bars, 200 µm. RT-qPCR analysis of (E) pluripotency (Oct4, Nanog, and Sox2), (F) endodermal (Sox17 and Foxa2), (G) mesodermal (T and Msx1), and (H) ectodermal (Sox11 and Nestin) markers in WT, Lsd1 KO2, LSD1WT, and LSD1MUT mouse ESCs on day 0 and day 8 of EB differentiation. mRNA levels are relative to the expression of WT at day 0. β-actin is used as an internal control. I Western blot of LSD1, C-MYC, and OCT4 on whole cell extract of EBs of WT, Lsd1 KO1, Lsd1 KO2, LSD1WT and LSD1MUT mouse ESCs at day 0 and day 8 of EB differentiation. β-ACTIN is used as the loading control. J Morphological representation (10x magnification) and (K) measurement of the length of gastruloids derived from WT, Lsd1 KO1, Lsd1 KO2, LSD1WT, and LSD1MUT mouse ESCs at indicated time points. Scale bar, 200 µm. Bar graph depicting the RT-qPCR analysis of (L) pluripotency (Oct4), (M) endodermal (Sox17), (N) mesodermal (T), (O) ectodermal (Sox11 and Nestin), and (P) patterning (Hoxd3) markers in the gastruloids generated from WT, Lsd1 KO1, Lsd1 KO2, LSD1WT, and LSD1MUT mouse ESCs at 0 h and 120 h of gastrulation. mRNA levels are relative to the expression of WT at 0 h. β-actin is used as an internal control. Statistical analysis: Two-tailed unpaired t-test (D, K) and two-way ANOVA (EH and LP). ∗p < 0.05, ∗∗p < 0.01, ∗∗∗p < 0.001, and ∗∗∗∗p < 0.0001. Error bars denote mean ± SD; n ≥ 3 (DH and KP). Each dot in the bar graphs represents independent biological replicates (DH, K and LP). Results are one representative of n = 3 independent biological experiments (C, I and J). Uncropped blots are represented in the source data.
Fig. 3
Fig. 3. Ablation of LSD1 affects global H3K4me1 levels.
A Quantification of H3K4 methylation (K4me1, K4me2, and K4me3) in WT and Lsd1 KO ESCs. Each modification represents the percentage of one modified peptide among the total modified peptides observed in independent replicates. B Genomic distribution of LSD1 binding in the promoter (within 5 kb upstream of TSS) and promoter-distal regions (left) and the fraction of different regions such as distal intergenic, exon, and intron within promoter-distal regions (right) in WT mouse ESCs. C Enriched transcription factor motifs at LSD1 peaks in WT mouse ESCs. Homer algorithm was used to estimate the P-values of each motif discovery (the enrichment of the sequence in the dataset) as well as the P-values of each motif discovery (the similarity to a known motif). The size of the blobs represents the percentage of sequences with the motif in the dataset. D Pie chart representing the percentage of LSD1-only bound genes, bound and activated in Lsd1 KO1, KO2 or KO1/KO2 mouse ESCs, and bound and repressed in Lsd1 KO1, KO2 or KO1/KO2 mouse ESCs. E Venn diagram of overlapped genes in H3K4me1 ChIP-seq between WT and Lsd1 KO2 mouse ESCs. F GO analysis of biological processes of genes associated with LSD1 peaks in WT mouse ESCs and H3K4me1 peaks in WT and Lsd1 KO2 mouse ESCs. P-values were adjusted with the Benjamini–Hochberg correction. LSD1 and H3K4me1 ChIP-seq signals in WT and Lsd1 KO2 mouse ESCs at the (G) Nanog and (H) Sox11 enhancers. Respective inputs are depicted in gray. I Venn diagram of genes retrieved from H3K4me1 CUT & RUN in WT, Lsd1 KO2, LSD1WT and LSD1MUT mouse ESCs. Density plots of H3K4me1 signals at (J) enhancers and (K) super-enhancers regions in WT, Lsd1 KO2, LSD1WT and LSD1MUT mouse ESCs. L Density plots of regions co-occupied by LSD1 and H3K4me1 in WT, Lsd1 KO2, LSD1WT and LSD1MUT mouse ESCs. Gene ontology analysis of (M) common genes and (N) genes exclusive to KO-associated H3K4me1 peaks. P-values were adjusted with the Benjamini–Hochberg correction. Statistical analysis: Two-tailed unpaired t-test (A). ∗p < 0.05, ∗∗p < 0.01. Error bars denote mean ± SD; n = 3 (A). Each dot in the bar graphs represents independent biological replicates (A). The exact P-values for panels (A) are represented in the source data.
Fig. 4
Fig. 4. Loss of LSD1 affects global DNA methylation.
A LC-MS/MS quantification of 5mC/dC and (B) dot blot analysis of 5mC/dC (left panel) of genomic DNA extracted from WT and Lsd1 KO mouse ESCs. Methylene blue staining was used as loading control (right panel). C LC/MS-MS quantification and (D) dot blot analysis of 5mC/dC (left panel) of genomic DNA extracted from WT, Lsd1 KO2, KO2EV, and LSD1WT mouse ESCs. Methylene blue staining was used as loading control (right panel). E LC/MS-MS quantification of 5mC in genomic DNA extracted from WT, Lsd1 KO2, LSD1WT, and LSD1MUT mouse ESCs. F Bar graph showing percentage methylated CpGs in Lsd1 KO mouse ESCs and WT. G Heatmap generated from whole-genome bisulfite-sequencing depicting global DNA methylation in WT and Lsd1 KO mouse ESCs. Red corresponds to the hypermethylation CpG sites, and in blue, the hypomethylation CpG sites. H Percentage of hypomethylation regions in the promoter, gene body, and distal regulatory elements in Lsd1 KOs. Promoter (−5kb to +500 bp from TSS), Gene body ( + 500 bp from TSS to +500 bp from TES), and Distal ( > 5 kb upstream or >500 bp downstream) were considered for the analysis. I Density plot of DNA methylation β values of WT, Lsd1 KO2, LSD1WT, and LSD1MUT mouse ESCs. Methylation values range from zero (fully unmethylated) to one (fully methylated). J Principal component analysis of array-based DNA methylation profiles of WT, Lsd1 KO2, LSD1WT, and LSD1MUT mouse ESCs. K Heatmap and unsupervised hierarchical clustering of methylation levels in 10,000 random CpGs in WT, Lsd1 KO2, LSD1WT, and LSD1MUT mouse ESCs. Red corresponds to the hypermethylated CpG sites, and blue to the hypomethylated CpG sites. Hierarchical clustering was performed with Euclidean distance and Ward´s minimum variance agglomeration method. L Bar graph representing number of differentially hypomethylated positions in Lsd1 KO2, LSD1WT, and LSD1MUT compared to WT mouse ESCs. MO Volcano plots of differentially methylated positions (DMPs) in (M) Lsd1 KO2 (N) LSD1WT and (O) LSD1MUT compared to WT mouse ESCs. Red dots indicate significant results (FDR < 0.05 and value of ∆β < −0.66 or >0.66). For differential methylation analysis, DNA methylation values are fitted to a mixed linear model and the corresponding slope test is performed. The slope estimate is the DNA methylation difference for each CpG with respect to the reference level (X-axis). The y-axis contains the FDR adjusted p-value of two-tailed unpaired t-testing the slope. Scatter correlation plots of (P) promoter methylation and (Q) body or 3’UTR methylation and gene expression in Lsd1 KO compared to WT mouse ESCs. Y-axis represents the log10 fold change of Reads Per Kilobase of transcript per Million mapped reads (FC RPKM) from RNA-seq and x-axis represents β -value methylation difference. Spearman rank correlation coefficient and corresponding P-value are shown. R Genomic distribution of hypomethylated regions in Lsd1 KO2 compared to WT mouse ESCs. S Pie chart representing distribution of hypomethylated sites with respect to CGI positions. in Lsd1 KO2 compared to WT mouse ESCs. Statistical analysis: Two-tailed unpaired t-test (A, C, and E). ∗∗p < 0.01, ∗∗∗p < 0.001, and ∗∗∗∗p < 0.0001. Error bars denote mean ± SD; n ≥ 3 (A, C and E). Each dot in the bar graphs represents independent biological replicates (A, C, and E). Results are one representative of n = 3 independent biological experiments (B and D).
Fig. 5
Fig. 5. Deletion of Lsd1 leads to impaired DNA methylation machinery.
Western blots of LSD1, DNMT1, and UHRF1 on (A) WCE and (B) chromatin fractions of WT and Lsd1 KO mouse ESCs. β-ACTIN and H3 are used as the loading controls. Western blotting assay with antibodies against LSD1, cMYC, DNMT1, and UHRF1 on (C) WCE and (D) chromatin fractions of WT, Lsd1 KO2, LSD1WT, and LSD1MUT mouse ESCs. β-ACTIN and H3 are used as the loading controls. E, F Relative levels of Dnmt1 and Uhrf1 mRNA in the WT, Lsd1 KO2, LSD1WT, and LSD1MUT mouse ESCs assessed by RT-qPCR. The mRNA levels are relative to WT mouse ESCs. G Line graph representing the demethylase activity of WT LSD1 proteins over time. H3K4me2 was used as a positive substrate for LSD1 demethylase activity. Western blots of LSD1, DNMT1, and UHRF1 on (H) WCE and (I) chromatin fractions of vehicle and LSD1 inhibitor (GSK_LSD1) treated WT mouse ESCs. β-ACTIN and H3 are used as the loading controls. LC-MS/MS quantification of 5mC on genomic DNA in WT mouse ESCs treated with a vehicle and inhibitor (GSK_LSD1) upon (J) 24 h and (K) 1 week of treatment. L Genomic distribution of DNMT1 binding regions (left) and within different regions of the promoter (right). M Bar diagram depicting number of DNMT1 ChIP peaks in WT and Lsd1 KO2 mouse ESCs. N The violin plot depicts the relative 5mC distribution in DNMT1 ChIP peaks in WT and Lsd1 KO2 mouse ESCs. O DNMT1 ChIP–seq heatmap in WT and Lsd1 KO2 mouse ESCs in promoters (left) and enhancers (right). P GO analysis of biological processes of genes associated with DNMT1 peaks in WT mouse ESCs. Q Venn diagram of overlapped genes associated with LSD1 and DNMT1 ChIP-seq peaks in WT mouse ESCs. R LSD1 ChIP-seq signal in WT mouse ESCs and DNMT1 ChIP-seq signal in WT, Lsd1 KO2 and Dnmt1 KO mouse ESCs at the Nanog enhancer. Respective inputs are depicted in gray. Statistical analysis: ordinary one-way ANOVA (E and F) and two-tailed unpaired t-test (J and K). ns – non-significant. Error bars denote mean ± SD; n = 3 (E, F, J and K). Each dot in the bar graphs represents independent biological replicates (E, F, J and K). Results are one representative of n = 3 independent biological experiments (AD and H, I). Uncropped blots are represented in the source data.
Fig. 6
Fig. 6. Loss of LSD1 diminishes DNMT1 and UHRF1 stability.
LSD1 immunoprecipitation on the (A) WCE and (B) nuclear fraction of WT, Lsd1 KO2, and LSD1MUT mouse ESCs followed by immunoblotting of LSD1, DNMT1 and UHRF1. The percentage of input used is 10%. Immunoprecipitation of LSD1 in the presence of (C) DNase I on the nuclear fraction and (D) RNase on the WCE of WT ESCs followed by LSD1, DNMT1, UHRF1, and HDAC1 immunoblotting. The percentage of input used is 10%. E Western blots of LSD1, DNMT1, and UHRF1 on the WCE of WT, Lsd1 KO2, LSD1WT, and LSD1MUT mouse ESCs during a 9 h CHX time course treatment. β-ACTIN is used as the loading control. Protein degradation curves of (F) DNMT1 and (G) UHRF1 during the course of 9 h of CHX treatment generated from (E). Protein expression is normalized to β-ACTIN and relative to time 0 h. HJ Comparison of the expression between significantly differentially expressed transcripts (y-axis) and proteome (x-axis) profiling in (H) KO, (I) LSD1WT and (J) LSD1MUT compared to WT mouse ESCs. Proteins exclusively upregulated and downregulated in proteome are represented in red and blue, respectively (1.2 < FC > 1.2). FDR value was calculated with the Benjamini–Hochberg correction for transcriptome. For transcriptome profiling, p < 0.05 and fold change (FC) > 1.5 were considered. K GO analysis of biological processes related to the downregulated proteins that are exclusive to Lsd1 KO2 mouse ESCs (p < 0.05 and FC < 0.8). L GO analysis of biological processes related to the upregulated proteins that are exclusive to Lsd1 KO2 mouse ESCs (p < 0.05 and FC > 1.2). M Western blots of LSD1, DNMT1, and UHRF1 on the WCE of WT and Lsd1 KO2 mouse ESCs at 0 and 4 h after MG132 treatment. β-ACTIN is used as the loading control. N, O Bar graph representing the protein recovery of (N) DNMT1 and (O) UHRF1 after quantification and normalization of the bands from (M). Protein expression is relative to WT mouse ESCs at 0 h. The quantification of samples derive from the same experiment and blots were processed in parallel. Statistical analysis: Two-tailed unpaired t-test (F, G, N and O). ∗p < 0.05, ∗∗p < 0.01, and ∗∗∗p < 0.001. Error bars denote mean ± SD; n = F (WT = 5, KO2 = 3, LSD1WT = 5 and LSD1MUT = 4) and G (WT = 6, KO2 = 4, LSD1WT = 6 and LSD1MUT = 4) (independent biological experiments). Each dot in the bar graphs represents independent biological replicates (N and O). The exact P-values for panels (FG and NO) are represented in the source data. Results are one representative of n = 3 independent biological experiments (AE and M). Uncropped blots are represented in the source data.
Fig. 7
Fig. 7. LSD1 promotes USP7-mediated DNMT1 and UHRF1 deubiquitination.
A Western blots of USP7, DNMT1, and UHRF1 in the scramble and knockdown of Usp7 at 0 and 4 h after MG132 treatment. β-ACTIN is used as the loading control. Relative (B) DNMT1 and (C) UHRF1 protein retrieval after quantification and normalization of band from (A) in Usp7-depleted mouse ESCs compared to scramble. The quantification of samples derive from the same experiment and blots were processed in parallel. D Western blotting of DNMT1 and UHRF1 on the WCE of WT and Usp7-depleted mouse ESCs during a 9 h CHX time course treatment. β-ACTIN is used as the loading control. Protein stability curves of (E) DNMT1 and (F) UHRF1 were generated from the measurement and normalization of bands from (D) upon depletion of USP7 in mouse ESCs. G USP7 immunoprecipitation in WT, LSD1WT, and LSD1MUT mouse ESCs followed by immunoblotting of USP7 and LSD1. The percentage of input used is 10%. H USP7 immunoprecipitation on the WCE of WT, Lsd1 KO, and LSD1MUT mouse ESCs followed by LSD1, DNMT1, and UHRF1 immunoblotting. The percentage of input used is 10%. I Immunoprecipitation of DNMT1 on the WCE of WT and DNMT1- inducible Lsd1 KO mouse ESCs followed by USP7 immunoblotting. The percentage of input used is 10%. J UHRF1 immunoprecipitation on the WCE of WT and UHRF1- inducible Lsd1 KO mouse ESCs followed USP7 immunoblotting. The percentage of input used is 10%. Immunoprecipitation of HDAC1 on the WCE of WT mouse ESCs followed by DNMT1, UHRF1, and LSD1 immunoblotting. The percentage of input used is 10%. K Western blotting of LSD1, DNMT1, UHRF1, and HDAC1 on the WCE of (L) TSA (M) SAHA-treated WT mouse ESCs at different concentrations. β-ACTIN is used as the loading control. N Western blotting of DNMT1 and UHRF1 on the WCE of DMSO and TSA-treated WT mouse ESCs on the indicated time points of MG-123 treatment. β-ACTIN is used as the loading control. Bar graph depicting the protein recovery of (O) DNMT1 and (P) UHRF1 in TSA-treated WT mouse ESCs after quantification and normalization of bands from (N) compared to DMSO treated WT ESCs. Q USP7 immunoprecipitation on the WCE of TSA and SAHA-treated WT mouse ESCs followed by LSD1, DNMT1, and UHRF1 immunoblotting. The percentage of input used is 10%. Immunoprecipitation of endogenous DNMT1 (R) and UHRF1 (S) on the WCE from MG-132 treated WT, Lsd1 KO2, LSD1WT, and LSD1MUT mouse ESCs, followed by immunoblotting for ubiquitin. Immunoprecipitation of endogenous DNMT1 (T) and UHRF1 (U) on the WCE from MG-132 treated scramble and Usp7-depleted mouse ESCs, followed by immunoblotting for ubiquitin. Immunoprecipitation of endogenous DNMT1 (V) and UHRF1 (W) on the WCE from WT mouse ESCs treated with DMSO or PD22077 in the presence of MG-132, followed by ubiquitin immunoblotting. Statistical analysis: Two tailed unpaired t-test (B, C, E, F, O and P). ∗p < 0.05, and ∗∗p < 0.01. Error bars denote mean ± SD; n = (E (Scr = 4, Usp7 sh1 = 3 and Usp7 sh2 = 3) and F (Scr = 3, Usp7 sh1 = 3, and Usp7 sh2 = 3)). Each dot in the bar graphs represents independent biological replicates (B, C, O and P). The exact P-values for panels (B, C, E, F, O and P) are represented in the source data. Results are one representative of n = 3 independent biological experiments (A, D, GN, and QW). Uncropped blots are represented in the source data.
Fig. 8
Fig. 8. Graphical illustration of the model.
LSD1 and LSD1MUT (non-catalytic) interacts with HDAC1 to deacetylate DNMT1 and UHRF1, promoting their stability. Non-catalytic LSD1 also interacts with USP7 to facilitate DNMT1 and UHRF1 de-ubiquitination and stability. Additionally, non-catalytic LSD1 can also recruit DNMT1 at specific loci. Non-catalytic LSD1 is required for DNA methylation and mouse ESC proliferation. LSD1 catalytic activity is required for H3K4me1 demethylation at both pluripotency and developmental enhancers. Such demethylase activity is required for proper mouse ESC differentiation.

Similar articles

Cited by

References

    1. Atlasi, Y. & Stunnenberg, H. G. The interplay of epigenetic marks during stem cell differentiation and development. Nat. Rev. Genet.18, 643–658 (2017). 10.1038/nrg.2017.57 - DOI - PubMed
    1. Boland, M. J., Nazor, K. L. & Loring, J. F. Epigenetic regulation of pluripotency and differentiation. Circ. Res.115, 311–324 (2014). 10.1161/CIRCRESAHA.115.301517 - DOI - PMC - PubMed
    1. Malla, S., Melguizo-Sanchis, D. & Aguilo, F. Steering pluripotency and differentiation with N(6)-methyladenosine RNA modification. Biochim. Biophys. Acta Gene Regul. Mech.1862, 394–402 (2019). 10.1016/j.bbagrm.2018.10.013 - DOI - PubMed
    1. Shi, Y. et al. Histone demethylation mediated by the nuclear amine oxidase homolog LSD1. Cell119, 941–953 (2004). 10.1016/j.cell.2004.12.012 - DOI - PubMed
    1. Forneris, F. et al. Histone demethylation catalysed by LSD1 is a flavin-dependent oxidative process. FEBS Lett.579, 2203–2207 (2005). 10.1016/j.febslet.2005.03.015 - DOI - PubMed

Publication types

MeSH terms