. 2024 Sep 5;15(1):7759.
doi: 10.1038/s41467-024-51993-4.

A bitopic agonist bound to the dopamine 3 receptor reveals a selectivity site

Affiliations

A bitopic agonist bound to the dopamine 3 receptor reveals a selectivity site

Sandra Arroyo-Urea et al. Nat Commun. .

Abstract

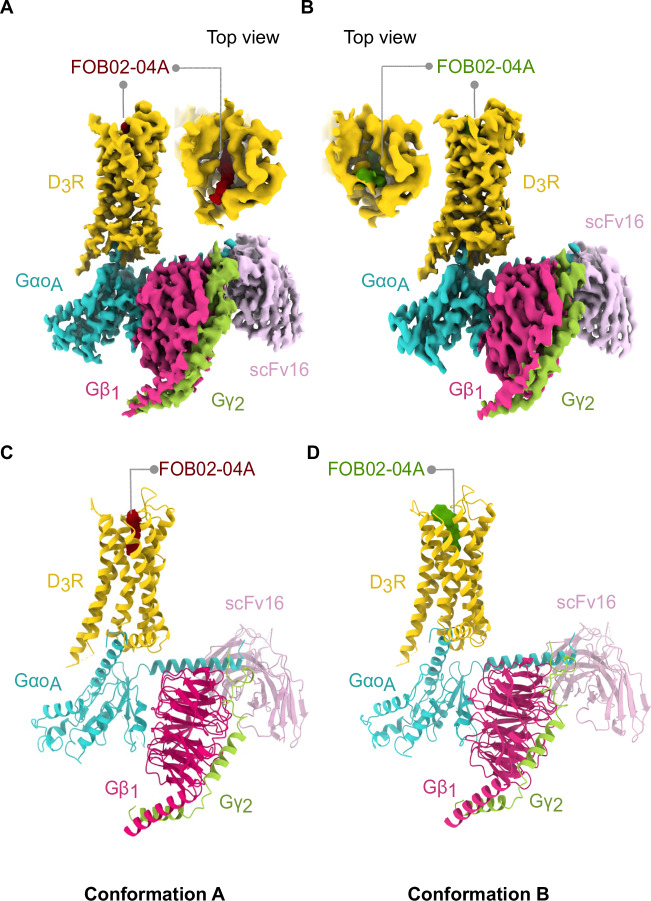
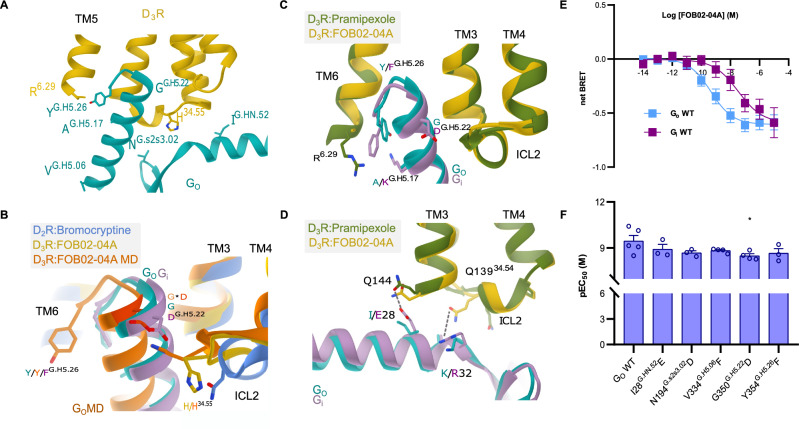
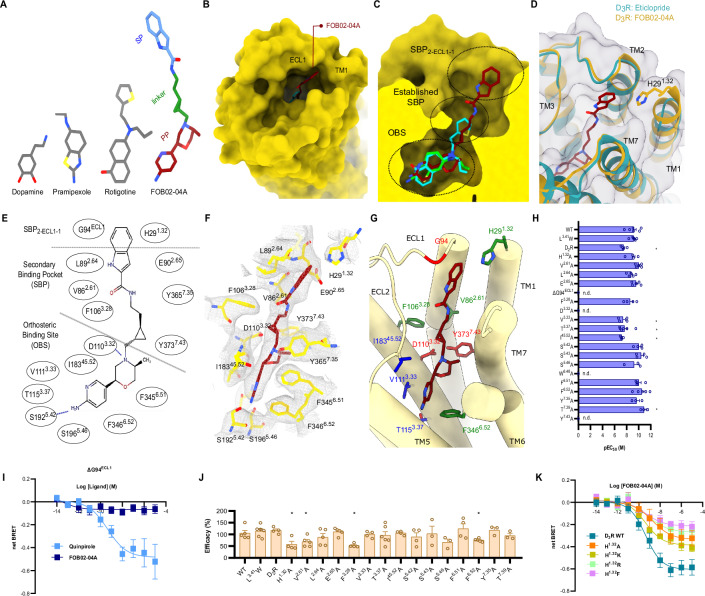
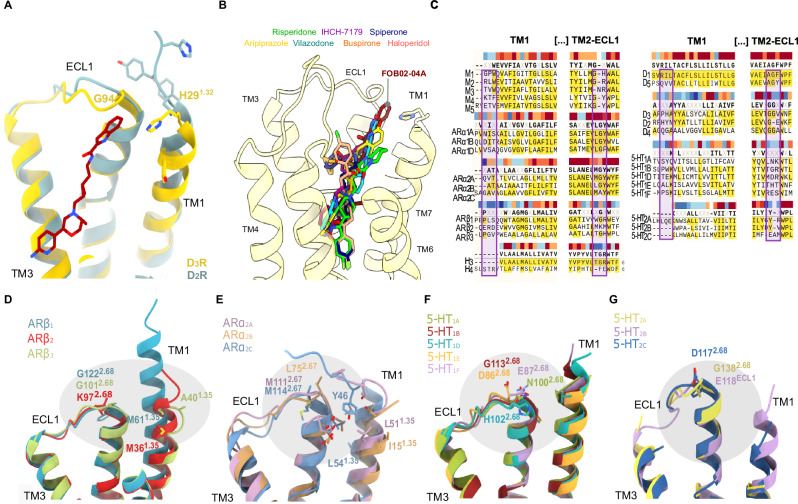
Although aminergic GPCRs are the target for ~25% of approved drugs, developing subtype selective drugs is a major challenge due to the high sequence conservation at their orthosteric binding site. Bitopic ligands are covalently joined orthosteric and allosteric pharmacophores with the potential to boost receptor selectivity and improve current medications by reducing off-target side effects. However, the lack of structural information on their binding mode impedes rational design. Here we determine the cryo-EM structure of the hD3R:GαOβγ complex bound to the D3R selective bitopic agonist FOB02-04A. Structural, functional and computational analyses provide insights into its binding mode and point to a new TM2-ECL1-TM1 region, which requires the N-terminal ordering of TM1, as a major determinant of subtype selectivity in aminergic GPCRs. This region is underexploited in drug development, expands the established secondary binding pocket in aminergic GPCRs and could potentially be used to design novel and subtype selective drugs.


Conflict of interest statement

The authors declare no competing interests.

Figures

Fig. 1
Fig. 1. Overall cryo-EM reconstruction of the D3R-GO:FOB02-04A complex.
A, B Cryo-EM maps for the D3R-GOA:FOB02-04A complex in Conformation A (A) and B (B) are shown with an inset into the ligand binding site from the top view. Cryo-EM density is colored according to subunit with the bitopic ligand colored in red (Conformation A) and green (Conformation B). C, D Coordinates for Conformation A (C) and B (D) for both complexes are shown as cartoons and colored by subunit with the bitopic ligand colored in red (Conformation A) and green (Conformation B).
Fig. 2
Fig. 2. Coupling of D3R to GO heterotrimer.
A Interaction details of the D3R:GO interface when bound to FOB02-04A. Cryo-EM density of the C-terminal α5 is shown as mesh. B Interaction details of α5 interaction of GO (turquoise, cryo-EM; orange, MD simulations) and Gi (violet, PDB 7JVR) with ICL2 of D3R (yellow, cryo-EM structure; orange, MD simulation) and D2R (blue, PDB 7JVR). Mutation at residue G350G.H5.22 to D in GO-MD is highlighted in dark orange and shown with an asterisk. C Comparison of the C-terminal α5 interaction of Gi (PDB 7CMU) and GO (D3R-GO:FOB02-04A). D Interaction details of N-terminal GO (turquoise) and Gi (violet) with ICL2 of D3R. E Concentration-response curve of D3R upon GOA and Gi1 activation by FOB02-04A using the TRUPATH assay. pEC50 values are means ± SEM of five independent experiments performed in technical triplicate. F pEC50 values for D3R in response to GOA mutants activation by FOB02-04A using the TRUPATH assay. Data are presented as means ± SEM of three (GOA I28G.HN.52E, N194G.s2s3.02D, Y354G.H5.26F), four (GOA-V334G.H5.06F, G350G.H5.22D,) and five (GOA WT) independent experiments performed in technical triplicate. *p < 0.05 (one-way ANOVA with Dunnett post hoc analysis) for G350G.H5.22D (p = 0.048). All source data within this figure is provided as a Source Data file.
Fig. 3
Fig. 3. Binding of the bitopic FOB02-04A to the D3R receptor.
A Schematic of dopamine, pramipexole, rotigotine and the bitopic FOB02-04A ligand shown as sticks and colored by component. B Binding of the secondary pharmacophore (SP) (sticks, dark red) to a groove-shaped pocket at the D3R (yellow, surface representation) formed by ECL1 and TM1. C Two views of a comparison of FOB02-04A (dark red carbon, sticks), pramipexole (green carbon, sticks), and rotigotine (cyan carbon, sticks) binding into the D3R pocket (yellow, surface representation). Dashed circles indicate OBS, established SBP, and the SBP2-ECL1-1 site. D Overall binding mode of the bitopic molecule to the D3R and ordering of TM1 upon bitopic binding. FOB02-04A (dark red, sticks) is displayed on superposed structures of D3R bound to eticlopride (cartoon, cyan) and FOB02-04A (cartoon, yellow) E Schematic of the FOB02-04A binding into the D3R ligand binding pocket. F Binding details of FOB02-04A (dark red, sticks) at the D3R (yellow sticks) with cryo-EM density as gray mesh. G Binding details of FOB02-04A (dark red, sticks) at the D3R (yellow cartoons) with residues at the ligand binding pocket colored by functional effect when mutated to alanine: decreased efficacy – green carbons, decreased potency – blue carbon and non-detectable binding – red carbon. H pEC50 values for alanine mutation of the residues at the ligand binding site in response to GOA activation by FOB02-04A using the TRUPATH assay. All data are means ± SEM of four independent experiments (n = 4) performed in technical triplicates except for D1103.32A, S1965.46A, Y3657.35A, T3697.39A, W3426.48A and Y3737.43A for which there was n = 3, WT, V862.61A, L892.64A, E902.65A, ∆G94ECL1, F3466.52A for there was n = 5, and L1193.41W, T1153.37A for which there was n = 6. *p < 0.05 (one-way ANOVA with Dunnett post hoc analysis) for D2R (p = 0.0081), V1113.33A (p = 0.0049), T1153.37A (p = 0.0074) and I18345.82A (p = 0.0013) and nd - non-detectable. I Concentration-response curve of D3R ΔG94ECL1 upon GOA activation by quinpirole (light blue, n = 4) and FOB02-04A (deep blue, n = 5) (shown as net BRET). All data are means ± SEM of the specified biological replicates, each performed in technical triplicates. J Emax values for alanine mutation of the residues at the ligand binding site in response to GOA activation by FOB02-04A using the TRUPATH assay. Emax values have been normalized to D3R WT. All data are means ± SEM of four independent experiments performed in technical triplicate (n = 4) except for D1103.32A, S1965.46A, Y3657.35A, T3697.39A, W3426.48A, Y3737.43A (n = 3), WT, V862.61A, L892.64A, E902.65A, ∆G94ECL1, F3466.52A (n = 5) and L1193.41W, T1153.37A (n = 6). *p < 0.05 (Holm-Sidak multiple comparisons tests two-tailed p value) for H291.32A (p = 0.016), V862.61A (p = 0.026), F1063.28A (p = 0.003), F3466.52A (p = 0.019). K Concentration-response curves of D3R H291.32A (orange), H291.32F (pink), H291.32K (yellow), and H291.32R (green) upon GOA activation by FOB02-04A (shown as net BRET). All data are means ± SEM derived from three independent experiments (n = 3), each performed in technical triplicate except for H291.32A (n = 4). All source data within this figure is provided as a Source Data file.
Fig. 4
Fig. 4. Sequence and structural diversity of the SBP2-ECL1-1 in aminergic GPCRs.
A Comparison of the D3R (yellow cartoons with relevant residues as sticks) and D2R (light blue cartoons with relevant residues as sticks) TM2-ECL1 and TM1 regions within reach of FOB02-04A (dark red, sticks). B Relative binding sites of other bitopic ligands bound to D2R (haloperidol (PDB 6LUQ), spiperone (PDB 7DFP), risperidone (PDB 6CM4) and 5-HT1AR (aripiprazole (PDB 7E2Z), IHCH-7179 (PDB 8JT6), vilazodone (PDB 8FYL) and buspirone (PDB 8FYX) as shown on the D3R:FOB02-04A cryo-EM structure. C Sequence alignment of TM1 and TM2-ECL1 regions in aminergic GPCRs with residues around the SBP2-ECL1-1 embedded in a box. Sequence conservation is color-coded above each residue position (gradient from dark red, conserved, to dark blue, non-conserved). Structural differences at the SBP2-ECL1-1 site among closely related adrenergic receptors (D, E) and serotonin receptors (F, G). Receptors are shown as cartoons colored by receptors with relevant residues shown as sticks.
Fig. 5
Fig. 5. Conformation A and B within the D3R-GO:FOB02-04A complex.
Coordinates of the D3R (yellow cartoon, with relevant residues as sticks) are shown with FOB02-04A in Conformation A (dark red, sticks) superposed to Conformation B (green, sticks). Cryo-EM density is shown as gray mesh for Conformation A (A) and Conformation B (B) with both superposed FOB02-04A conformations. C Predicted binding poses of bitopic FOB02-04A with D3R obtained by MD simulations showing Conformation A and Conformation B with intramolecular interactions shown as black dashed lines. Black arrows indicate distances for assessing bitopic FOB02-04A binding pose distribution between Conformations A and B with specified closest distances (E902.65 carboxyl group in D3R to FOB02-04A indole atom N5 and from Y3657.35 4-hydroxyphenyl moiety in D3R to the phenyl ring of FOB02-04A 1H-indole-2-carboxamide SP). A semi-transparent skin reveals the receptor molecular surface, which is colored by residue properties (red (acidic), blue (basic), green (hydrophobic)). D Interaction dynamics between D3R E902.65 and FOB02-04A SP (depicted in brown palette) compared with proximity distance between D3R Y3657.35 and the SP of FOB02-04A (shown in green palette) suggest that FOB02-04A predominantly adopts Conformation A over B. Data from five independent simulations of the D3R-GαOβγ heterotrimer complex are shown, spanning 0.6 μs of cumulative time per system, with a sampling rate of 10 frames per ns. Solid lines and same-color shadows represent moving average values and one standard deviation, respectively, from 50 frames in all cases.

Update of

Similar articles

Cited by

References

    1. Santos, R. et al. A comprehensive map of molecular drug targets. Nat. Rev. Drug Discov.16, 19–34 (2016). 10.1038/nrd.2016.230 - DOI - PMC - PubMed
    1. Sánchez-Soto, M. et al. Evidence for noncanonical neurotransmitter activation: Norepinephrine as a dopamine D2-like receptor agonist. Mol. Pharm.89, 457–466 (2016). 10.1124/mol.115.101808 - DOI - PMC - PubMed
    1. Michino, M. et al. What can crystal structures of aminergic receptors tell us about designing subtype-selective ligands? Pharm. Rev.67, 198–213 (2015). 10.1124/pr.114.009944 - DOI - PMC - PubMed
    1. Lane, J. R., Sexton, P. M. & Christopoulos, A. Bridging the gap: Bitopic ligands of G-protein-coupled receptors. Trends Pharm. Sci.34, 59–66 (2013). 10.1016/j.tips.2012.10.003 - DOI - PubMed
    1. Valant, C., Robert Lane, J., Sexton, P. M. & Christopoulos, A. The best of both worlds? bitopic orthosteric/allosteric ligands of g proteincoupled receptors. Annu Rev. Pharm. Toxicol.52, 153–178 (2012). 10.1146/annurev-pharmtox-010611-134514 - DOI - PubMed

Publication types

LinkOut - more resources