. 2024 Sep 5;14(1):20672.
doi: 10.1038/s41598-024-71625-7.

Biological function and potential application of PANoptosis-related genes in colorectal carcinogenesis

Affiliations

Biological function and potential application of PANoptosis-related genes in colorectal carcinogenesis

Xuan Yu et al. Sci Rep. .

Abstract

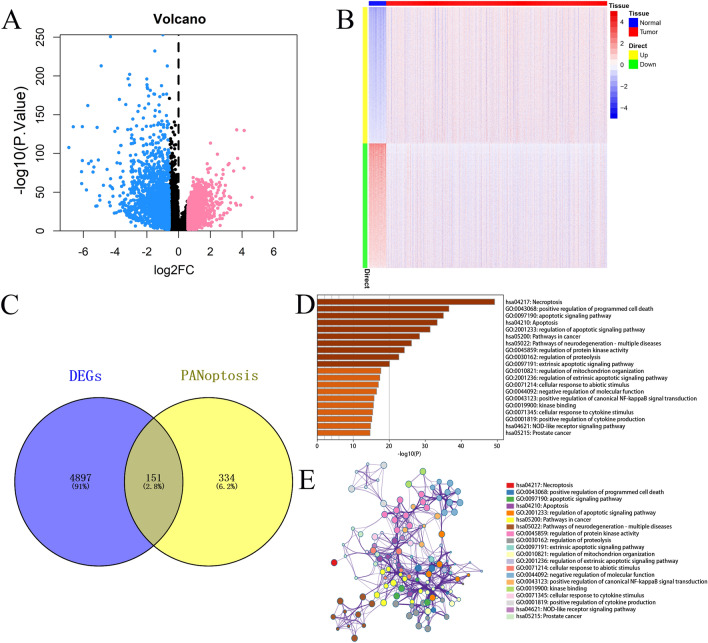
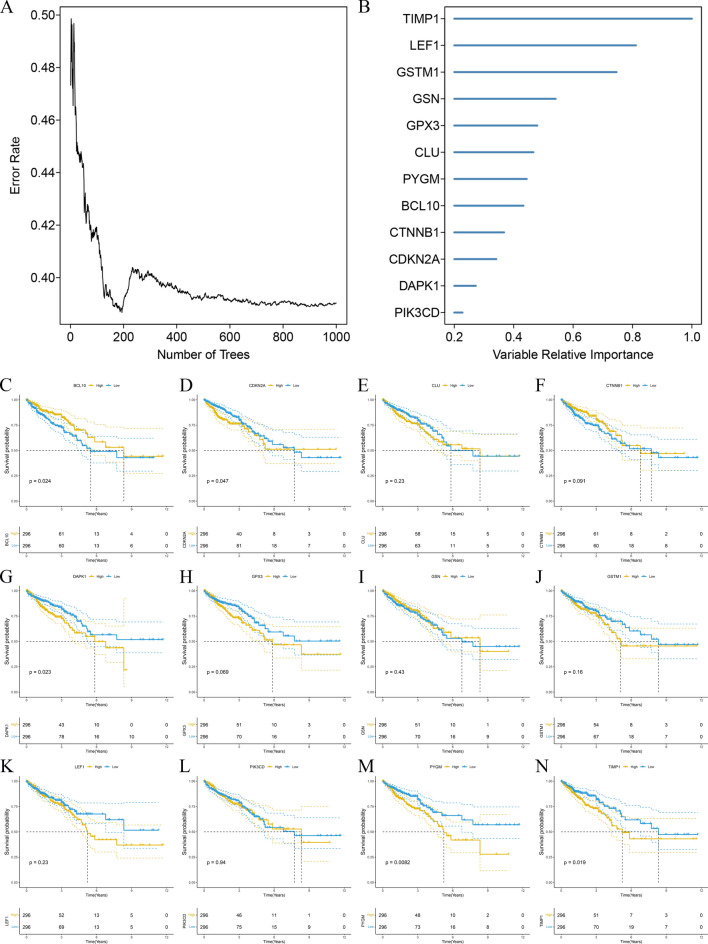
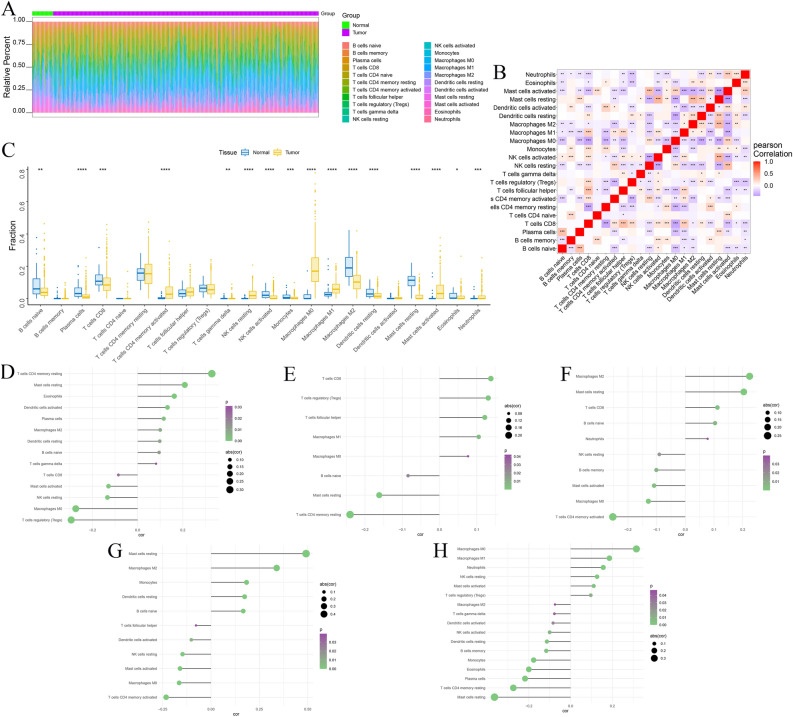
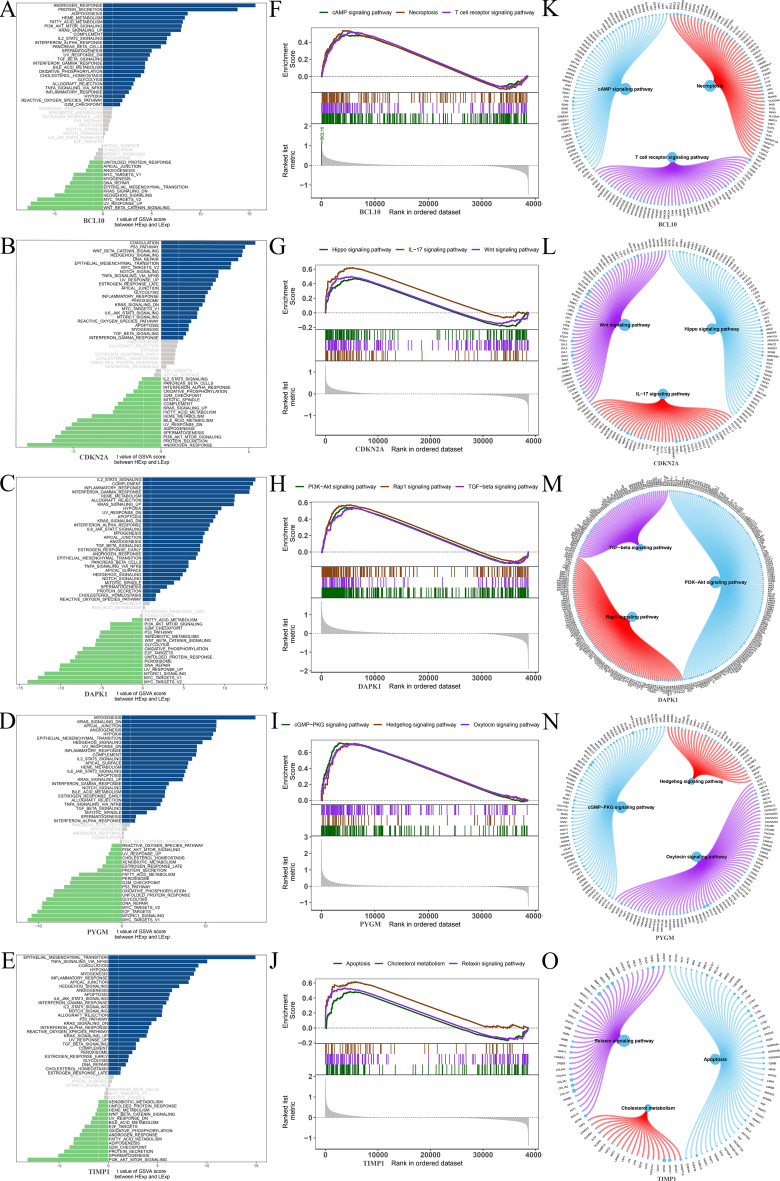
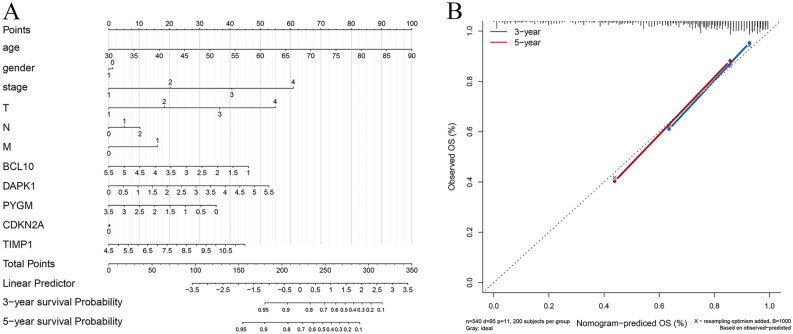
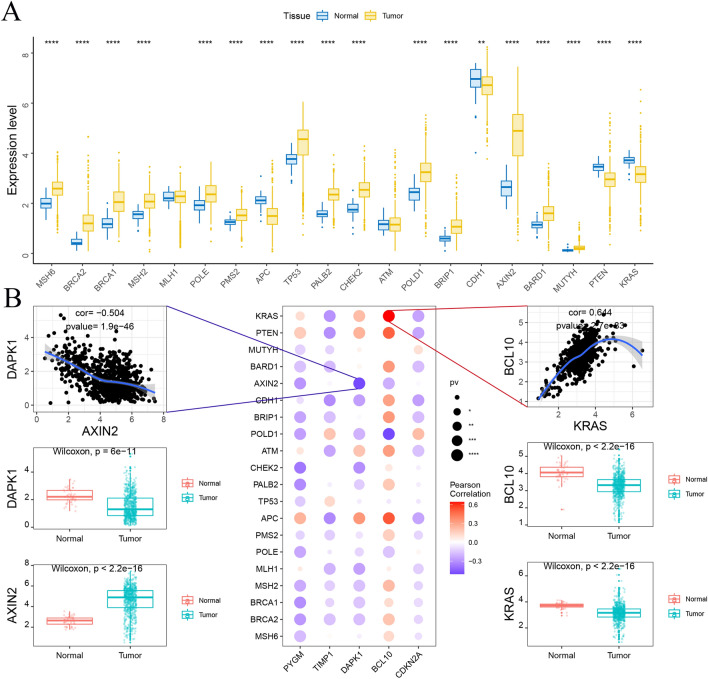
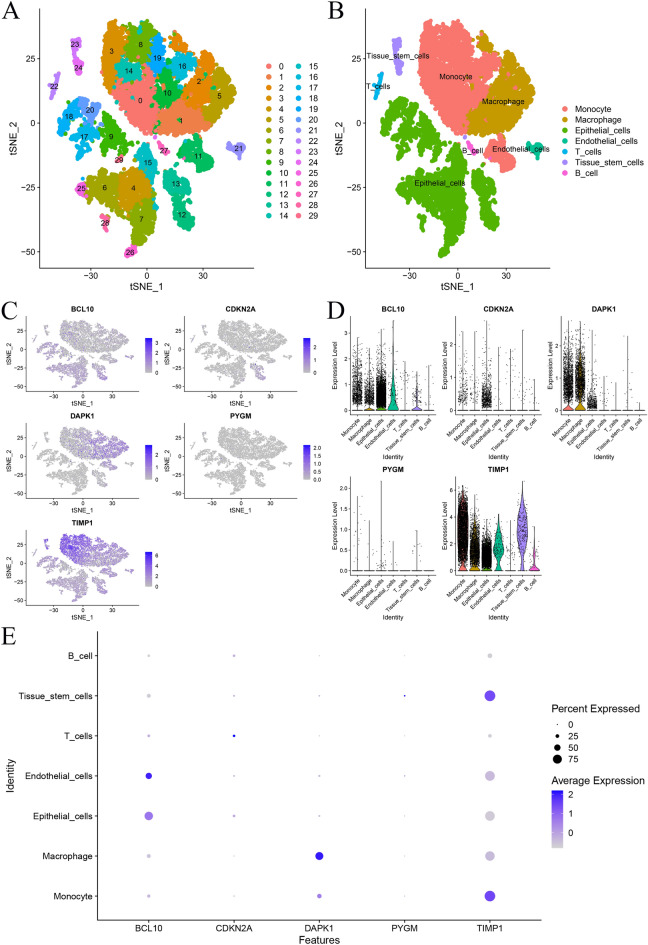
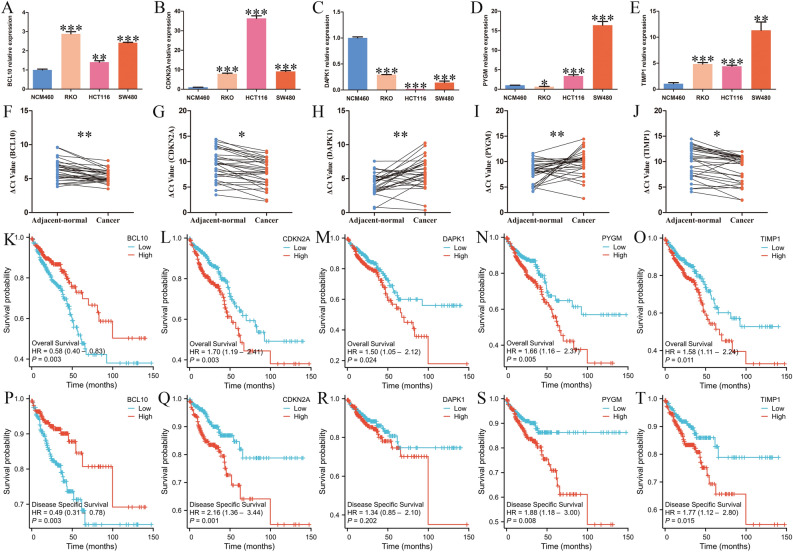
PANoptosis induces programmed cell death (PCD) through extensive crosstalk and is associated with development of cancer. However, the functional mechanisms, clinical significance, and potential applications of PANoptosis-related genes (PRGs) in colorectal cancer (CRC) have not been fully elucidated. Functional enrichment of key PRGs was analyzed based on databases, and relationships between key PRGs and the immune microenvironment, immune cell infiltration, chemotherapy drug sensitivity, tumor progression genes, single-cell cellular subgroups, signal transduction pathways, transcription factor regulation, and miRNA regulatory networks were systematically explored. This study identified 5 key PRGs associated with CRC: BCL10, CDKN2A, DAPK1, PYGM and TIMP1. Then, RT-PCR was used to verify expression of these genes in CRC cells and tissues. Clinical significance and prognostic value of key genes were further verified by multiple datasets. Analyses of the immune microenvironment, immune cell infiltration, chemotherapy drug sensitivity, tumor progression genes, single-cell cellular subgroups, and signal transduction pathways suggest a close relationship between these key genes and development of CRC. In addition, a novel prognostic nomogram model for CRC was successfully constructed by combining important clinical indicators and the key genes. In conclusion, our findings offer new insights for understanding the pathogenesis of CRC, predicting CRC prognosis, and identifying multiple therapeutic targets for future CRC therapy.

Keywords: Chemotherapy drug sensitivity; Colorectal cancer; Immune microenvironment; Nomogram; PANoptosis; Prognosis.


Conflict of interest statement

The authors declare no competing interests.

Figures

Fig. 1
Fig. 1
Identification and functional enrichment of DEGs associated with CRC-related PANoptosis. (A) Volcano plot of differential gene expression. Blue and pink indicate downregulated and upregulated differential expression, respectively (screening conditions: P < 0.05 and |Log2FC|> 0.585). (B) Heatmap of differential gene expression. (C) Venn diagram of differentially expressed genes (DEGs) in CRC and PANoptosis-related genes (PRGs). (D,E) Functional enrichment of intersecting genes. GO-KEGG enrichment analysis of intersection genes from the Metascape database (D). A cluster network of enriched pathways in which nodes that share the same cluster are often located close to each other (E).
Fig. 2
Fig. 2
Screening of key PRGs associated with CRC progression and survival analysis. (A) Random survival forest analysis plot of 151 differentially expressed genes. (B) Importance ranking of 12 feature genes that met the criteria among intersecting genes. (CN) Survival analysis of 12 characteristic genes. Kaplan–Meier analysis of the overall survival difference between BCL10 (C), CDKN2A (D), CLU (E), CTNNB1 (F), DAPK1 (G), GPX3 (H), GSN (I), GSTM1 (J), LEF1 (K), PIK3CD (L), PYGM (M) and TIMP1 (N) high- and low-expression groups.
Fig. 3
Fig. 3
The landscape of immune infiltration between CRC and normal groups. (A) Relative percentages of 22 immune cells across all samples. (B) Heatmap showing the correlation of infiltration of 22 immune cell types. The colored squares represent the strength of the correlation; red represents a positive correlation, whereas purple represents a negative correlation. The deeper the color is, the stronger the correlation is. (C) Differences in immune cell content between normal patients (blue) and patients with CRC (yellow). P < 0.05 was considered to indicate statistical significance. (DH) Spearman correlations of BCL10 (D), CDKN2A (E), DAPK1 (F), PYGM (G), and TIMP1 (H) gene expression with immune cell content.
Fig. 4
Fig. 4
Functional and pathway enrichment analysis of key genes. (AE) Correlation analysis results of GSVA for BCL10 (A), CDKN2A (B), DAPK1 (C), PYGM (D) and TIMP1 (E) in CRC. (FO) Correlation analysis results of GSEA for BCL10, CDKN2A, DAPK1, PYGM and TIMP1 in CRC and molecular interaction networks between various pathways.
Fig. 5
Fig. 5
Establishment and validation of the prognostic nomogram. (A) Nomogram based on the key gene signature and clinical information for predicting 3- and 5-year OS in patients with CRC. (B) Calibration curves were used to verify the consistency of the predicted and actual 3- and 5-year outcomes (x‐axis: predicted survival probabilities; y‐axis: actual observed survival probabilities). OS, overall survival.
Fig. 6
Fig. 6
Correlation analysis of CRC-related genes. (A) Differential analysis of disease-regulating genes. Differences in expression of CRC-related genes between normal (yellow) and with CRC (blue) samples. (B) Correlation analysis of key genes and differentially expressed regulatory genes. The first plot indicates that DAPK1 correlated significantly negatively with AXIN2, the second plot indicates the Pearson correlation between regulatory genes and key genes, and the third plot indicates that BCL10 correlated significantly positively with KRAS. Purple and red indicate negative and positive correlations, respectively. The Pearson correlation coefficients and P values are shown at the top of the graphs (P < 0.01 indicates a significant correlation).
Fig. 7
Fig. 7
Single-cell analysis. (A) Cell clustering yielded 30 subtypes. (B) Annotating each subtype by “SingleR” from the R package. (CE) Scatter plot (C), violin plot (D) and bubble plot (E) shows expression of five key genes in Monocyte, Macrophage, Epithelial_cells, Endothelial_cells, T_cells, Tissue_stem_cells and B_cell.
Fig. 8
Fig. 8
Validation of the differential expression of BCL10, CDKN2A, DAPK1, PYGM and TIMP1 in CRC cells and tissues. (AE) mRNA expression levels of key genes in different cell lines (NCM460, HCT116, SW480 and RKO) were measured by qRT-PCR. The results were normalized to the reference gene GAPDH. Data are shown as means ± SDs, and two-tailed unpaired t tests were used for statistical analysis of each marker; n = 4 independent experiments. (FJ) The expression levels of key genes in CRC tissues (n = 30) and adjacent normal tissues (n = 30). (KT) Analysis of the overall survival (OS) and disease-specific survival (DSS) of the key genes. (*P < 0.05, **P < 0.01, ***P < 0.001).

Similar articles

Cited by

References

    1. Du, M. et al. Integrated multi-omics approach to distinct molecular characterization and classification of early-onset colorectal cancer. Cell Rep. Med.4, 100974 (2023). 10.1016/j.xcrm.2023.100974 - DOI - PMC - PubMed
    1. Sung, H. et al. Global cancer statistics 2020: GLOBOCAN estimates of incidence and mortality worldwide for 36 cancers in 185 countries. CA Cancer J. Clin.71, 209–249 (2021). 10.3322/caac.21660 - DOI - PubMed
    1. Arnold, M. et al. Global patterns and trends in colorectal cancer incidence and mortality. Gut66, 683–691 (2017). 10.1136/gutjnl-2015-310912 - DOI - PubMed
    1. Nfonsam, V., Wusterbarth, E., Gong, A. & Vij, P. Early-onset colorectal cancer. Surg. Oncol. Clin. N. Am.31, 143–155 (2022). 10.1016/j.soc.2021.11.001 - DOI - PubMed
    1. Klimeck, L., Heisser, T., Hoffmeister, M. & Brenner, H. Colorectal cancer: A health and economic problem. Best Pract. Res. Clin. Gastroenterol.66, 101839 (2023). 10.1016/j.bpg.2023.101839 - DOI - PubMed

MeSH terms