. 2024 Sep 5;14(1):20770.
doi: 10.1038/s41598-024-72024-8.

Glioblastoma mesenchymal subtype enhances antioxidant defence to reduce susceptibility to ferroptosis

Affiliations

Glioblastoma mesenchymal subtype enhances antioxidant defence to reduce susceptibility to ferroptosis

Simona D'Aprile et al. Sci Rep. .

Abstract

Glioblastoma (GBM) represents an aggressive brain tumor, characterized by intra- and inter-tumoral heterogeneity and therapy resistance, leading to unfavourable prognosis. An increasing number of studies pays attention on the regulation of ferroptosis, an iron-dependent cell death, as a strategy to reverse drug resistance in cancer. However, the debate on whether this strategy may have important implications for the treatment of GBM is still ongoing. In the present study, we used ferric ammonium citrate and erastin to evaluate ferroptosis induction effects on two human GBM cell lines, U-251 MG, with proneural characteristics, and T98-G, with a mesenchymal profile. The response to ferroptosis induction was markedly different between cell lines, indeed T98-G cells showed an enhanced antioxidant defence, with increased glutathione levels, as compared to U-251 MG cells. Moreover, using bioinformatic approaches and analysing publicly available datasets from patients' biopsies, we found that GBM with a mesenchymal phenotype showed an up-regulation of several genes involved in antioxidant mechanisms as compared to proneural subtype. Thus, our results suggest that GBM subtypes differently respond to ferroptosis induction, emphasizing the significance of further molecular studies on GBM to better discriminate between various tumor subtypes and progressively move towards personalized therapy.

Keywords: Erastin; Ferroptosis; Glioblastoma; Iron overload; Mesenchymal subtype; Proneural subtype.


Conflict of interest statement

The authors declare no competing interests.

Figures
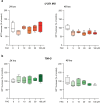
Fig. 1
Fig. 1
Effect of FAC administration on MTT turnover on U-251 MG and T98-G cell lines. (a) MTT turnover on U-251 MG treated with 0, 5, 10, 20, 50, 100 µM of FAC at 24 and 48 h. (b) MTT turnover on T98-G treated with 0, 5, 10, 20, 50, 100 µM of FAC at 24 and 48 h. Data are shown via standard box and whiskers of n ≥ 3 independent replicates for each experimental condition. *p-value < 0.05; **p-value < 0.01; versus 0 µM controls.
Fig. 2
Fig. 2
MTT turnover on U-251 MG and T98-G cells after erastin administration. (a) MTT turnover on U-251 MG, 24 and 48 h post-erastin treatment at different concentrations (0, 1, 2, 5, 10, 20 µM). (b) MTT turnover on T98-G, 24 and 48 h post-erastin treatment at different concentrations (0, 1, 2, 5, 10, 20 µM). Data are shown via standard box and whiskers of n ≥ 3 independent replicates for each experimental condition. *p-value < 0.05; **p-value < 0.01; ***p-value < 0.001 versus 0 µM controls.
Fig. 3
Fig. 3
ROS production in U-251 MG and T98-G cells after FAC and erastin administration. (a) Area under curve (AUC) quantification for % of H2-DCF positive events in U-251 MG, following 30, 90 and 180 min of FAC and erastin treatment. (b) Representative plots of ROS production at 180 min post-treatment in U-251 MG. (c) AUC quantification for % of H2-DCF positive events in T98-G, following 30, 90 and 180 min of FAC and erastin treatments. (d) Representative plots of ROS production at 180 min post-treatment in T98-G. Data are shown as mean ± SEM of n = 4 independent experiments. *p-value < 0.05; **p-value < 0.01.
Fig. 4
Fig. 4
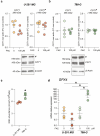
Western blot for CD71, GSH levels analysis and mRNA expression levels of GPX4. (a) Quantification of western blot analysis of CD71 bands at 90 kDa and at about 180 kDa (labelled by #), and representative cropped blots on U-251 MG exposed to 0 or 100 µM of FAC. (b) Quantification of western blot analysis of CD71 bands at 90 kDa and at about 180 kDa (labelled by #), and representative cropped blots on T98-G exposed to 0 or 100 µM of FAC. Data are expressed as FC over control ± SEM of n = 4 independent experiments. Whole uncropped blots are presented in Figure S2. (c) GSH basal levels in U-251 MG and T98-G cells. Data are expressed as mean ± SEM of n = 3 independent experiments. *p-value < 0.05. (d) qRT-PCR analysis of mRNA expression levels of GPX4 in both U-251 MG and T98-G cell lines exposed to 0 or 100 µM of FAC. Data are expressed as mean ± SEM of n ≥ 3 independent experiments. *p-value < 0.05.
Fig. 5
Fig. 5
U-251 MG and T98-G cells expression levels of proneural and mesenchymal markers. (a) Heatmap of Z-score values of selected signature markers of either mesenchymal or proneural GBM subtypes on 7 selected cell lines included in the dataset GSE119637. (b) Z-score expression levels of signature markers of either mesenchymal or proneural subtype for T98-G and U-251 MG cells included in Cancer Cell Line Encyclopedia (CCLE) of Xena UCSC.
Fig. 6
Fig. 6
Bioinformatic analysis on RNA-seq dataset of human GBM biopsies. (a) Volcano plot of selected 209 genes, divided into three groups. (b) Genes down-regulated in mesenchymal tumors as compared to proneural ones. (c) Genes up-regulated in mesenchymal tumors as compared to proneural ones. Data are expressed as mean ± SD and aligned dot plot. **p-value < 0.01; ***p-value < 0.001 and ****p-value < 0.0001.
Fig. 7
Fig. 7
Overall survival (OS) and Progression Free Interval (PFI) analysis of GBM patients. (a–d) Kaplan Meier plot of OS and PFI of GBM patients selected for high versus low expression of mesenchymal markers (cut-off value = 73.57) (a), proneural markers (cut-off value = 50.27) (b), mesenchymal iron mobility (cut-off value = 54.83) (c) and mesenchymal redox (cut-off value = 170.4) (d). *p-value < 0.05; **p-value < 0.01.

Similar articles

Cited by

References

    1. Wirsching, H. G., Galanis, E. & Weller, M. Glioblastoma. Handb. Clin. Neurol.134, 381–397. 10.1016/B978-0-12-802997-8.00023-2 (2016). 10.1016/B978-0-12-802997-8.00023-2 - DOI - PubMed
    1. Torrisi, F. et al. Epigenetics and metabolism reprogramming interplay into glioblastoma: Novel insights on immunosuppressive mechanisms. Antioxidants12, 220. 10.3390/antiox12020220 (2023). 10.3390/antiox12020220 - DOI - PMC - PubMed
    1. Wen, P. Y. et al. Glioblastoma in adults: A Society for Neuro-Oncology (SNO) and European Society of Neuro-Oncology (EANO) consensus review on current management and future directions. Neuro Oncol.22, 1073–1113. 10.1093/neuonc/noaa106 (2020). 10.1093/neuonc/noaa106 - DOI - PMC - PubMed
    1. Fabro, F., Lamfers, M. L. M. & Leenstra, S. Advancements, challenges, and future directions in tackling glioblastoma resistance to small kinase inhibitors. Cancers14, 600. 10.3390/cancers14030600 (2022). 10.3390/cancers14030600 - DOI - PMC - PubMed
    1. Torrisi, F. et al. The hallmarks of glioblastoma: Heterogeneity, intercellular crosstalk and molecular signature of invasiveness and progression. Biomedicines10, 806. 10.3390/biomedicines10040806 (2022). 10.3390/biomedicines10040806 - DOI - PMC - PubMed