. 2024 Oct;43(42):3081-3093.
doi: 10.1038/s41388-024-03149-3. Epub 2024 Sep 5.

PPM1D activity promotes cellular transformation by preventing senescence and cell death

Affiliations

PPM1D activity promotes cellular transformation by preventing senescence and cell death

Miroslav Stoyanov et al. Oncogene. 2024 Oct.

Abstract

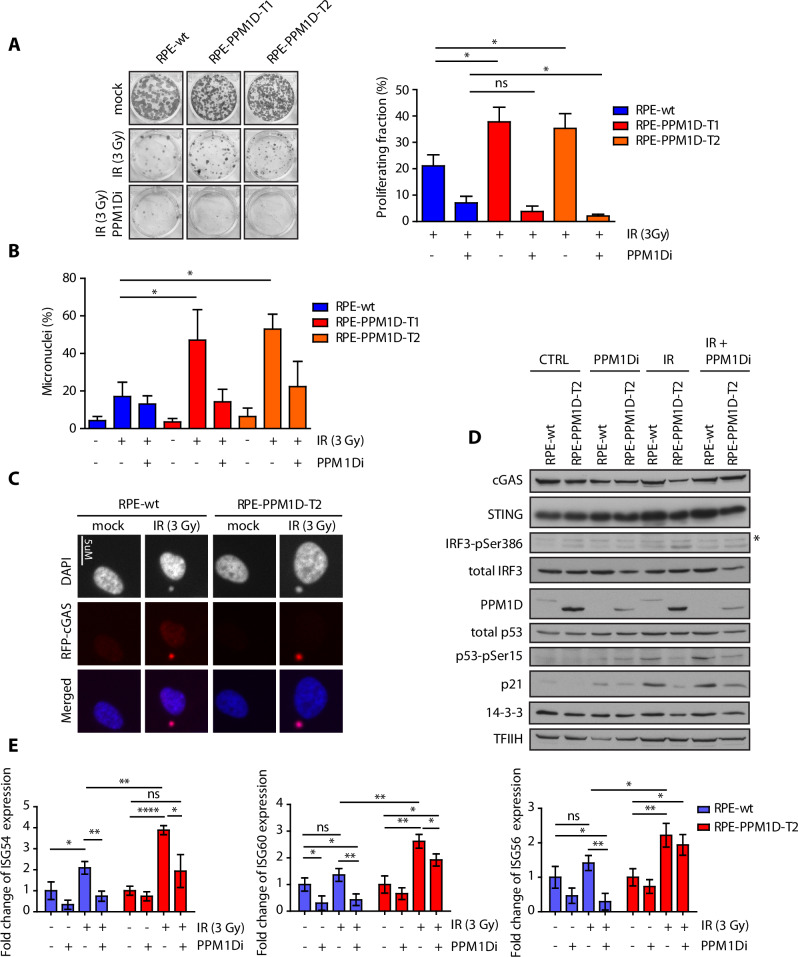
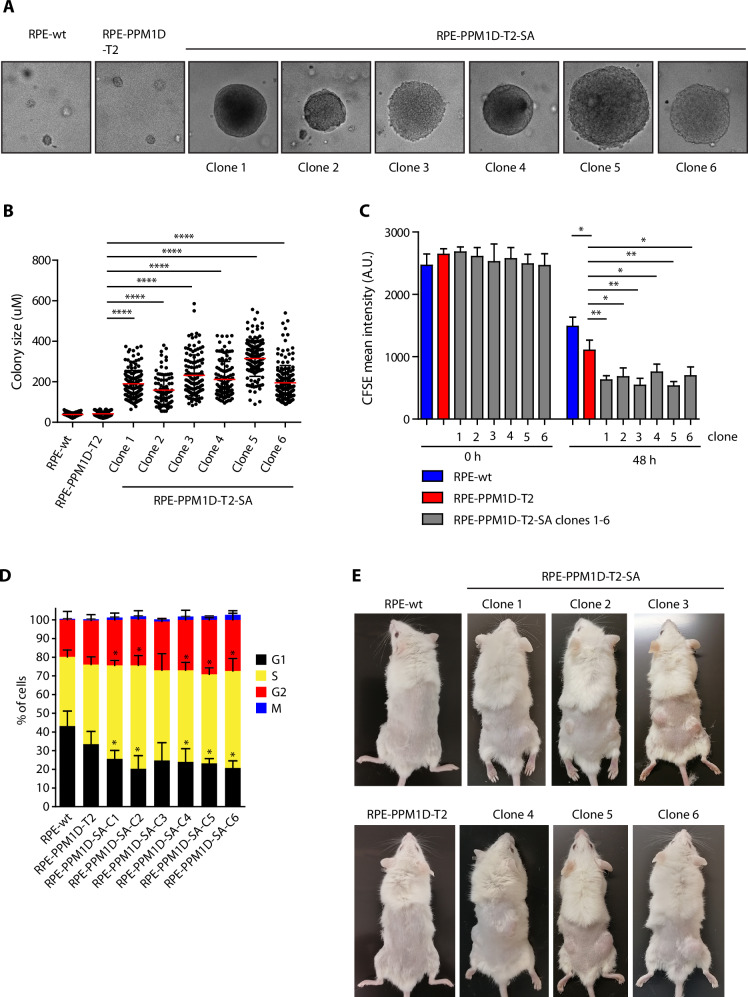
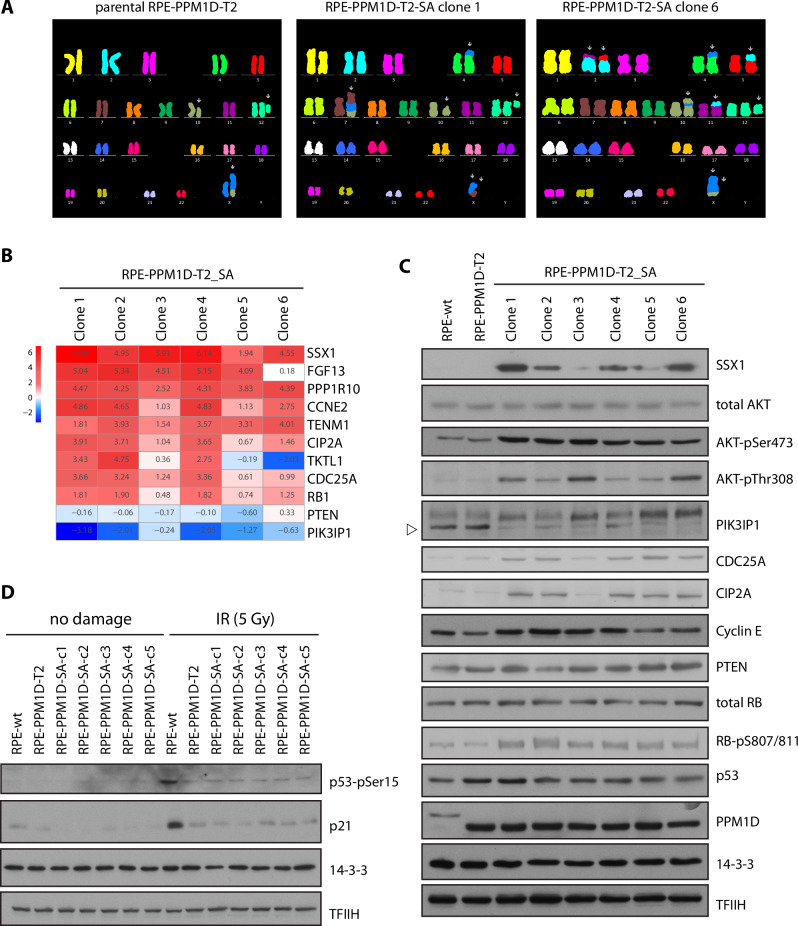
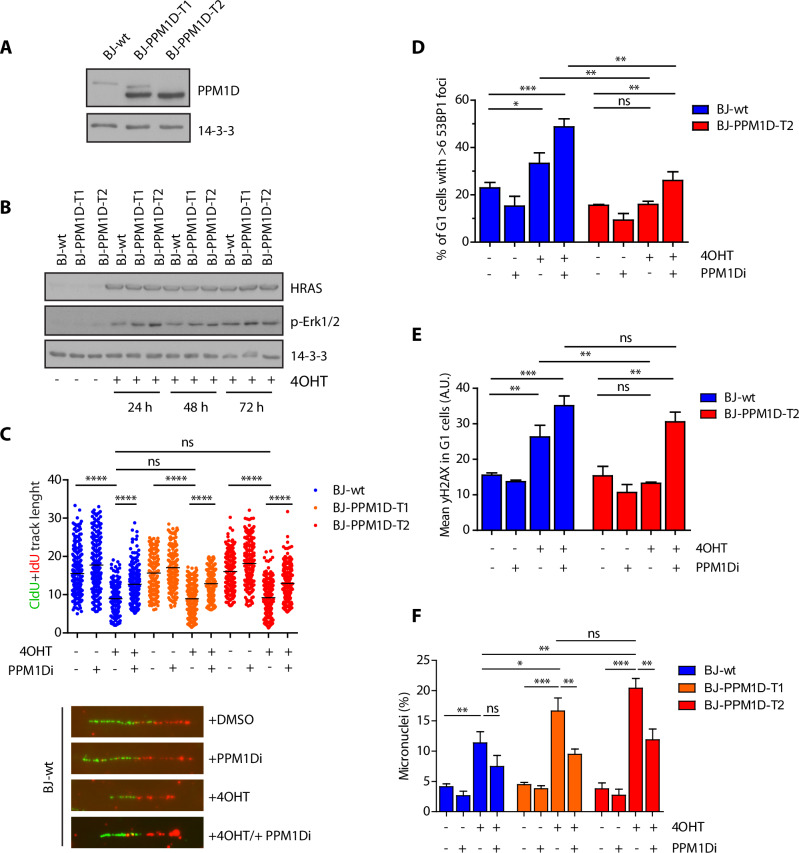
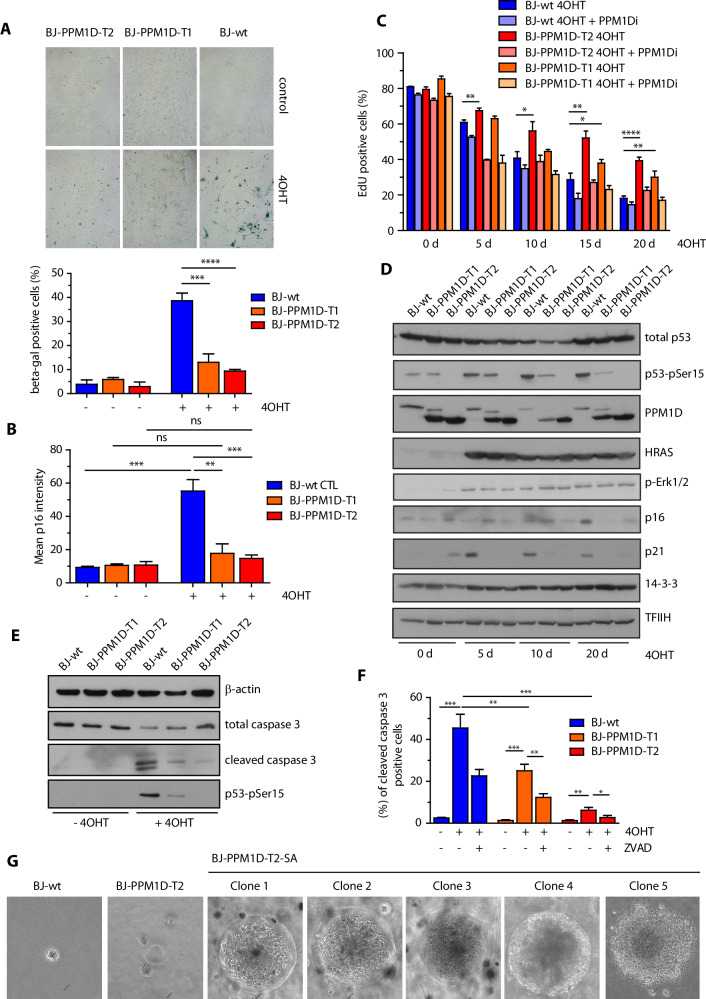
Cell cycle checkpoints, oncogene-induced senescence and programmed cell death represent intrinsic barriers to tumorigenesis. Protein phosphatase magnesium-dependent 1 (PPM1D) is a negative regulator of the tumour suppressor p53 and has been implicated in termination of the DNA damage response. Here, we addressed the consequences of increased PPM1D activity resulting from the gain-of-function truncating mutations in exon 6 of the PPM1D. We show that while control cells permanently exit the cell cycle and reside in senescence in the presence of DNA damage caused by ionising radiation or replication stress induced by the active RAS oncogene, RPE1-hTERT and BJ-hTERT cells carrying the truncated PPM1D continue proliferation in the presence of DNA damage, form micronuclei and accumulate genomic rearrangements revealed by karyotyping. Further, we show that increased PPM1D activity promotes cell growth in the soft agar and formation of tumours in xenograft models. Finally, expression profiling of the transformed clones revealed dysregulation of several oncogenic and tumour suppressor pathways. Our data support the oncogenic potential of PPM1D in the context of exposure to ionising radiation and oncogene-induced replication stress.


Conflict of interest statement

The authors declare no competing interests.

Figures

Fig. 1
Fig. 1. Cells carrying the truncated PPM1D form micronuclei after exposure to ionising radiation.
A Parental RPE, RPE-PPM1D-T1 and RPE-PPM1D-T2 cells were mock treated or irradiated (3 Gy) in the presence or absence of PPM1Di and further cultured for 10 d. Surviving fraction was calculated by normalising the colony number to the non-treated control for each genotype. Error bars indicate SD. Statistical significance was determined by Student’s t test (*p ≤ 0.05, n = 3). B Parental RPE, RPE-PPM1D-T1 and RPE-PPM1D-T2 cells were mock treated or irradiated (3 Gy) in presence or absence of PPM1Di and fixed after 48 h. Cells were then stained with DAPI and percentage of cells containing micronuclei was determined microscopically. More than 200 cells per condition were quantified in each experiment (n = 3), error bars indicate SD. Statistical significance was determined by Student’s t test (*p ≤ 0.05) C Parental RPE and RPE-PPM1D-T2 cells were stably transfected RFP-cGAS and were fixed 48 h after mock treatment or irradiation (3 Gy). Note accumulation of RFP-cGAS in MNs in cells exposed to IR. D Parental RPE and RPE-PPM1D-T2 stably transfected with RFP-cGAS were mock treated or irradiated (3 Gy) in presence or absence of PPM1Di. Whole cell lysates were collected after 48 h and analysed by immunoblotting. Asterisk indicates a non-specific reactivity. Signal of IRF3-pSer386 was quantified in ImageJ from 3 independent repeats and was normalised to the loading control (TFIIH) and to the non-treated condition. Statistical significance was determined by Student’s t test (*p ≤ 0.05, n = 3, error bars indicate SD). E RNA was collected from cells grown as in (D) and expression of indicated genes was analysed by qPCR. Statistical significance was calculated by Student’s t test (*p ≤ 0.05, **p ≤ 0.01, ****p ≤ 0.0001).
Fig. 2
Fig. 2. PPM1D activity promotes cell transformation after exposure to ionising radiation.
A Parental RPE and RPE-PPM1D-T2 cells were mock treated or irradiated (3 Gy) and were grown in semi-solid media for 12 weeks. Six independent clones of RPE-PPM1D-T2-SA cells were collected. B Colony size of parental RPE cells, parental RPE-PPM1D-T2 cells and transformed RPE-PPM1D-T2 clones was acquired after propagating in the semisolid media for 2 weeks. Each dot represents a single colony, red line indicates mean colony size, bars show SD, n = 2. C Cell division was monitored by labelling of cells with CFSE. A zero time point was collected to determine the initial labelling and the rest of the samples were collected after 48 h. Cell were then collected and fixed and analysed by FACS. Plotted is the mean intensity of CFSE signal, error bars indicate SD, n = 3. Statistical significance was calculated using Student’s t test (*p ≤ 0.05, **p ≤ 0.01). D Cell cycle distribution was determined in parental RPE, parental RPE-PPM1D-T2 cells and transformed RPE-PPM1D-T2 clones using flow cytometry. Plotted are fractions of cells in G1, S, G2 and M phases of the cell cycle. Error bars indicate SDs, n = 3. E Nude mice were subcutaneously injected with parental RPE cells, parental RPE-PPM1D-T2 cells and transformed RPE-PPM1D-T2 clones and tumour growth was evaluated after 3 weeks.
Fig. 3
Fig. 3. Genomic rearrangements and differential expression in cells with high PPM1D activity.
A Parental RPE-PPM1D-T2 cells and transformed RPE-PPM1D-T2-SA (clones 1 and 6) were arrested in mitosis, fixed and probed by M-FISH. Karyotyping of the remaining clones is shown in Suppl. Figure 2A. B Selected genes differentially expressed in parental RPE-PPM1D-T2 and transformed RPE-PPM1D-T2-SA cells. The heat map shows the differential expression normalised to nontransformed parental RPE-PPM1D-T2 cells. C Asynchronously growing parental RPE, RPE-PPM1D-T2 and transformed RPE-PPM1D-T2-SA clones 1–6 were lysed and expression of selected proteins was determined by immunoblotting. TFIIH and 14-3-3 were used as loading controls. Arrowhead indicates the position of PIK3IP protein. D Parental RPE, RPE-PPM1D-T2 and transformed RPE-PPM1D-T2-SA clones 1–6 were exposed or not to a high dose of IR (5 Gy), collected after 6 h and whole cell lysates were analysed by immunoblotting.
Fig. 4
Fig. 4. Impact of PPM1D activity on RAS-induced replication stress.
A BJ-hTert-HRASV12ER-TAM and two clones expanded after targeting the exon 6 of PPM1D by CRISPR/Cas9 were analysed by immunoblotting. Staining for actin was used as loading control. B BJ-hTert-HRASV12ER-TAM, BJ-hTert-HRASV12ER-TAM-PPM1D-T1 and BJ-hTert-HRASV12ER-TAM-PPM1D-T2 cells were induced with 4OHT for indicated times and whole cell lysates were analysed by immunoblotting. Staining for 14-3-3 protein was used as loading control. C BJ-hTert-HRASV12ER-TAM, BJ-hTert-HRASV12ER-TAM-PPM1D-T1 and BJ-hTert-HRASV12ER-TAM-PPM1D-T2 were induced with 4OHT for 2 d and were labelled with CldU and IdU 20 min. Plotted is the sum of the length (μm) of CldU and IdU labelled tracks, each dot represents one replication fork, n = 3. Black line indicates mean. Statistical significance was calculated by Student’s t test (****p ≤ 0.0001). D BJ-hTert-HRASV12ER-TAM and BJ-hTert-HRASV12ER-TAM-PPM1D-T2 cells were induced with 4OHT for 5 d and formation of 53BP1 nuclear foci was evaluated by ScanR microscopy. Plotted is a fraction of cells with ≥6 53BP1 nuclear foci. More than 300 cells were quantified per experiment, bars indicate SD, n = 3. Statistical significance was calculated by Student’s t test (*p ≤ 0.05, **p ≤ 0.01, ***p ≤ 0.001). E Cells from (D) were probed for γH2AX and analyzed by ScanR microscopy. Plotted is mean nuclear signal of γH2AX in G1 cells. Statistical significance was calculated by Student’s t test (**p ≤ 0.01, ***p ≤ 0.001). F BJ-hTert-HRASV12ER-TAM, BJ-hTert-HRASV12ER-TAM-PPM1D-T1 and BJ-hTert-HRASV12ER-TAM-PPM1D-T2 induced with 4OHT for 5 d. Fraction of cells containing MN was determined microscopically. Bars indicate SD, more than 150 cells per condition were quantified in each experiment, n = 3. Statistical significance was calculated by Student’s t test (ns p > 0.05; *p ≤ 0.05, **p ≤ 0.01, ***p ≤ 0.001).
Fig. 5
Fig. 5. PPM1D activity impairs OIS and promotes cell transformation.
A BJ-hTert-HRASV12ER-TAM, BJ-hTert-HRASV12ER-TAM-PPM1D-T1 and BJ-hTert-HRASV12ER-TAM-PPM1D-T2 cells were induced or not with 4OHT for 20 d and stained for β-galactosidase activity. Plotted is the fraction of β-gal positive cells, bars indicate SD, n = 3. Statistical significance was calculated by Student’s t test (***p ≤ 0.001, ****p ≤ 0.0001). B Cells grown as in A were fixed and stained for p16. Plotted is the mean nuclear p16 intensity, bars indicate SD. More than 300 cells of each condition were quantified per experiment, n = 3. Statistical significance was calculated by Student’s t test (**p ≤ 0.01, ***p ≤ 0.001). C Cells as in A were induced with 4OHT for 5 to 20 days were incubated with EdU 24 h prior fixation followed by CLICK-IT reaction. Fraction of EdU positive cells was analysed using FACS. Bars indicate SD, n = 3. Statistical significance was calculated by Student’s t test (*p ≤ 0.05, **p ≤ 0.01, ****p ≤ 0.0001). D Whole cell lysates from cells from (C) were analyzed by immunoblotting using indicated antibodies. E BJ-hTert-HRASV12ER-TAM, BJ-hTert-HRASV12ER-TAM-PPM1D-T1 and -T2 cells were treated or not with 4OHT for 5 days. Whole cell lysates were probed with indicated antibodies by immunoblotting. F Cells treated as in (E) were analysed by flow cytometry. Where indicated, cells were incubated in the presence of Z-VAD-FMK. Plotted is the fraction of cleaved caspase 3 positive cells. Bars indicate SD, n = 3. Statistical significance was calculated by Student’s t test. G Parental BJ-hTert-HRASV12ER-TAM, parental BJ-hTert-HRASV12ER-TAM-PPM1D-T2, and BJ-hTert-HRASV12ER-TAM-PPM1D-T2-60 cells that survived 2-month continuous induction with 4OHT were cultured in semisolid media for 10 weeks.

References

    1. Hanahan D, Weinberg RA. Hallmarks of cancer: the next generation. Cell. 2011;144:646–74. - PubMed
    1. Jackson SP, Bartek J. The DNA-damage response in human biology and disease. Nature. 2009;461:1071–8. - PMC - PubMed
    1. Bartkova J, Horejsi Z, Koed K, Kramer A, Tort F, Zieger K, et al. DNA damage response as a candidate anti-cancer barrier in early human tumorigenesis. Nature. 2005;434:864–70. - PubMed
    1. Collado M, Gil J, Efeyan A, Guerra C, Schuhmacher AJ, Barradas M. et al.Tumour biology: senescence in premalignant tumours.Nature.2005;436:642 10.1038/436642a. - PubMed
    1. Braig M, Lee S, Loddenkemper C, Rudolph C, Peters AH, Schlegelberger B, et al. Oncogene-induced senescence as an initial barrier in lymphoma development. Nature. 2005;436:660–5. - PubMed

MeSH terms

Substances

LinkOut - more resources