. 2024 Dec;19(12):3697-3720.
doi: 10.1038/s41596-024-01032-9. Epub 2024 Sep 5.

Mapping protein-DNA interactions with DiMeLo-seq

Affiliations

Mapping protein-DNA interactions with DiMeLo-seq

Annie Maslan et al. Nat Protoc. 2024 Dec.

Abstract

We recently developed directed methylation with long-read sequencing (DiMeLo-seq) to map protein-DNA interactions genome wide. DiMeLo-seq is capable of mapping multiple interaction sites on single DNA molecules, profiling protein binding in the context of endogenous DNA methylation, identifying haplotype-specific protein-DNA interactions and mapping protein-DNA interactions in repetitive regions of the genome that are difficult to study with short-read methods. With DiMeLo-seq, adenines in the vicinity of a protein of interest are methylated in situ by tethering the Hia5 methyltransferase to an antibody using protein A. Protein-DNA interactions are then detected by direct readout of adenine methylation with long-read, single-molecule DNA sequencing platforms such as Nanopore sequencing. Here we present a detailed protocol and practical guidance for performing DiMeLo-seq. This protocol can be run on nuclei from fresh, lightly fixed or frozen cells. The protocol requires 1-2 d for performing in situ targeted methylation, 1-5 d for library preparation depending on desired fragment length and 1-3 d for Nanopore sequencing depending on desired sequencing depth. The protocol requires basic molecular biology skills and equipment, as well as access to a Nanopore sequencer. We also provide a Python package, dimelo, for analysis of DiMeLo-seq data.


Conflict of interest statement

Competing interests: N.A., A.M., K.S., A.F.S. and A.S. are co-inventors on a patent application related to this work. The remaining authors declare no competing interests.

Figures

Fig. 1 ∣
Fig. 1 ∣. DiMeLo-seq protocol overview.
The step numbers in the procedure are indicated. (1) Permeabilize nuclei from fresh, frozen, or fixed cells (Steps 1–11). (2) Perform a series of steps within the permeabilized nuclei: (i) bind primary antibody to the protein of interest (Steps 12–15), (ii) bind pA-Hia5 to the primary antibody (Steps 16–33), (iii) add SAM, the methyl donor, to activate methylation (Steps 34–38). (3) Extract long molecules of DNA (Step 39). Optionally, enrich for genomic sequences of interest (Step 40). (4) Sequence this DNA with a Nanopore sequencer to detect m6A directly (Step 41). (5) Analyze modified basecalls from sequencing using the dimelo software package (Steps 42–43).
Fig. 2 ∣
Fig. 2 ∣. Experimental QC. a,b,
To determine successful permeabilization, cells are stained with Trypan blue before (a) and after (b) digitonin treatment. Successful permeabilization allows Trypan blue to enter the nuclei, while still maintaining high recovery of nuclei from cells. Overpermeabilization results in lower recovery of nuclei. Underpermeabilization does not allow Trypan blue to enter the nuclei. Scale bars, 100 μm. c,d, TapeStation traces of DNA size distribution after the DiMeLo-seq in situ protocol and DNA extraction. Representative traces from ligation-based library preparation are shown for the fragment size distribution after extraction and after library preparation, following protocols for N50 ~50 kb (Steps 39B and 41B) (c) and the size distribution after library preparation for the two ligation-based methods presented in this protocol (d). The blue curve results in N50 ~20 kb (Steps 39A and 41A), while the red curve results in N50 ~50 kb (Steps 39B and 41B). Larger fragment sizes can be achieved with other ultralong kits.
Fig. 3 ∣
Fig. 3 ∣. Analysis pipeline overview.
Basecalling and alignment are performed on the FAST5 output from the Nanopore sequencer. The resulting BAM that contains the modified base information is then input to the dimelo software package. A recommended workflow involves QC with qc_report, followed by visualization with plot_browser, plot_enrichment and plot_enrichment_profile. For custom analysis, parse_bam stores base modification calls in an intermediate format that makes it easier to manipulate for downstream analysis.
Fig. 4 ∣
Fig. 4 ∣. Sequencing QC.
The qc_report function takes in one or more BAM files and for each, outputs a QC report including the following 5 features. a, A histogram of read lengths with the median, mean, N50, and max value annotated. b, A histogram of mapping quality. c,d, Basecall quality scores are present in BAM outputs from Guppy but not from Megalodon. Histograms of average basecall qualities per read are shown in c and d. The scores can be reported over the entirety of each read (c, basecall quality) or the aligned portion of each read (d, alignment quality). Here, the mean indicates that our sample’s average basecall quality is Q10, which is equivalent to a 10%-per-base error rate. e, A summary table with descriptive statistics of each feature (a–d), in addition to highlighting important values such as mean length of reads, total number of reads, and total number of bases sequenced. Example data used in this figure are from targeting H3K9me3 in D. melanogaster embryos.
Fig. 5 ∣
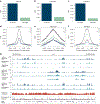
Fig. 5 ∣. Validation of targeted methylation in GM12878 cells.
a–c, Using BED files defining on- and off-target regions, the plot_enrichment function can be used to determine whether methylation is concentrated within expected regions. We have defined on-target regions using ChIP-seq peaks for the corresponding histone marks. We defined off-target regions when targeting H3K27ac as H3K27me3 ChIP-seq peaks (a) and when targeting H3K27me3 as H3K27ac ChIP-seq peaks (b); for off-target regions for H3K4me3 we use TSSs for unexpressed genes (c). A methylation probability threshold of 0.75 was used. Error bars represent 95% credible intervals determined for each ratio by sampling from posterior beta distributions computed with uninformative priors. d–f, Methylation profiles centered at ChIP-seq peaks for H3K27ac- (d), H3K27me3- (e) and H3K4me3-targeted (f) DiMeLo-seq are plotted using plot_enrichment_profile. The quartiles (quartile 4 (q4) to quartile 1 (q1)) indicate the strength of the ChIP-seq peaks which the DiMeLo-seq reads overlap. A methylation probability threshold of 0.75 was used. g, Aggregate browser traces comparing DiMeLo-seq signal to ChIP-seq and CUT&Tag. BED files used for creating aggregate curves are generated either from parse_bam or plot_browser. The CpG methylation signal is aggregated from the H3K27ac-, H3K27me3- and H3K4me3-targeted DiMeLo-seq experiments. A methylation probability threshold of 0.8 was used. ATAC-seq and NCBI RefSeq annotations are also shown.
Fig. 6 ∣
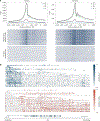
Fig. 6 ∣. Evaluating protein binding at regions of interest.
Both H3K27ac and H3K4me3 are found at TSSs. a, The signal from H3K27ac- and H3K4me3-targeted DiMeLo-seq at TSS. Reads overlapping TSS, gated by gene expression level from highest gene expression (q4) to lowest gene expression (q1). Aggregate mA/A profiles are shown for all reads spanning these TSSs. Single molecules are shown below with blue representing mA calls for TSS for the highest gene expression (q4) and for no gene expression (q1). Aggregate and single-molecule plots were produced with plot_enrichment_profile. A methylation probability threshold of 0.75 was used. b, Single-molecule browser plots produced from plot_browser from H3K4me3-targeted DiMeLo-seq experiment. Using a methylation probability threshold of 0.6, mA (top, blue) and mCpG (bottom, red) calls are shown for the same molecules (gray lines). NCBI RefSeq genes are shown below.
Fig. 7 ∣
Fig. 7 ∣. H3K9me3-targeted DiMeLo-seq in D. melanogaster embryos.
Aggregate mA/A across the entire D. melanogaster genome from a DiMeLo-seq experiment targeting H3K9me3 is shown in dark blue. H3K9me3 ChIP-seq data in D. melanogaster embryos is shown in light blue. Coverage from the DiMeLo-seq experiment is shown in gray. A region on chr3L where a transition from H3K9me3 depletion to H3K9me3 enrichment is highlighted with a single-molecule browser plot generated from plot_browser. Gray lines indicate reads and blue dots indicate mA calls with intensity colored by probability of methylation. An alignment length filter of 10 kb was applied. A methylation probability threshold of 0.6 was used.

References

    1. Altemose, N. et al. Nat. Methods 19, 711–723 (2022): 10.1038/s41592-022-01475-6 - DOI - PMC - PubMed
    1. Mikkelsen TS et al. Genome-wide maps of chromatin state in pluripotent and lineage-committed cells. Nature 448, 553–560 (2007). - PMC - PubMed
    1. Robertson G. et al. Genome-wide profiles of STAT1 DNA association using chromatin immunoprecipitation and massively parallel sequencing. Nat. Methods 4, 651–657 (2007). - PubMed
    1. Johnson DS, Mortazavi A, Myers RM & Wold B Genome-wide mapping of in vivo protein–DNA interactions. Science 316, 1497–1502 (2007). - PubMed
    1. Barski A. et al. High-resolution profiling of histone methylations in the human genome. Cell 129, 823–837 (2007). - PubMed

Publication types