. 2024 Sep 6;23(1):186.
doi: 10.1186/s12943-024-02097-6.

YTHDF2 in peritumoral hepatocytes mediates chemotherapy-induced antitumor immune responses through CX3CL1-mediated CD8+ T cell recruitment

Affiliations

YTHDF2 in peritumoral hepatocytes mediates chemotherapy-induced antitumor immune responses through CX3CL1-mediated CD8+ T cell recruitment

Zhenyun Yang et al. Mol Cancer. .

Erratum in

Abstract

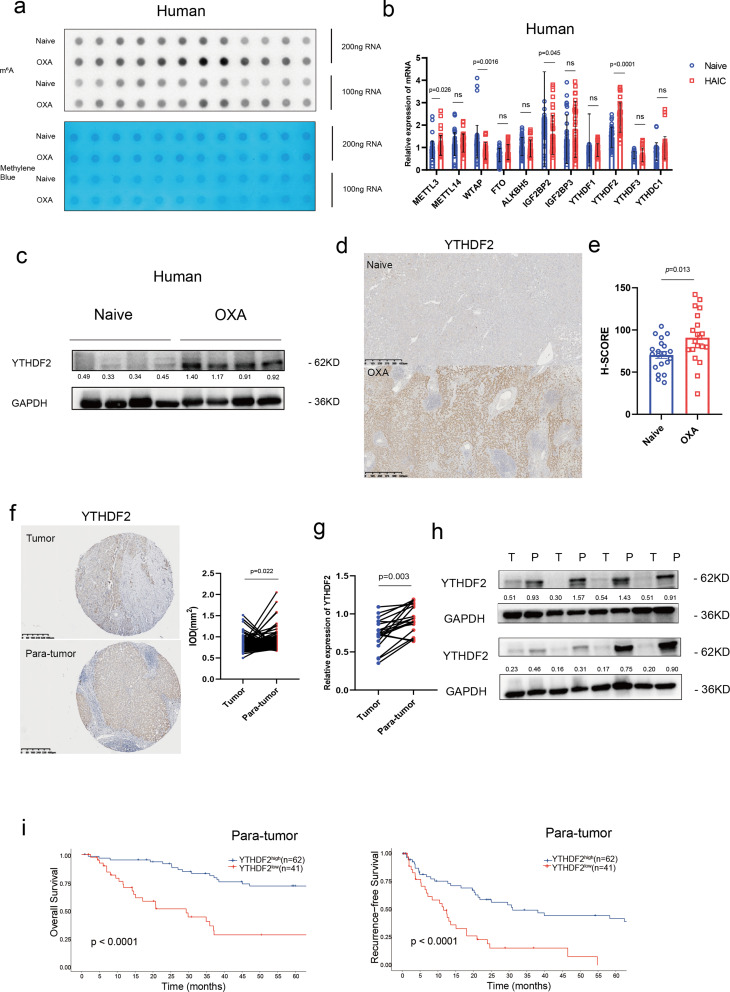
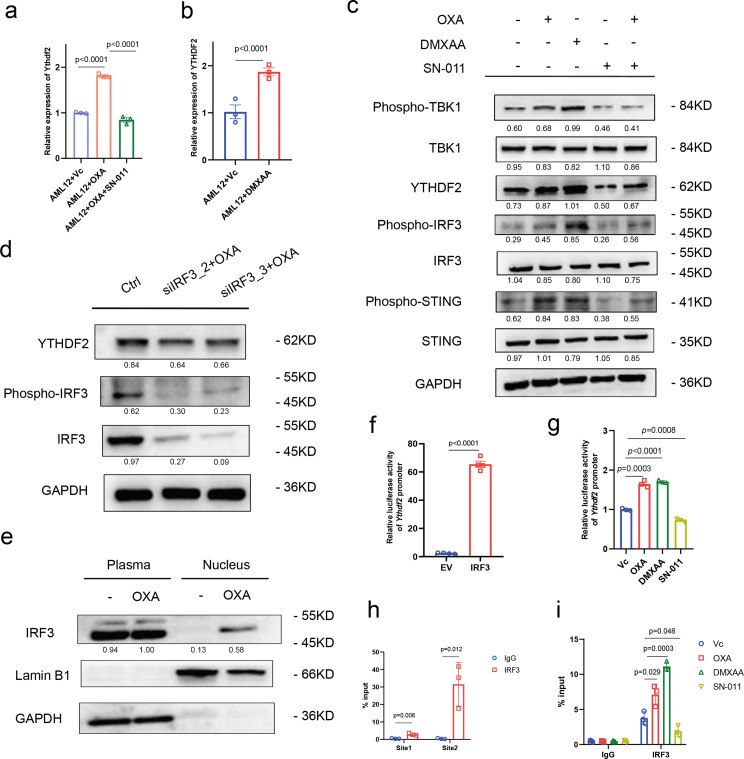
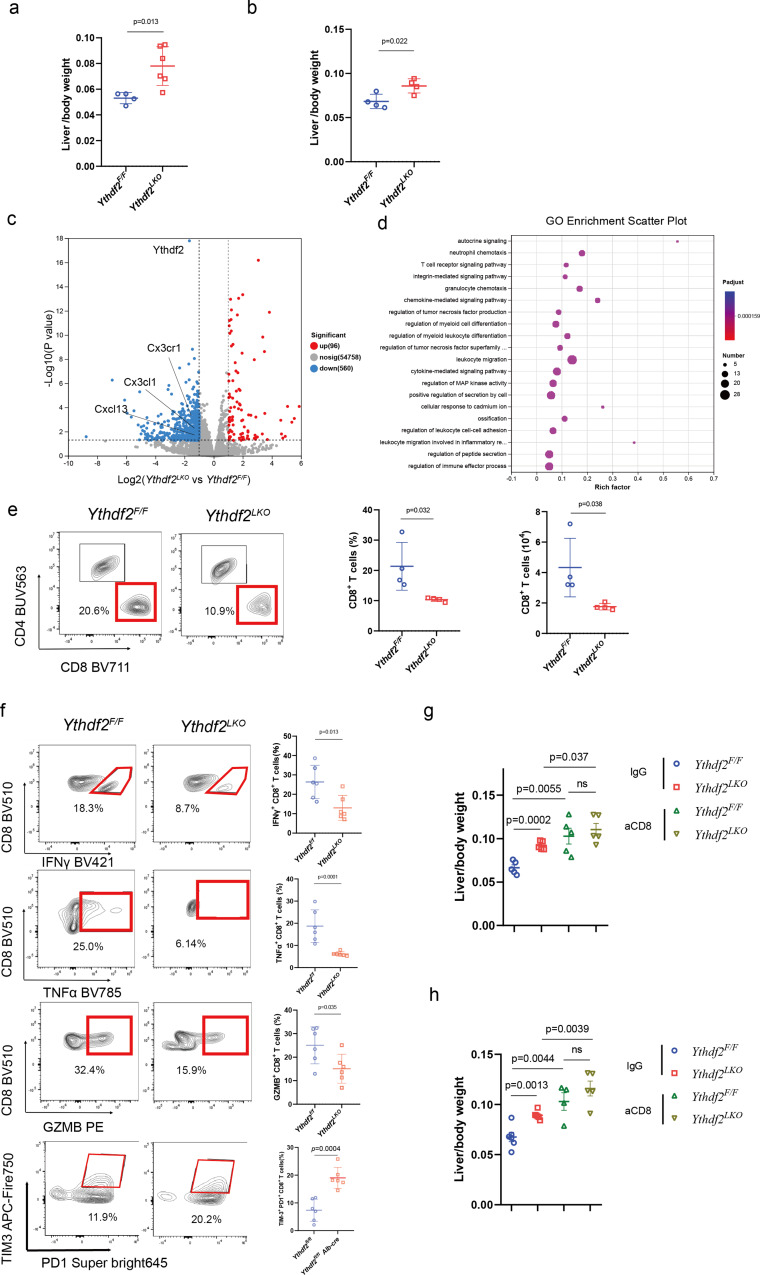
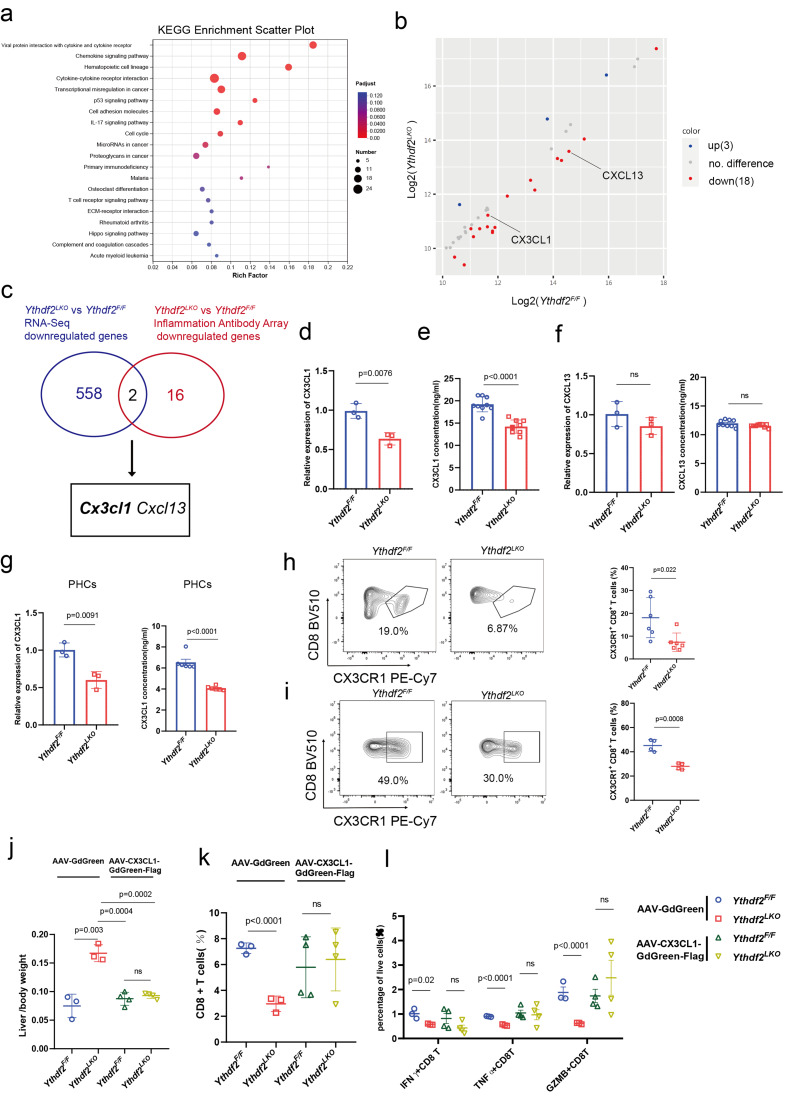
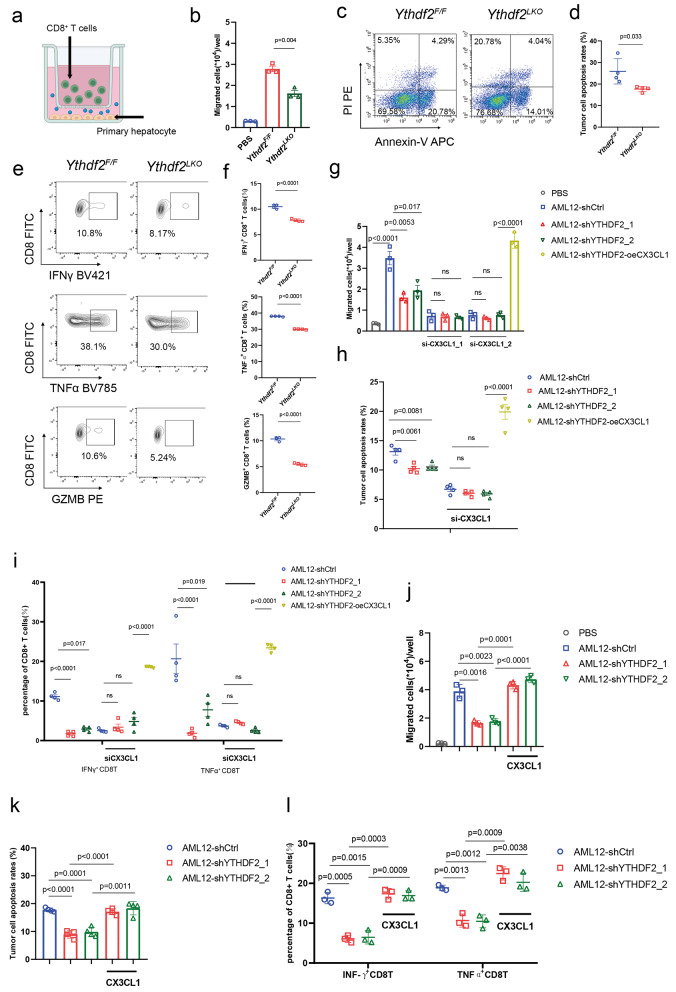
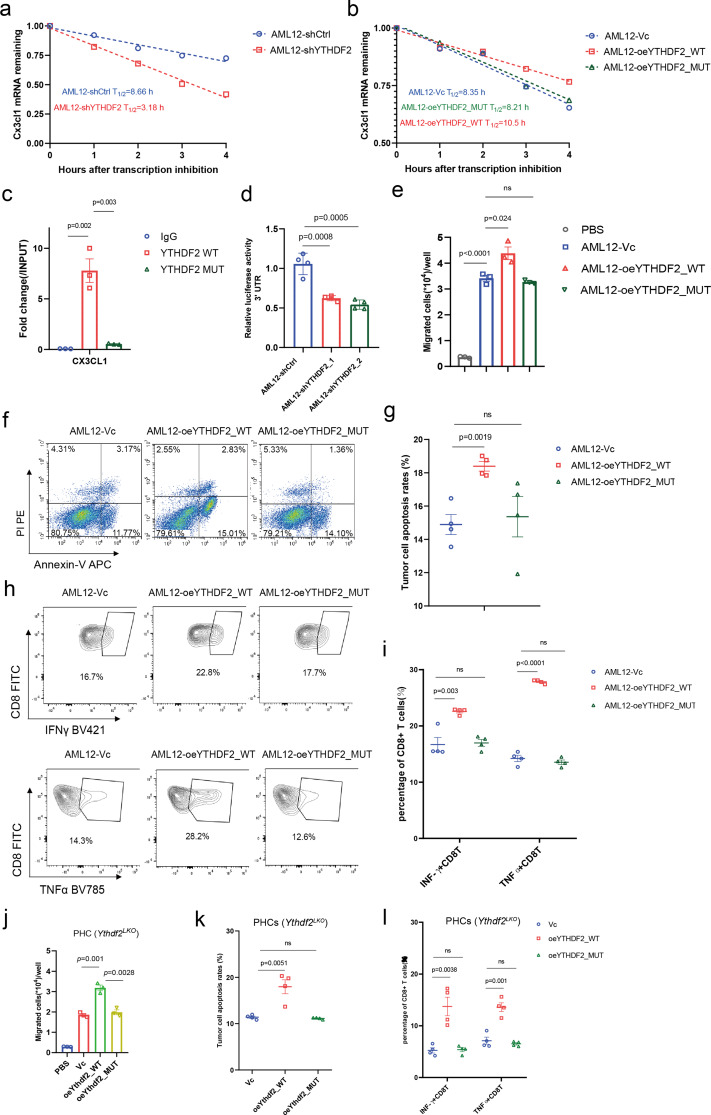
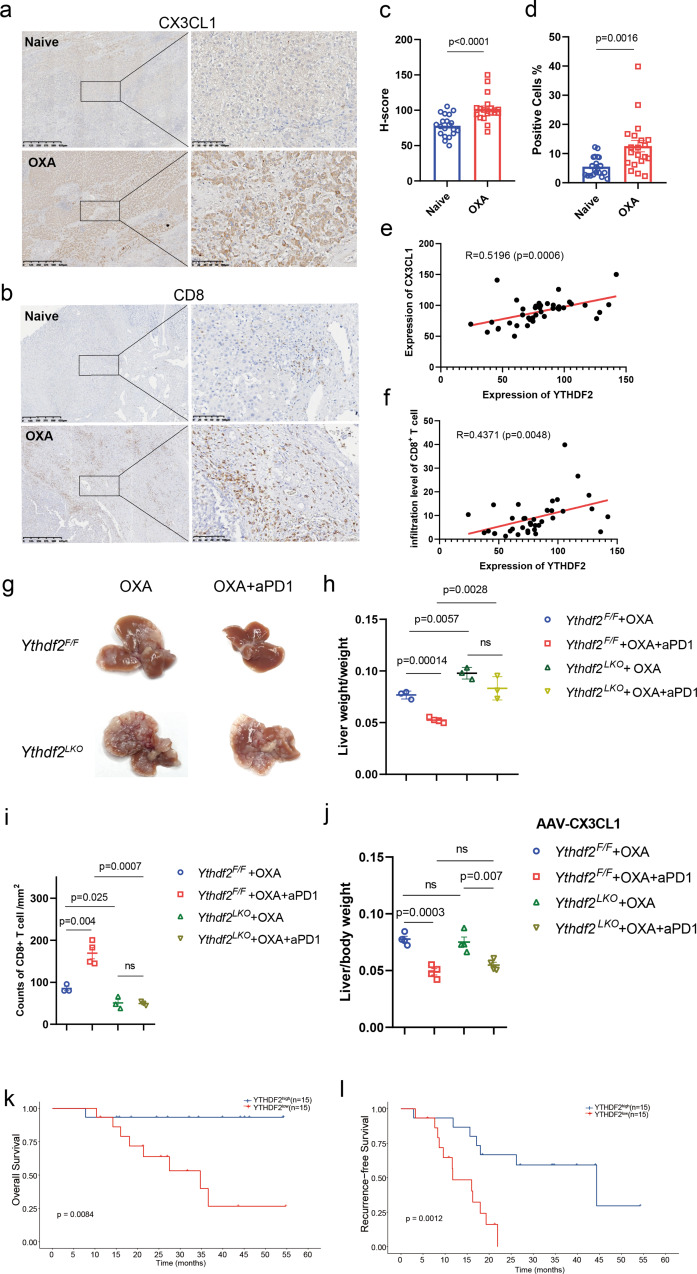
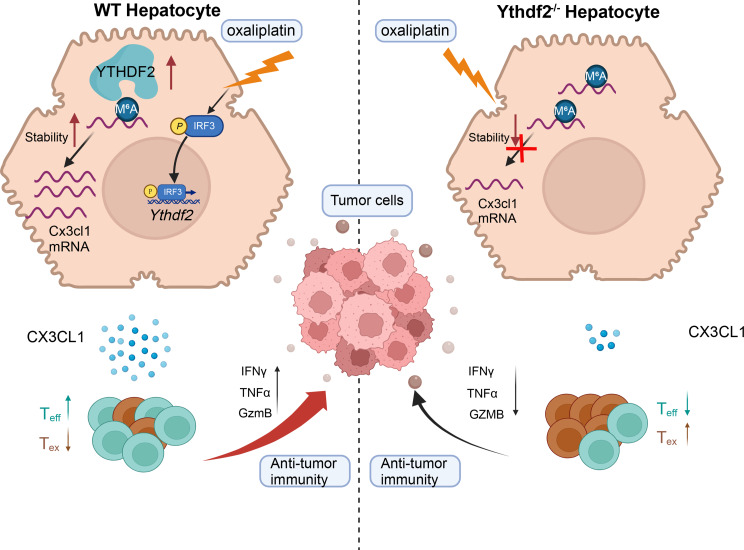
Peritumoral hepatocytes are critical components of the liver cancer microenvironment, However, the role of peritumoral hepatocytes in the local tumor immune interface and the underlying molecular mechanisms have not been elucidated. YTHDF2, an RNA N6-methyladenosine (m6A) reader, is critical for liver tumor progression. The function and regulatory roles of YTHDF2 in peritumoral hepatocytes are unknown. This study demonstrated that oxaliplatin (OXA) upregulated m6A modification and YTHDF2 expression in hepatocytes. Studies using tumor-bearing liver-specific Ythdf2 knockout mice revealed that hepatocyte YTHDF2 suppresses liver tumor growth through CD8+ T cell recruitment and activation. Additionally, YTHDF2 mediated the response to immunotherapy. Mechanistically, OXA upregulated YTHDF2 expression by activating the cGAS-STING signaling pathway and consequently enhanced the therapeutic outcomes of immunotherapeutic interventions. Ythdf2 stabilized Cx3cl1 transcripts in an m6A-dependent manner, regulating the interplay between CD8+ T cells and the progression of liver malignancies. Thus, this study elucidated the novel role of hepatocyte YTHDF2, which promotes therapy-induced antitumor immune responses in the liver. The findings of this study provide valuable insights into the mechanism underlying the therapeutic benefits of targeting YTHDF2.


Conflict of interest statement

The authors declare no competing interests.

Figures

Fig. 1
Fig. 1
OXA upregulates YTHDF2 in peritumoral hepatocytes and YTHDF2 upregulation is associated with improved survival outcomes. a, The m6A level of peritumoral tissues from treatment naive HCC patients and HCC patients treated with hepatic arterial infusion chemotherapy (HAIC) with oxaliplatin (OXA) was indicated by m6A dot blot. Corresponding RNAs were loaded equally by a 2-fold serial dilution with 200 ng and 100 ng. Methylene blue staining served as a loading control (n = 6). b, Relative mRNA levels of genes associated with m6A in treatment naive HCC patients and HCC patients treated with OXA, as assessed by RT-qPCR (n = 16, performed in triplicate). c, Immunoblot of YTHDF2 in peritumoral tissues from treatment naive HCC patients and HCC patients treated with HAIC (n = 4). d, Immunohistological staining of YTHDF2 in peritumoral tissues from treatment naive HCC patients and HCC patients treated with HAIC. e, Histochemistry score (H-SCORE) value of YTHDF2 in peritumoral tissues from treatment naive HCC patients and HCC patients treated with HAIC (n = 20). f, Immunohistological staining of YTHDF2 in human HCC tissue microarrays, and IOD value of YTHDF2 in paired tumor and peritumoral tissues of treatment-naïve patients (n = 103).g, RT-qPCR of YTHDF2 in paired tumor (T) and peritumoral (P) tissues of treatment-naïve patients (n = 20) h, Immunoblot of YTHDF2 in paired tumor (T) and peritumoral (P) tissues (n = 8). i, Kaplan-Meier analyses of the correlation between YTHDF2 expression level in pare-tumor tissues and overall survival (left) or recurrence-free survival (right) in treatment-naive HCC patients (n = 103 in total). Error bars indicate means ± SD. P-values were determined by an unpaired two-tailed t-test (b, e). P-values were determined by a paired two-tailed t-test (g). P-values were calculated using the log-rank test (i). Data in a-h are representative of at least two independent experiments. ns, not significant
Fig. 2
Fig. 2
OXA activates Ythdf2 transcription in hepatocytes through cGAS-STING signaling. a, b,c, qRT-PCR (a, b) and immunoblotting (c) showing the expression of YTHDF2 in AML12 cells treated with vehicle, OXA, SN-011 (cGAS-STING inhibitor) and DMXAA (cGAS-STING agonist) (n = 3). d, immunoblotting showing the expression of YTHDF2 in AML12-siCtrl, AML12-siIRF3_2 and AML12-siIRF3_3 cells treated with OXA. e, immunoblotting showing expression of IRF3 in plasma and nucleus of AML12 treated with OXA. f, Relative luciferase activity of constructs containing Ythdf2 promoter in AML12 cells transfected with IRF3 expressing plasmid or empty vector (n = 4). g, Relative luciferase activity of constructs containing Ythdf2 promoter in AML12 cells treated with vehicle, OXA, SN-011 and DMXAA (n = 3). h, ChIP-qPCR showing the binding of IRF3 to the Ythdf2 promoter in AML12-oeIRF3 cells (n = 3). i, ChIP-qPCR showing the enrichment of the Ythdf2 promoter in AML12 cells treated with vehicle, OXA, SN-011 and DMXAA (n = 3). Error bars indicate means ± SD. P-values were determined by an unpaired two-tailed t-test (a, b,f-i). Data in a-i are representative of at least two independent experiments
Fig. 3
Fig. 3
YTHDF2 deficient hepatocytes promote liver tumor growth under OXA stress conditions by impairing CD8+ T cell antitumor response. a,b, liver/ body weight from Ythdf2F/F and Ythdf2LKO mice after OXA pre-treatment and Hepa1-6 orthotopic injection (a) or MC38 intrasplenic injection (b)(n = 4–6). c, Volcano plots showing up (red) - or down (blue) -regulated genes in peritumoral tissues from Ythdf2F/F versus Ythdf2LKO mice after Hepa1-6 orthotopic injection, as assessed by RNA-seq (n = 3). d, GO analysis based on the RNA-seq in (c), showing the most significant enriched pathways and the P-values. e, Representative plots, percentages and absolute numbers of CD8+ T cells from Ythdf2F/Fand Ythdf2LKO mice on day 7 after Hepa1-6 orthotopic injection (n = 4). f, Representative plots and percentages of IFNγ+,TNFα+ ,GzmB+ and TIM3+PD1+ CD8+ T cells from Ythdf2F/F and Ythdf2LKO mice on day 7 after Hepa1-6 orthotopic injection (n = 6). g,h, liver/body weight from Ythdf2F/F and Ythdf2LKO mice treated with IgG/CD8 antibody after Hepa1-6 orthotopic injection (g) or MC38 intrasplenic injection (h) (n = 4–6). Error bars indicate means ± SD. P-values were determined by an unpaired two-tailed t-test (a, b,e-h). Data in a-h are representative of at least two independent experiments
Fig. 4
Fig. 4
YTHDF2 maintains CD8+ T cell-mediated antitumor response through CX3CL1 in hepatocytes. a, KEGG analysis based on the RNA-seq in peritumoral tissues from Ythdf2F/F versus Ythdf2LKO mice after Hepa1-6 orthotopic injection, showing the most significant enriched pathways and the P-values. b, Volcano plots showing up (red) - or down (blue) -regulated genes in serum from Ythdf2F/F versus Ythdf2LKO mice after Hepa1-6 orthotopic injection, as assessed by inflammation antibody array (n = 3). c, Screening strategy showing a group of genes that were concomitant in RNA-seq and inflammation antibody array. d, qRT-PCR analysis of the relative mRNA levels of CX3CL1 in peritumoral hepatocytes from Ythdf2F/F and Ythdf2LKO (n = 3). e, ELISA analysis of the quantitative protein levels of CX3CL1 in the serum from Ythdf2F/F and Ythdf2LKO mice (n = 9). f, qRT-PCR analysis (left) of the relative mRNA levels of CXCL13 in peritumoral hepatocytes from Ythdf2F/F and Ythdf2LKO (n = 3) and ELISA analysis (right) of the quantitative protein levels of CXCL13 in the serum from Ythdf2F/F and Ythdf2LKO mice (n = 9). g, qRT-PCR analysis (left, n = 3) and ELISA analysis (right, n = 6) of CX3CL1 in the PHCs from Ythdf2F/F and Ythdf2LKO mice. h, i Representative plots, percentages of CX3CR1+ CD8+ T cells from Ythdf2F/Fand Ythdf2LKO mice on day 7 after Hepa1-6 orthotopic injection (h, n = 6) and MC38 introsplenic injection (i, n = 4). j-l liver/body weight (j), percentages of CD8+ T cells (k), IFNγ+, TNFα+ and GzmB+ CD8+ T cells (l), from Ythdf2F/F and Ythdf2LKO mice treated with AAV-GdGreen or AAV-CX3CL1-GdGreen-Flag after MC38 intrasplenic injection (n = 3–4). Error bars indicate means ± SD. P-values were determined by an unpaired two-tailed t-test (d-l). Data in d-l are representative of at least two independent experiments. ns, not significant
Fig. 5
Fig. 5
YTHDF2-CX3CL1 axis in hepatocytes enhances CD8+ T cells antitumor response in vitro. a, Illustration of transwell co-culture system for CD8+ T cells and primary hepatocytes. b, Chemoattractant effect of primary hepatocytes from Ythdf2F/F and Ythdf2LKO mice to CD8 + T cells (n = 3). c, d, Representative plots (c) and apoptosis rate of Hepa1-6 (d) co-culture with CD8+ T cells from C57BL/6 mice spleen after co-culture with primary hepatocytes from Ythdf2F/F and Ythdf2LKO mice (n = 4) (d). e, f, Representative plots (e) and percentage of IFNγ+ ,TNFα+ and GzmB+ CD8+ T cells (f) from C57BL/6 mice spleen after co-culture with primary hepatocytes from Ythdf2F/F and Ythdf2LKO mice (n = 4). g, Chemoattractant effect of AML12-Ctrl, AML12-shYTHDF2_1, AML12-shYTHDF2_2, AML12-shYTHDF2-oeCX3CL1, AML12-shCtrl-siCX3CL1, AML12-shYTHDF2_1-siCX3CL1 and AML12-shYTHDF2_2-siCX3CL1 cells to CD8 + T cells (n = 3). h, Apoptosis rate of Hepa1-6 after co-cultured with CD8+ T cells from C57BL/6 mice spleen, which had been co-cultured with AML12-Ctrl, AML12-shYTHDF2_1, AML12-shYTHDF2_2, AML12-shYTHDF2-oeCX3CL1, AML12-shCtrl-siCX3CL1, AML12-shYTHDF2_1-siCX3CL1 and AML12-shYTHDF2_2-siCX3CL1 cells for 24 h (n = 4). i, Percentage of IFNγ+ (j), TNFα+ (k) CD8+ T cells from C57BL/6 mice splenic CD8+ T cells which had been co-cultured with AML12-Ctrl, AML12-shYTHDF2_1, AML12-shYTHDF2_2, AML12-shYTHDF2-oeCX3CL1, AML12-shCtrl-siCX3CL1, AML12-shYTHDF2_1-siCX3CL1 and AML12-shYTHDF2_2-siCX3CL1 cells for 24 h (n = 4). j, Chemoattractant effect to CD8 + T cells of AML12-Ctrl, AML12-shYTHDF2_1, AML12-shYTHDF2_2 as well as AML12-shYTHDF2_1, AML12-shYTHDF2_2 which supplemented CX3CL1 (n = 3). k, Apoptosis rate of Hepa1-6 after co-cultured with CD8+ T cells from C57BL/6 mice spleen, which had been co-cultured with AML12-Ctrl, AML12-shYTHDF2_1, AML12-shYTHDF2_2 as well as AML12-shYTHDF2_1, AML12-shYTHDF2_2 which supplemented CX3CL1 for 24 h (n = 4). l, Percentage of IFNγ+, TNFα+ CD8+ T cells from C57BL/6 mice splenic CD8+ T cells which had been co-cultured with AML12-Ctrl, AML12-shYTHDF2_1, AML12-shYTHDF2_2 as well as AML12-shYTHDF2_1, AML12-shYTHDF2_2 which supplemented CX3CL1 for 24 h (n = 3). Error bars indicate means ± SD. P-values were determined by an unpaired two-tailed t-test (b, d,f, g-l). Data in b-l are representative of at least two independent experiments. ns, not significant
Fig. 6
Fig. 6
Hepatocyte YTHDF2 suppresses liver tumor growth by enhancing Cx3cl1 mRNA stability in an m6A-dependent manner. a, b, Lifetime of CX3CL1 mRNA in AML12-shCtrl and AML12-shYTHDF2 cells (a), AML12-vc, AML12-oeYTHDF2_WT and AML12-oeYTHDF2_MUT cells (b). Transcription was inhibited by actinomycin D (5 µg/mL) (n = 3). c, RIP-qPCR showed the interaction of CX3CL1 transcripts with YTHDF2 in AML12-Vc, AML12-oeYTHDF2_WT and AML12-oeYTHDF2_MUT cells (n = 3). d, Relative luciferase activity of constructs containing 3’UTR of CX3CL1 in AML12-Ctrl, AML12-shYTHDF2_1 and AML12-shYTHDF2_2 cells (n = 4). e, Chemoattractant effect of AML12-vc, AML12-oeYTHDF2_WT and AML12-oeYTHDF2_MUT cells to CD8+ T cells (n = 3). f, g, Representative plots (f) and apoptosis rate of Hepa1-6 (g) co-culture with CD8+ T cells from C57BL/6 mice spleen after co-culture with AML12-vc, AML12-oeYTHDF2_WT and AML12-oeYTHDF2_MUT cells (n = 4). h, i, Representative plots (h) and percentage of IFNγ+ ,TNFα+ CD8+ T cells (i) from C57BL/6 mice spleen after co-culture with AML12-vc, AML12-oeYTHDF2_WT and AML12-oeYTHDF2_MUT cells (n = 4). j, Chemoattractant effect of Vc, oeYTHDF2_WT and oeYTHDF2_MUT of PHCs from Ythdf2LKO mice to CD8+ T cells (n = 3). k, Apoptosis rate of Hepa1-6 co-culture with CD8+ T cells from C57BL/6 mice spleen after co-culture with Vc, oeYTHDF2_WT and oeYTHDF2_MUT of PHCs from Ythdf2LKO mice (n = 4). l, Percentage of IFNγ+ ,TNFα+ CD8+ T cells from C57BL/6 mice spleen after co-culture with Vc, oeYTHDF2_WT and oeYTHDF2_MUT of PHCs from Ythdf2LKO mice (n = 4).Error bars indicate means ± SD. P-values were determined by an unpaired two-tailed t-test (c-e, g,i-l). Data in a-l are representative of at least two independent experiments. ns, not significant
Fig. 7
Fig. 7
YTHDF2-CX3CL1 axis in hepatocytes enhances the antitumor efficacy of immunotherapy. a-d, Immunohistological staining (a, b), H-SCORE value (c) and percentage of positive cells (d) of CX3CL1 and CD8 in peritumoral tissues from treatment naive HCC patients and HCC patients treated with HAIC (n = 20). e, f, Scatter plots showing the correlation between YTHDF2 expression and CX3CL1 expression (e) or infiltration CD8+ T cells level (f). The linear best fit line, Pearson correlation coefficient (R) and P-value are shown (n = 20). g, h, Gross appearances of liver samples with tumors (g), liver/ body weight (h), from Ythdf2F/F and Ythdf2LKO mice after MC38 intrasplenic injection treated with OXA and aPD1 (n = 3–4). i, Counts of CD8+ T cells in tumors from Ythdf2F/F and Ythdf2LKO mice after MC38 intrasplenic injection treated with OXA and aPD1(n = 3–4). j, Liver/ body weight from Ythdf2F/F and Ythdf2LKO mice which received MC38 intrasplenic injection and treated with OXA and aPD1 after overexpression of CX3CL1 (n = 4). k, l, Kaplan-Meier analyses of the correlation between YTHDF2 expression level in pare-tumor tissues and overall survival (k) or recurrence-free survival (l) in patients treated with HAIC combined with aPD1 (n = 30 in total). Error bars indicate means ± SD. P-values were determined by an unpaired two-tailed t-test (c, d,h-j) or Spearman correlation (e, f). P-values were calculated using the log-rank test (k, l). Data in a-l are representative of at least two independent experiments. ns, not significant
Fig. 8
Fig. 8
Schematic depiction of the mechanism underlying how YTHDF2 in peritumoral hepatocytes impedes liver malignances progression and enhances immunotherapy efficacy

References

    1. Forner A, Reig M, Bruix J. Hepatocellular carcinoma. Lancet. 2018;391(10127):1301–14. - PubMed
    1. Zhou H, Liu Z, Wang Y, Wen X, Amador EH, Yuan L, et al. Colorectal liver metastasis: molecular mechanism and interventional therapy. Signal Transduct Target Ther. 2022;7(1):70. - PMC - PubMed
    1. Li X, Ramadori P, Pfister D, Seehawer M, Zender L, Heikenwalder M. The immunological and metabolic landscape in primary and metastatic liver cancer. Nat Rev Cancer. 2021;21(9):541–57. - PubMed
    1. Hou J, Zhang H, Sun B, Karin M. The immunobiology of hepatocellular carcinoma in humans and mice: basic concepts and therapeutic implications. J Hepatol. 2020;72(1):167–82. - PubMed
    1. Gu Y, Wu X, Zhang J, Fang Y, Pan Y, Shu Y, et al. The evolving landscape of N(6)-methyladenosine modification in the tumor microenvironment. Mol Ther. 2021;29(5):1703–15. - PMC - PubMed

MeSH terms