. 2024 Sep 5;19(1):64.
doi: 10.1186/s13024-024-00752-6.

Regional desynchronization of microglial activity is associated with cognitive decline in Alzheimer's disease

Affiliations

Regional desynchronization of microglial activity is associated with cognitive decline in Alzheimer's disease

Artem Zatcepin et al. Mol Neurodegener. .

Abstract

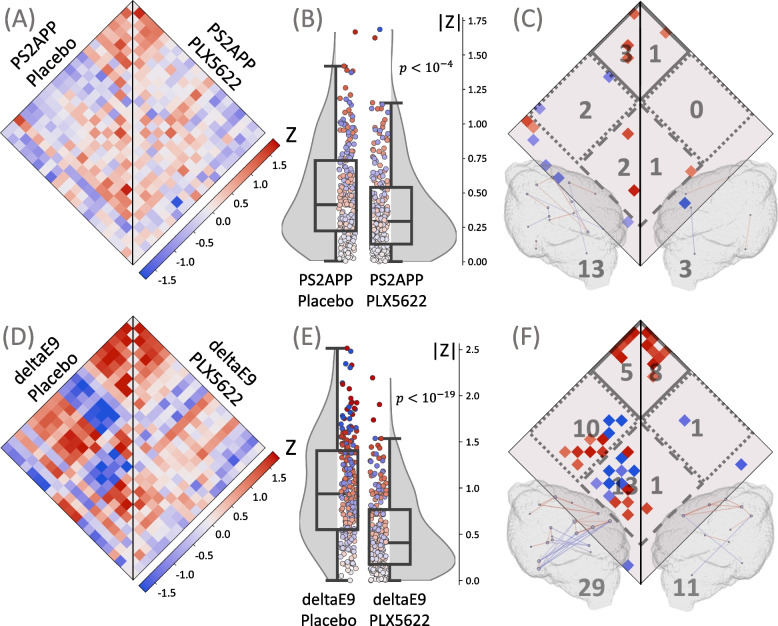
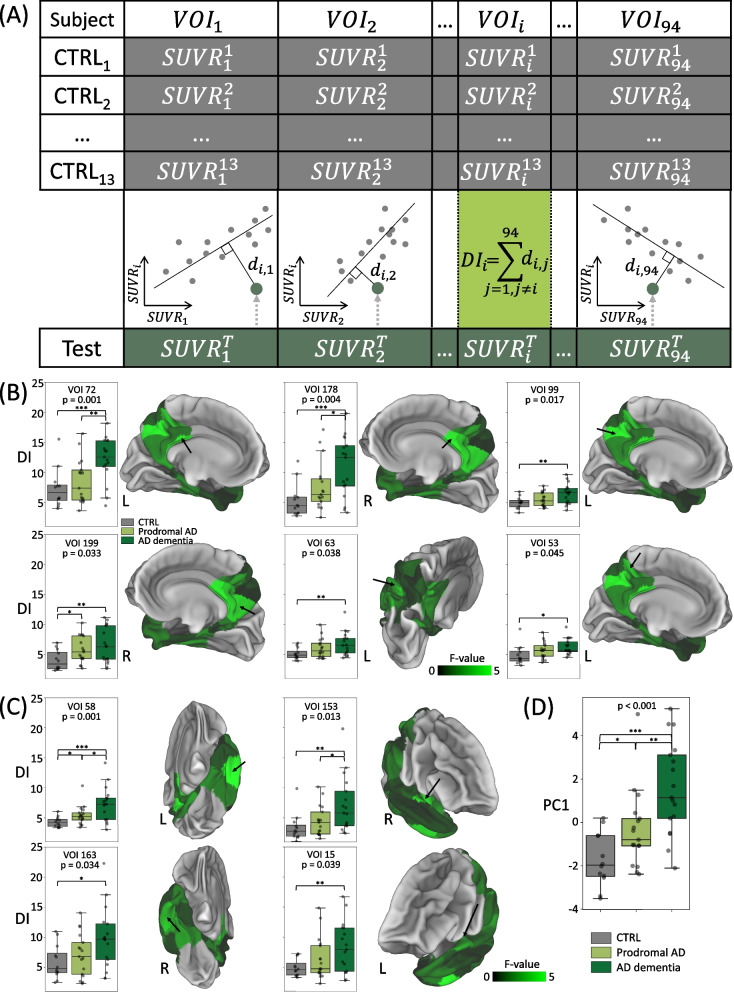
Background: Microglial activation is one hallmark of Alzheimer disease (AD) neuropathology but the impact of the regional interplay of microglia cells in the brain is poorly understood. We hypothesized that microglial activation is regionally synchronized in the healthy brain but experiences regional desynchronization with ongoing neurodegenerative disease. We addressed the existence of a microglia connectome and investigated microglial desynchronization as an AD biomarker.

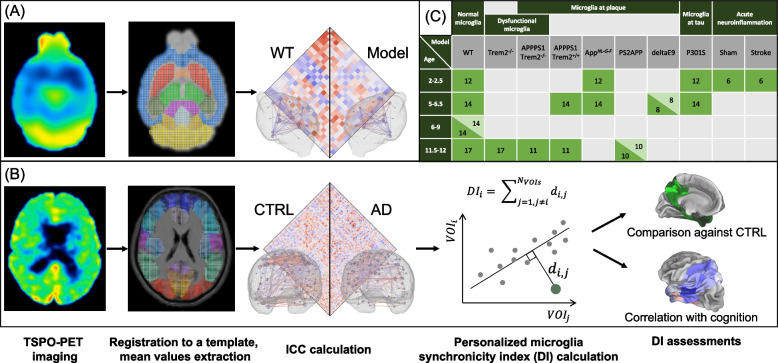
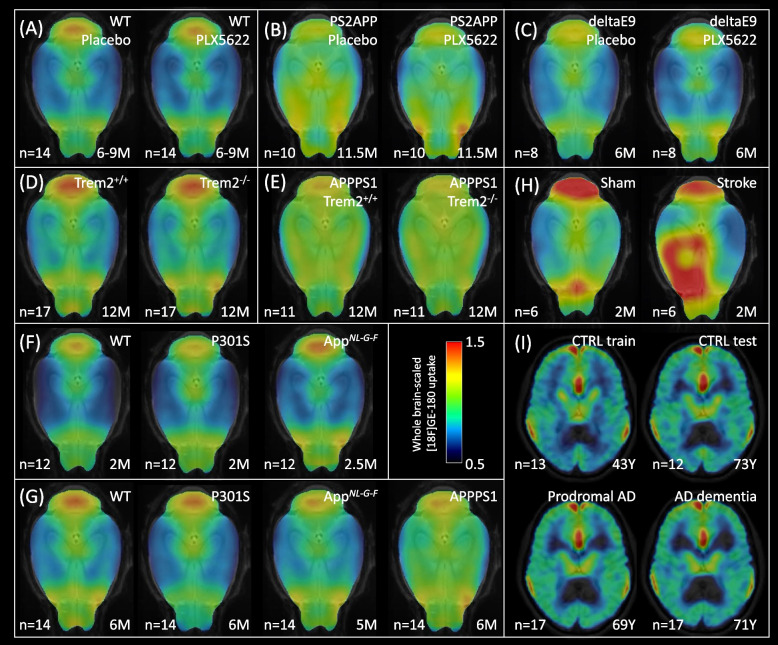
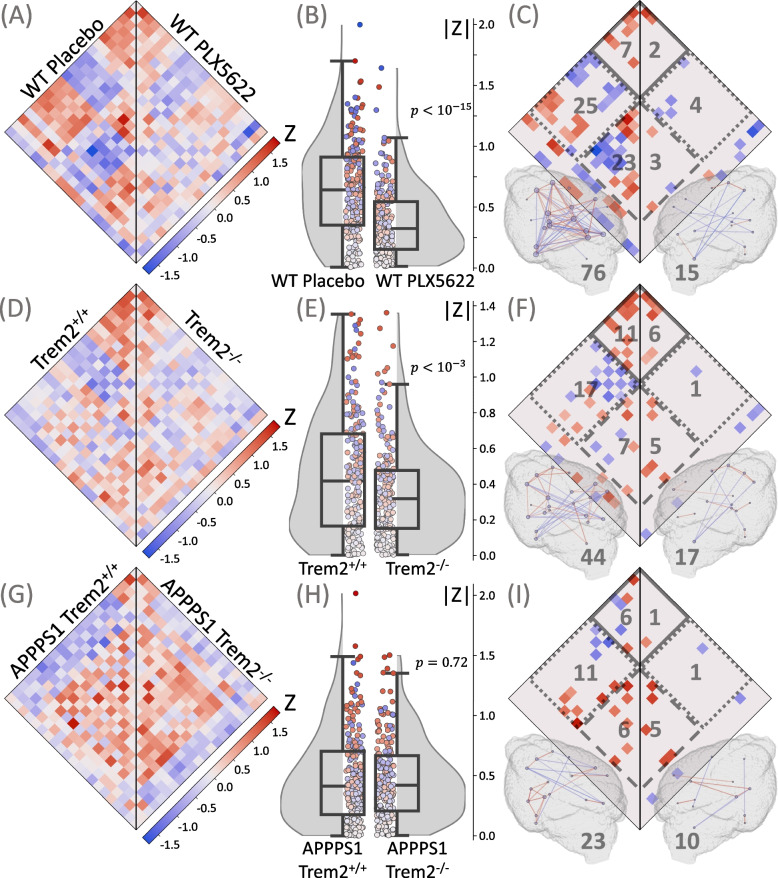
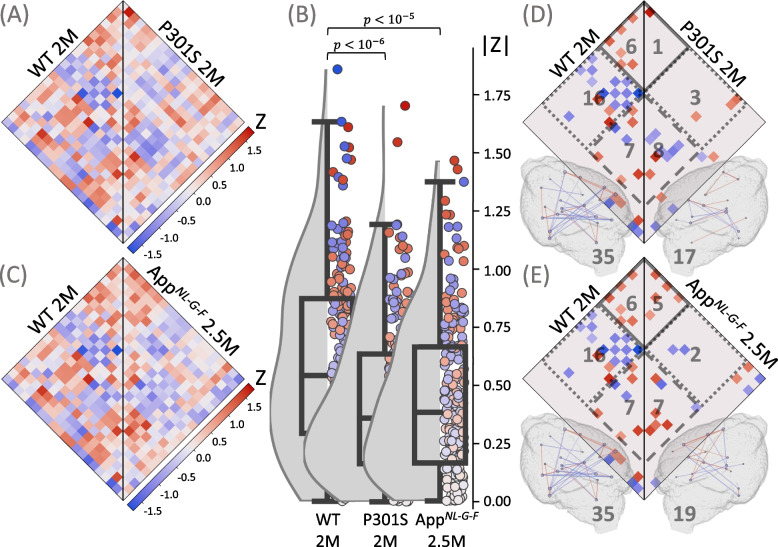
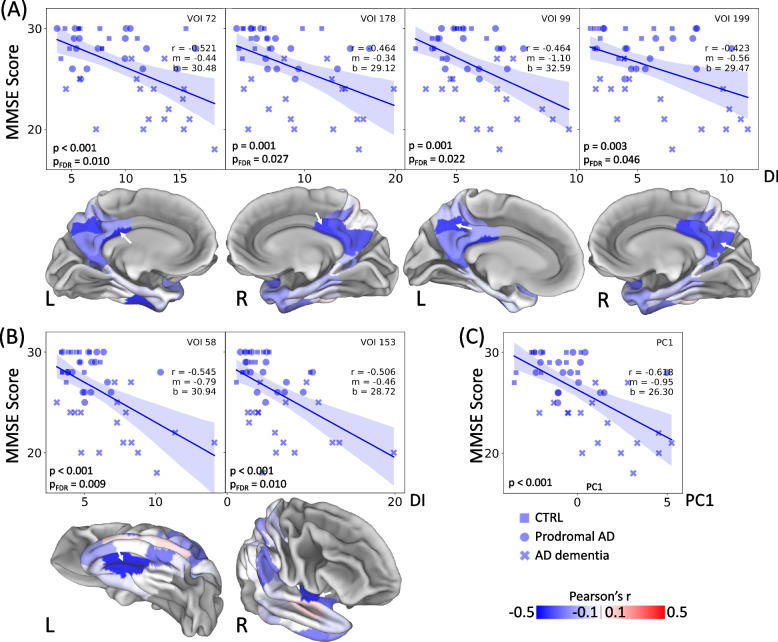
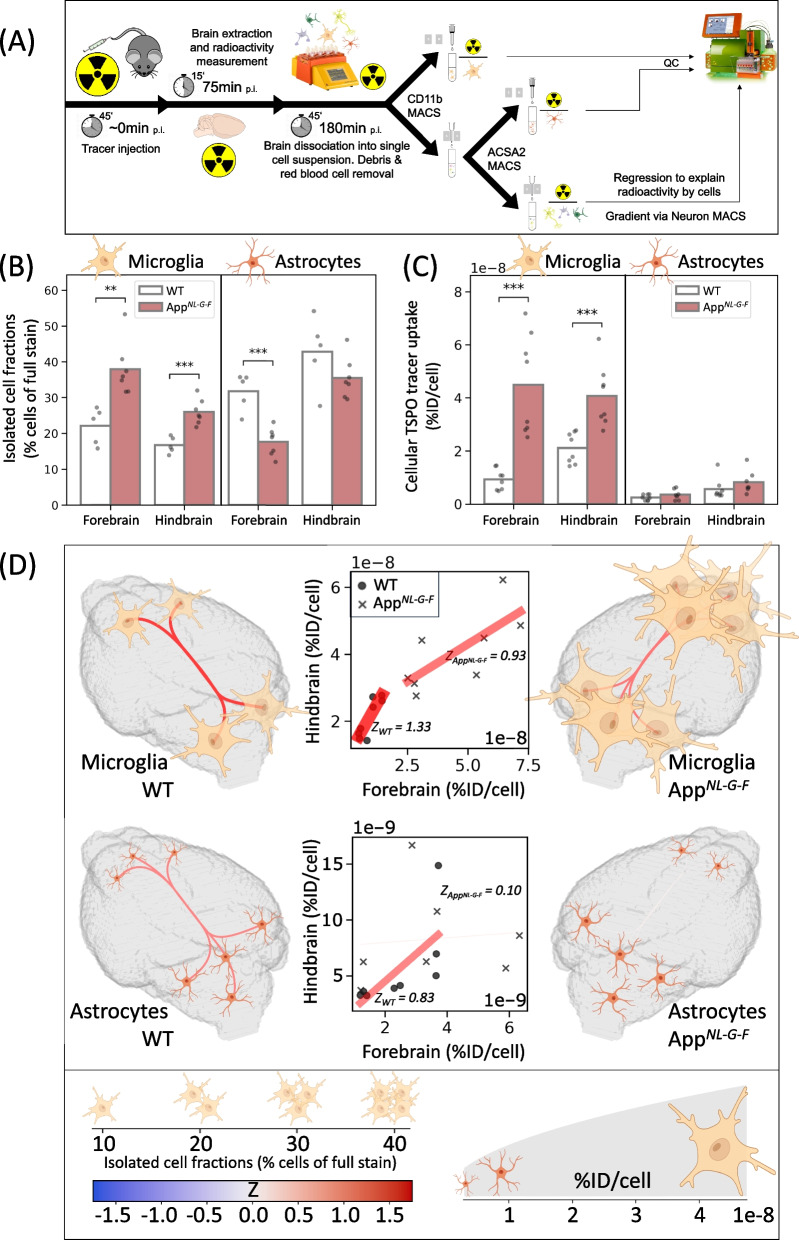
Methods: To validate the concept, we performed microglia depletion in mice to test whether interregional correlation coefficients (ICCs) of 18 kDa translocator protein (TSPO)-PET change when microglia are cleared. Next, we evaluated the influence of dysfunctional microglia and AD pathophysiology on TSPO-PET ICCs in the mouse brain, followed by translation to a human AD-continuum dataset. We correlated a personalized microglia desynchronization index with cognitive performance. Finally, we performed single-cell radiotracing (scRadiotracing) in mice to ensure the microglial source of the measured desynchronization.

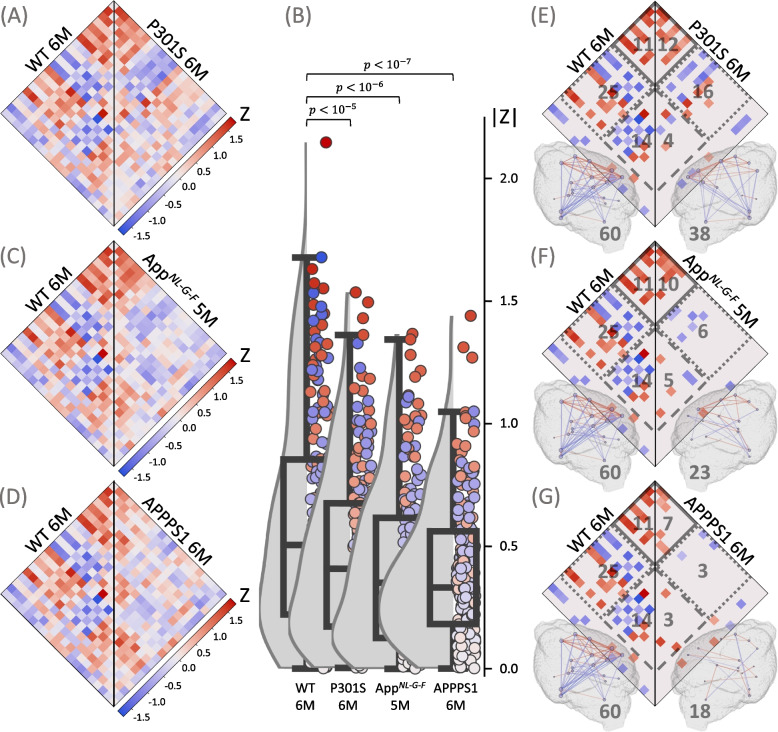
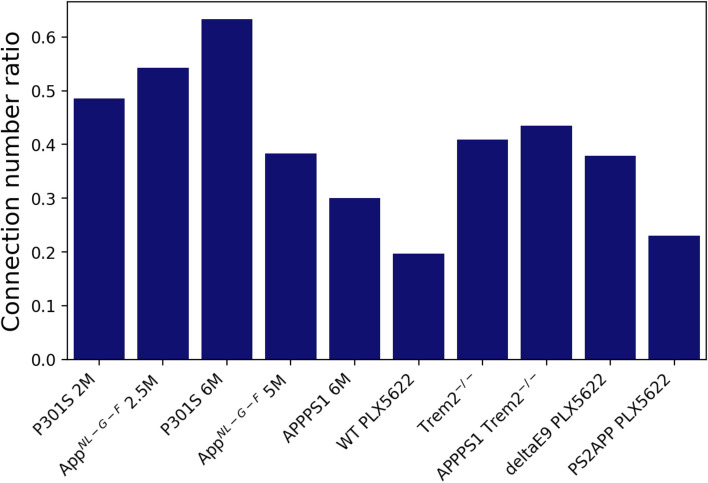
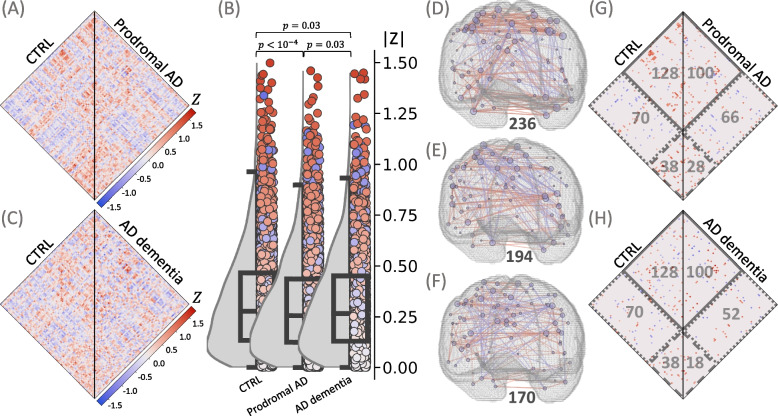
Results: Microglia-depleted mice showed a strong ICC reduction in all brain compartments, indicating microglia-specific desynchronization. AD mouse models demonstrated significant reductions of microglial synchronicity, associated with increasing variability of cellular radiotracer uptake in pathologically altered brain regions. Humans within the AD-continuum indicated a stage-depended reduction of microglia synchronicity associated with cognitive decline. scRadiotracing in mice showed that the increased TSPO signal was attributed to microglia.

Conclusion: Using TSPO-PET imaging of mice with depleted microglia and scRadiotracing in an amyloid model, we provide first evidence that a microglia connectome can be assessed in the mouse brain. Microglia synchronicity is closely associated with cognitive decline in AD and could serve as an independent personalized biomarker for disease progression.

Keywords: Alzheimer’s disease; Brain connectivity; Dementia; Microglia; Microglia desynchronization; Microglia synchronicity; Neuroinflammation; PET; TSPO.


Conflict of interest statement

NLA and MBr are members of the Neuroimaging Committee of the EANM. RR has received consultancy honoraria from SAGE and GABA Therapeutics. NF has received consultancy honoraria from MSD and speaker honoraria from LMI. MB received speaker honoraria from Roche, GE healthcare and Life Molecular Imaging and is an advisor of Life Molecular Imaging. KB received speaker honoraria or travel support by Lilly Deutschland, Eisai, Roche, Biogen, Novo Nordisk. All other authors declare they have no competing interests.

Figures

Fig. 1
Fig. 1
Study design. In both mouse (A) and human (B) studies, TSPO-PET images were registered to a tracer specific template. Based on extracted mean values, inter-correlation-coefficients (ICCs) were calculated. In the human study (B), we additionally calculated a microglia synchronicity index (desynchronization index, DI) for each subject on a single volume-of-interest (VOI) basis (see detailed explanation further in text and in Fig. 9A). For each VOI, we compared the DIs between studied cohorts and correlated it with two cognition scores. C Overview of mouse cohorts. The numbers in green indicate the number of mice in corresponding cohorts. Light green color stands for mice with pharmacologically depleted microglia (PLX5622). WT = wild type; AD = Alzheimer’s disease; CTRL = healthy control
Fig. 2
Fig. 2
Mean TSPO-PET uptake (global mean-scaled) in each study cohort. Microglia depletion study in mice: A WT mice with microglia depleted by PLX5622 injection (WT PLX5622) and age-matched WT mice with placebo injection (WT Placebo) at 6–9 months of age, B Aβ mouse model (PS2APP) with microglia depleted by PLX5622 injection (PS2APP PLX5622) and age-matched mice with placebo injection (PS2APP Placebo) at 11.5 months of age, C Aβ mouse model (deltaE9) with microglia depleted by PLX5622 injection (deltaE9 PLX5622) and age-matched mice with placebo injection (deltaE9 Placebo) at 6 months of age. D Dysfunctional microglia study in mice: mice with deficient Trem2 gene (Trem2−/−) and age-matched WT mice at 12 months of age. E Dysfunctional microglia study in an Aβ mouse model (APPPS1): with intact Trem2 (APPPS1 Trem2+/+) and deficient Trem2 (APPPS1 Trem2−/−) at 12 months of age. F Study of mouse models at the onset of neuropathology: an Aβ mouse model (AppNL−G−F), a tau mouse model (P301S), and age-matched WT mice at 2–2.5 months of age. G Study of mouse models with moderate neuropathology: two Aβ mouse models (AppNL−G−F and APPPS1), a tau mouse model (P301S), and age-matched WT mice at 5–6 months of age. H Study of a mouse model of acute ischemic stroke: mice 7 days after photothrombotic surgery (Stroke) and sham surgery (Sham) at 2 months of age. I Human AD continuum study: subjects with prodromal AD, AD dementia, age-matched control subjects (CTRL test), and young control subjects used for calculation of the normal synchronicity (CTRL train). n represents the number of subjects; the mean age is shown on the bottom right of each image
Fig. 3
Fig. 3
Specificity of microglia synchronicity assessment via interregional correlation coefficients (ICC). Plots show ICC heatmaps, absolute ICC values and significant connections of the depletion experiment and in mouse models with dysfunctional microglia. A, B, C Mice with intact microglia (WT Placebo, n = 14) versus mice with depleted microglia (WT PLX5622, n = 14). D, E, F Trem2+/+ versus Trem2−/− mice. G, H, I APPPS1-transgenic Trem2+/+ versus APPPS1-transgenic Trem2−/− mice. (A, D, G) ICC values for all the pairs of the 21 VOIs. B, E, H Distributions of absolute ICCs, p-values derive from a Wilcoxon signed-rank test. C, F, I Significant connections (p < 0.005), including cortical (solid line), subcortical (dashed line), and cortical-subcortical (dotted line) connections; the number of the corresponding connections is shown in gray. All significant connections are also projected into 3D brain images, where the color of the connection represents its value; the nodes are individual VOIs, the size of the node reflects the number of its connections; the total number of connections is shown in gray
Fig. 4
Fig. 4
Assessment of microglia synchronicity in AD mouse models at the onset of neuropathology. Plots show ICC heatmaps, absolute ICC values and significant connections of the investigated AD mouse models at 2.0–2.5 months of age. A, D Wild-type (WT) mice (n = 12) versus P301S mice (n = 12). C, E WT mice versus AppNL−G−F mice (n = 12). A, C ICC values for all the pairs of the 21 VOIs. B Distributions of absolute ICCs, p-values derive from a Wilcoxon signed-rank test. D, E Significant connections (p < 0.005), including cortical (solid line), subcortical (dashed line), and cortical-subcortical (dotted line) connections; the number of the corresponding connections is shown in gray. All significant connections are also projected into 3D brain images, where the color of the connection represents its value; the nodes are individual VOIs, the size of the node reflects the number of its connections; the total number of connections is shown in gray
Fig. 5
Fig. 5
Assessment of microglia synchronicity in AD mouse models with moderate neuropathology. Plots show ICC heatmaps, absolute ICC values and significant connections of the investigated mouse models of AD at 5–6 months of age. A, E Wild-type (WT) mice versus P301S mice. C, F WT mice (n = 14) versus AppNL−G−F mice (n = 14) D, G WT mice versus APPPS1-transgenic mice (n = 14). A, C, D ICC values for all the pairs of the 21 VOIs. B Distributions of absolute ICCs, p-values derive from a Wilcoxon signed-rank test. E, F, G Significant connections (p < 0.005), including cortical (solid line), subcortical (dashed line), and cortical-subcortical (dotted line) connections; the number of the corresponding connections is shown in gray. All significant connections are also projected into 3D brain images, where the color of the connection represents its value; the nodes are individual VOIs, the size of the node reflects the number of its connections; the total number of connections is shown in gray
Fig. 6
Fig. 6
Assessment of microglia synchronicity in Aβ mouse models after microglia depletion. Plots show ICC heatmaps, absolute ICC values and significant connections of the investigated Aβ mouse models. A, B, C PS2APP mice with intact microglia (Placebo, n = 10) versus PS2APP mice with depleted microglia (PLX5622, n = 10). D, E, F DeltaE9 mice with intact microglia (Placebo, n = 8) versus deltaE9 mice with depleted microglia (PLX5622, n = 8). A, D ICC values for all the pairs of the 21 VOIs. B, E Distributions of absolute ICCs, p-values derive from a Wilcoxon signed-rank test. C, F Significant connections (p < 0.005), including cortical (solid line), subcortical (dashed line), and cortical-subcortical (dotted line) connections; the number of the corresponding connections is shown in gray. All significant connections are also projected into 3D brain images, where the color of the connection represents its value; the nodes are individual VOIs, the size of the node reflects the number of its connections; the total number of connections is shown in gray
Fig. 7
Fig. 7
Ratio of the total number of connections in the investigated mouse cohorts relative to their corresponding reference cohorts. The name of each reference cohort can be found in Supplementary Table S4
Fig. 8
Fig. 8
Assessment of microglia synchronicity in patients of the AD continuum and healthy controls. A, G Cognitively normal subjects (CTRL, n = 17) versus subjects with subjective memory decline or mild cognitive impairment (prodromal AD, n = 17). C, H Cognitively normal subjects (CTRL) versus subjects with AD dementia (n = 17). A, C ICC values (Fisher’s Z) for all the pairs between the 94 VOIs. B Distributions of absolute ICCs, p-values derive from a Wilcoxon signed-rank test. D, E, F Significant connections of CTRL, prodromal AD, and AD dementia, respectively, projected into 3D brain images. The color of the connection represents its value; the nodes are individual VOIs, the size of the node reflects the number of its connections; the total number of connections is shown in black. G, H Significant connections, including parietal (solid line), temporal (dashed line), and temporal-parietal (dotted line) connections; the number of corresponding connections is shown in gray. CTRL = healthy control; AD = Alzheimer’s disease
Fig. 9
Fig. 9
Personalized desynchronization of microglia connectome in patients of AD continuum when compared to healthy controls. A Calculation of the desynchronization index (DI) for an exemplary VOIi SUVRij is mean SUV ratio in VOI i of patient j. Mock data are shown. B, C Individual DIs calculated for cognitively normal (n=12) and patients of the AD continuum (prodromal AD: n=17, AD dementia: n=17). Only VOIs with significant differences in DI are shown. B Parietal VOIs, C Temporal VOIs. D First principal component (PC1) calculated based on the VOIs with significant differences in DI. Each dot represents an individual subject. Unpaired t-test: * - p < 0.05, ** - p < 0.01, *** - p < 0.0001. The p-value of one-way ANOVA is shown on top of each plot. Each VOI is shown on a 3D surface with a black arrow, R and L represent the hemisphere where the VOI is located. The 3D surfaces display F-values (one-way ANOVA) for all the 94 temporal and parietal Schaefer VOIs
Fig. 10
Fig. 10
Personalized desynchronization of microglia connectome correlates with cognitive performance. Relationships between the desynchronization index (DI) and MMSE scores are shown for VOIs with significant correlations after FDR correction. A Parietal VOIs, (B) temporal VOIs. p is the correlation p-value, pFDR is the corresponding p-value after FDR correction, r is the Pearson’s r, m is the slope of the fit, b is its intercept. 3D surfaces display Pearson’s r for all the 94 temporal and parietal Schaefer VOIs. The localization of the VOIs is shown by the white arrow on the corresponding 3D brain surface. R and L represent the hemisphere of the VOI. C Relationship between the first principal component (PC1), calculated based on the VOIs with significant differences in DI compared to CTRL (Fig. 9), and MMSE scores. CTRL: n=12, prodromal AD: n=17, AD dementia: n=17
Fig. 11
Fig. 11
Single-cell radiotracing disentangles microglia as biological driver of TSPO-PET desynchronization in an AD mouse. A scRadiotracing workflow. B Percentage of isolated microglia and astrocytes fraction in the single cell suspension of WT (n=5) and AppNL-G-F mice (n=7). C Cellular TSPO tracer uptake in microglia and astrocytes as identified by scRadiotracing (WT: n=8, AppNL-G-F: n=8). Unpaired t-test: **: p < 0.01, ***: p < 0.001. Each point corresponds to a single mouse. D Graphical summary of (B) and (C): the number of cells in 3D brain images is proportional to the isolated cell fraction in the corresponding region; the size of the cells is related to the cellular TSPO tracer uptake in the region (square root relationship for display purpose). The scatter plots display the relationship between the cellular tracer uptake in the forebrain and the hindbrain; each point stands for a single animal; the straight lines represent linear fits calculated per cohort. Line color and thickness are proportional to Fisher’s Z and absolute Fisher’s Z, respectively, both in scatter plots and in 3D representations. Lower absolute Fisher’s Z corresponds to a higher degree of forebrain-hindbrain desynchronization. Estimated contributions of non-microglia/non-astrocyte cell types and gating strategies of quality control are presented in Supplementary Fig. S7

References

    1. Heneka MT, Carson MJ, El Khoury J, Landreth GE, Brosseron F, Feinstein DL, et al. Neuroinflammation in Alzheimer’s disease. The Lancet Neurology. 2015;14(4):388–405. 10.1016/S1474-4422(15)70016-5 - DOI - PMC - PubMed
    1. Serrano-Pozo A, Mielke ML, Gómez-Isla T, Betensky RA, Growdon JH, Frosch MP, Hyman BT. Reactive glia not only associates with plaques but also parallels tangles in Alzheimer’s disease. Am J Pathol. 2011;179(3):1373–84. 10.1016/j.ajpath.2011.05.047 - DOI - PMC - PubMed
    1. Fan Z, Brooks DJ, Okello A, Edison P. An early and late peak in microglial activation in Alzheimer’s disease trajectory. Brain. 2017;140(3):792–803. - PMC - PubMed
    1. Rauchmann BS, Brendel M, Franzmeier N, Trappmann L, Zaganjori M, Ersoezlue E, et al. Microglial Activation and Connectivity in Alzheimer Disease and Aging. Ann Neurol. 2022;92(5):768–81. - PubMed
    1. Pascoal TA, Benedet AL, Ashton NJ, Kang MS, Therriault J, Chamoun M, et al. Microglial activation and tau propagate jointly across Braak stages. Nat Med. 2021;27(9):1592–9. 10.1038/s41591-021-01456-w - DOI - PubMed

Substances