. 2024 Sep 5;14(1):114.
doi: 10.1186/s13578-024-01300-x.

YIPF2 regulates genome integrity

Affiliations

YIPF2 regulates genome integrity

Xiao Zhang et al. Cell Biosci. .

Abstract

Understanding of the mechanisms for genome integrity maintenance can help in developing effective intervention strategies to combat aging. A whole-genome RNAi screen was conducted to identify novel factors involved in maintaining genome stability. The potential target genes identified in the screening are related to the cell cycle, proteasome, and spliceosomes. Unexpectedly, the Golgi protein YIPF2 has been found to play a critical role in maintaining genome stability. The depletion of YIPF2 hinders the process of homologous recombination (HR) repair, which then triggers DNA damage response mechanisms, ultimately leading to cellular senescence. The overexpression of YIPF2 facilitated cellular recovery from DNA damage induced by chemotherapy agents or replicative senescence-associated DNA damage. Our findings indicate that only the intact Golgi apparatus containing YIPF2 provides a protective effect on genome integrity.


Conflict of interest statement

The authors declare that they have no competing interests.

Figures

Fig. 1
Fig. 1
Genome-wide siRNAs screening identifies YIPF2 as a novel protein involved in genome integrity. A Workflow of the genome-wide siRNAs screening. IMR90 cells were transfected with siNC or a mixed four siRNAs. 1206 genes were screened out in the first-round screening. The second-round screening for these 1206 genes was carried out using the same procedure. B Volcano plot of CCF fold changes (Log2FC) in the first-round screening. C KEGG analysis of 1206 candidate genes identified in the first-round screening. D Volcano plot of CCF Log2FC in the second-round screening. E KEGG analysis of candidate genes in the second screening. F List of genes in the siRNA screening that are associated with genome integrity
Fig. 2
Fig. 2
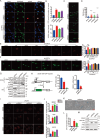
YIPF2 depletion impaired genomic integrity. A Detection of CCF foci in control and YIPF2-depleted IMR90 cells. The red arrow marks CCF. Scale bars, 20 μm. B Quantification of (A): the number of CCF foci per cell and nuclear γH2A.X signaling intensity (n ≥ 100). Error bars indicate mean ± SEM of three independent experiments. P values were calculated using a one-tailed Student’s t-test (**p < 0.01, ****p < 0.0001). C Detection of neutral comet assay in the control and YIPF2-depleted IMR90 cells. Scale bars, 100 μm. D Quantification of (C): the tail moment of each cell (n ≥ 100). Error bars indicate mean ± SEM of three independent experiments. P values were calculated using a one-tailed Student’s t-test (****p < 0.0001). E Detection of γH2A.X foci in the control and full-length or truncated YIPF2 construction in YIPF2-depleted IMR90 cells. Scale bars, 20 μm. F. Quantification of the tail moment of each cell (n ≥ 100). Error bars indicate mean ± SEM of three independent experiments. P values were calculated using a one-tailed Student’s t-test (****p < 0.0001). G Immunoblotting analysis of the DDR markers in control and YIPF2-depleted IMR90 cells. H Evaluation of the effect of YIPF2 on DNA damage repair using HDR-GFP reporter. Diagram of the U2OS HDR-GFP reporter (left). HDR activity in the control and YIPF2-depleted U2OS HDR-GFP cells were examined, knockdown of BRCA1 was chose as a positive control (middle). The BRCA1 mRNA level was confirmed by RT-PCR (right). Error bars indicate mean ± SEM of three independent experiments. P values were calculated using a one-tailed Student’s t-test (*p < 0.05, **p < 0.01). I Detection of γH2A.X foci in control and YIPF2-depleted IMR90 cells, HDF cells and U2OS cells. Scale bars, 20 μm. J Quantification of (I): the number of γH2A.X foci per cell (n ≥ 100). Error bars indicate mean ± SEM of three independent experiments. P values were calculated using a one-tailed Student’s t-test (****p < 0.0001, ***p < 0.001, **p < 0.01, *p < 0.05). K Detection of SA-β-gal activity in control and YIPF2-depleted IMR90 cells. Scale bars, 100 μm. L Quantification of (K): the percentage of SA-β-gal staining positive cells (n ≥ 100). Error bars indicate mean ± SEM of three independent experiments. P values were calculated using a one-tailed Student’s t-test (*p < 0.05). M Immunoblotting analysis of the cellular senescent markers in control and YIPF2-depleted IMR90 cells
Fig. 3
Fig. 3
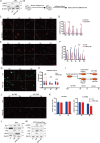
Overexpression of YIPF2 promotes genomic integrity and DDR. A Immunoblotting analysis of the γH2A.X level and YIPF2 level in proliferating or senescent cells and YIPF2 overexpression in senescent cells (P. represents proliferating cells; Sen. represents senescent cells). B Schematic of Zeocin treatment experimental workflow was shown. Cells were treated with 100 μg/mL Zeocin for 2 h and continued cultivation for different times and γH2A.X foci were examined. C Detection of γH2A.X foci after 0, 2, 4, 8, 12 h withdrawal of Zeocin in control and YIPF2-depleted IMR90 cells. Scale bars, 20 μm. D Quantification of (C): the number of γH2A.X foci per cell (n ≥ 100). Error bars indicate mean ± SEM of three independent experiments. P values were calculated using a one-tailed Student's t-test (****p < 0.0001, ***p < 0.001, *p < 0.05). E Detection of γH2A.X foci after 0, 2, 4, 8, 12 h withdrawal of Zeocin in control and YIPF2 overexpressing IMR90 cells. Scale bars, 20 μm. F Quantification of (E): the number of γH2A.X foci per cell (n ≥ 100). Error bars indicate mean ± SEM of three independent experiments. P values were calculated using a one-tailed Student's t-test (****p < 0.0001, ***p < 0.001, *p < 0.05). G Detection of neutral comet assay after 0, 4, 12 h withdrawal of Zeocin in control and YIPF2 overexpressing IMR90 cells. Scale bars, 100 μm. H Quantification of (G): the tail moment of each cell (n ≥ 100). Error bars indicate mean ± SEM of three independent experiments. P values were calculated using a one-tailed Student’s t-test (****p < 0.0001). I Schematic of serum starvation experimental workflow. Cells were cultured without serum for 18 h. Then the cells were treated with 100 μg/mL Zeocin for 1 h under conditions of 10% FBS or no FBS and continued cultivation with 10% FBS or no FBS for another 4 h. J Detection of γH2A.X foci under conditions of no FBS or 10% FBS in control and YIPF2 overexpressing IMR90 cells. Scale bars, 20 μm. K Quantification of γH2A.X foci per cell in Fig. 3 J (n ≥ 100). Error bars indicate mean ± SEM of three independent experiments. P values were calculated using a one-tailed Student’s t-test (*p < 0.05). L Senescent markers in control and YIPF2 overexpression IMR90 cells were detected using western blotting. M Immunoblotting analysis of the DNA damage and cellular senescence markers in control and YIPF2 overexpressing IMR90 cells with ETO treatment
Fig. 4
Fig. 4
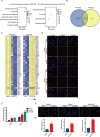
YIPF2 regulated DNA replication genes. A KEGG analysis of differentially expressed genes (DEG) for YIPF2-depleted cells (left panel) and YIPF2 overexpressing cells (right panel). B Venn diagram analysis of DEGs including cell cycle and DNA replication relevant genes in YIPF2-depletion cells and YIPF2 overexpressing cells. C Heatmap analysis of the co-regulated DEGs in YIPF2-depletion cells (left panel) and YIPF2 overexpressing cells (right panel). D Detection of pRPA2 S33 foci in control and YIPF2-depleted IMR90 cells treated with DMSO or Zeocin. Scale bars, 20 μm. E The number of pRPA2 S33 foci per cell was examined (n ≥ 100). Error bars indicate mean ± SEM of three independent experiments. P values were calculated using a one-tailed Student's t-test (**p < 0.01, *p < 0.05). F Detection of Golgi apparatus morphology in control and shYIPF2 cells. Immunostaining of GM130, TGN46 and GRASP65. G The area of Golgi was quantified by ZEN (n ≥ 100). The relative ratio is shown. Error bars indicate mean ± SEM of three independent experiments. P values were calculated using a one-tailed Student’s t-test (****p < 0.0001, **p < 0.01, *p < 0.05)

Similar articles

Cited by

  • Gene therapy strategies for aging intervention.
    Jing Y, Ren J, Qu J, Liu GH. Jing Y, et al. Cell Insight. 2025 May 23;4(4):100254. doi: 10.1016/j.cellin.2025.100254. eCollection 2025 Aug. Cell Insight. 2025. PMID: 40677784 Free PMC article. Review.

References

    1. Papamichos-Chronakis M, Peterson CL. Chromatin and the genome integrity network. Nat Rev Genet. 2013;14:62–75. 10.1038/nrg3345. 10.1038/nrg3345 - DOI - PMC - PubMed
    1. Friedberg EC. DNA damage and repair. Nature. 2003;421:436–40. 10.1038/nature01408. 10.1038/nature01408 - DOI - PubMed
    1. Strehler BL. Genetic instability as the primary cause of human aging. Exp Gerontol. 1986;21:283–319. 10.1016/0531-5565(86)90038-0. 10.1016/0531-5565(86)90038-0 - DOI - PubMed
    1. Gensler HL, Bernstein H. DNA damage as the primary cause of aging. Q Rev Biol. 1981;56:279–303. 10.1086/412317. 10.1086/412317 - DOI - PubMed
    1. Schumacher B, Pothof J, Vijg J, Hoeijmakers JHJ. The central role of DNA damage in the ageing process. Nature. 2021;592:695–703. 10.1038/s41586-021-03307-7. 10.1038/s41586-021-03307-7 - DOI - PMC - PubMed

LinkOut - more resources