

Propensity Score Analysis With Baseline and Follow-Up Measurements of the Outcome Variable
- PMID: 39238047
- PMCID: PMC11788469
- DOI: 10.1002/pst.2436
Propensity Score Analysis With Baseline and Follow-Up Measurements of the Outcome Variable
Abstract
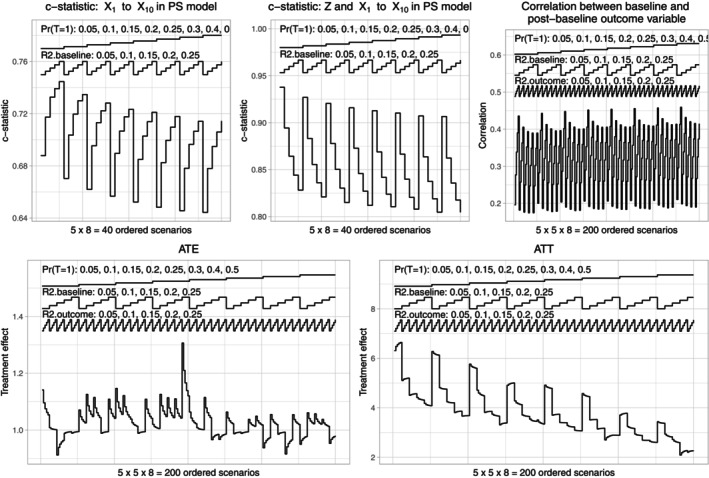
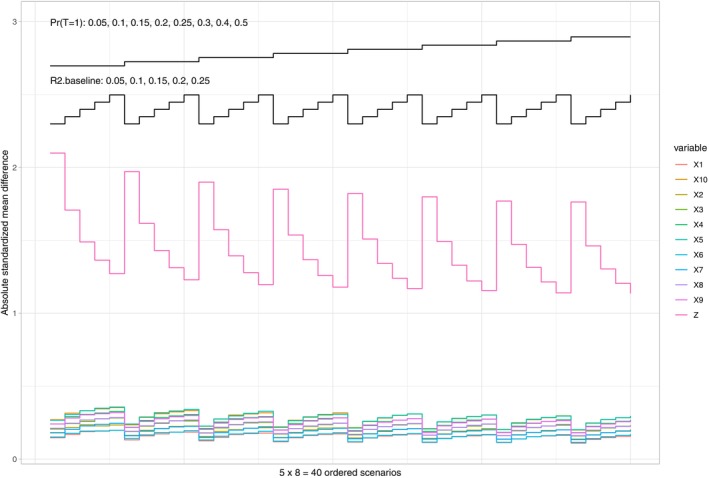
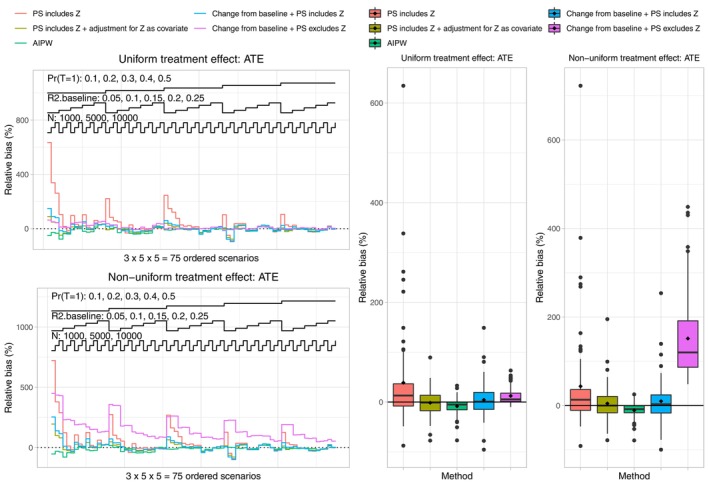
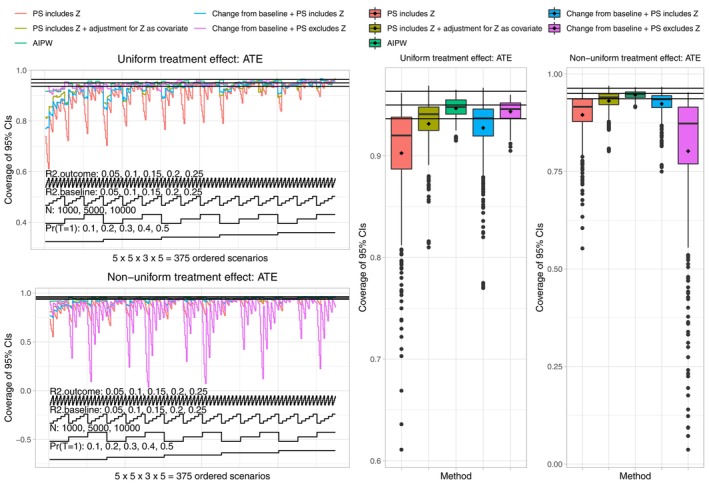
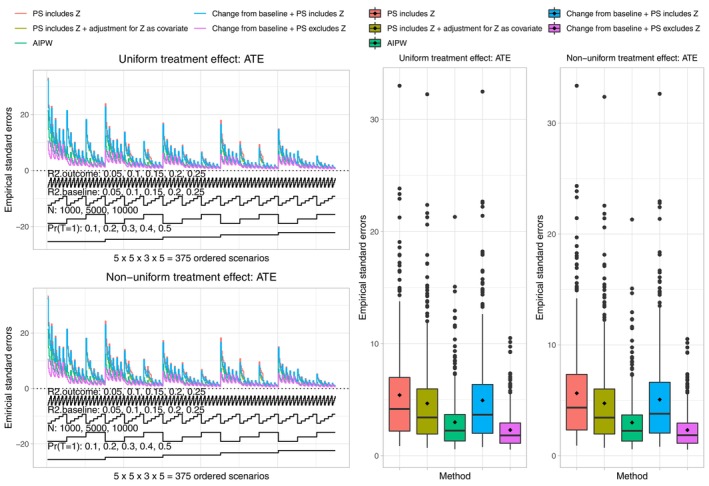
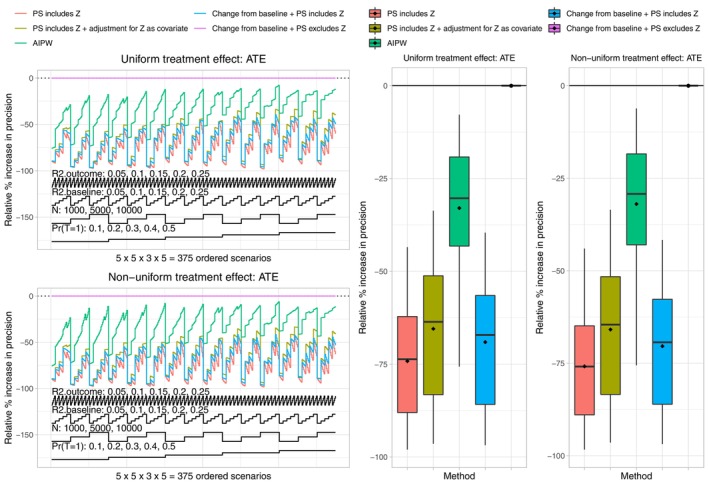
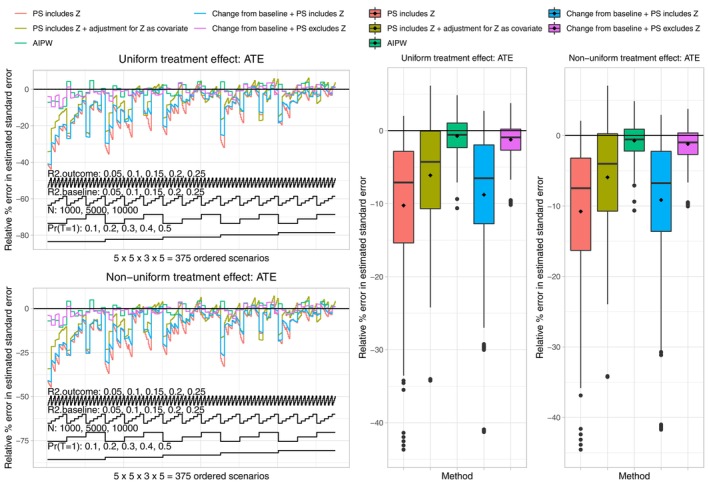
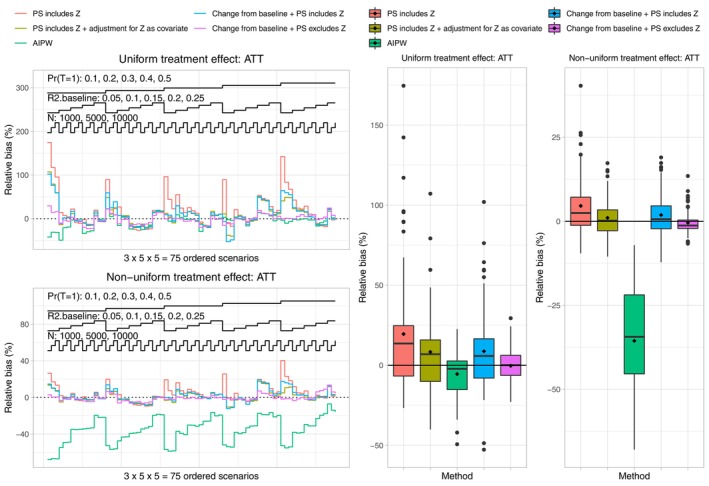
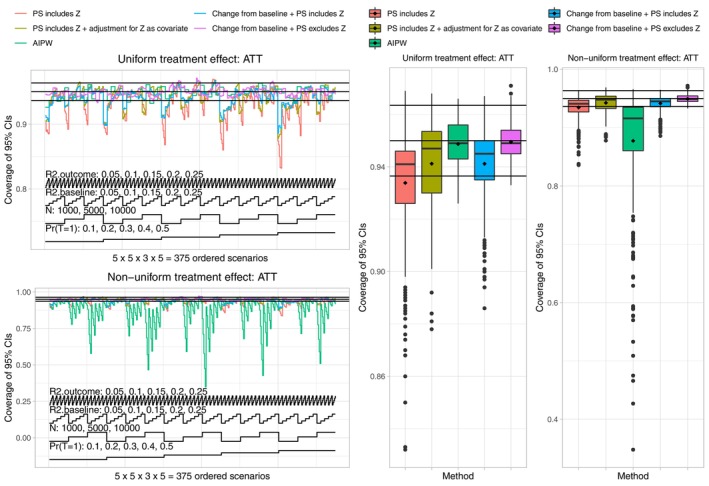
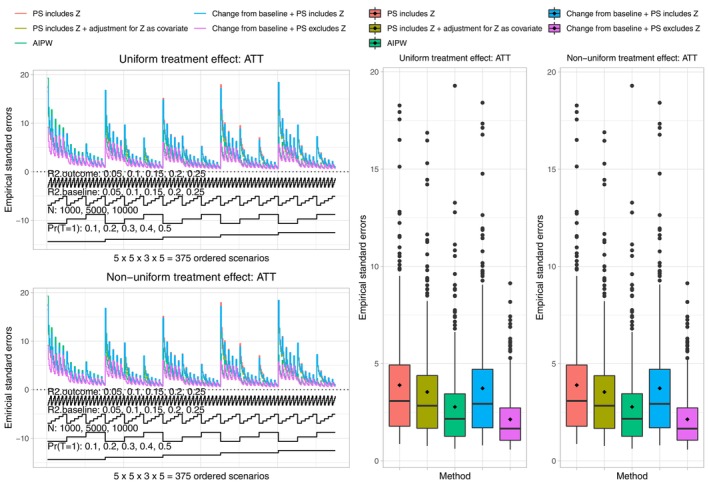
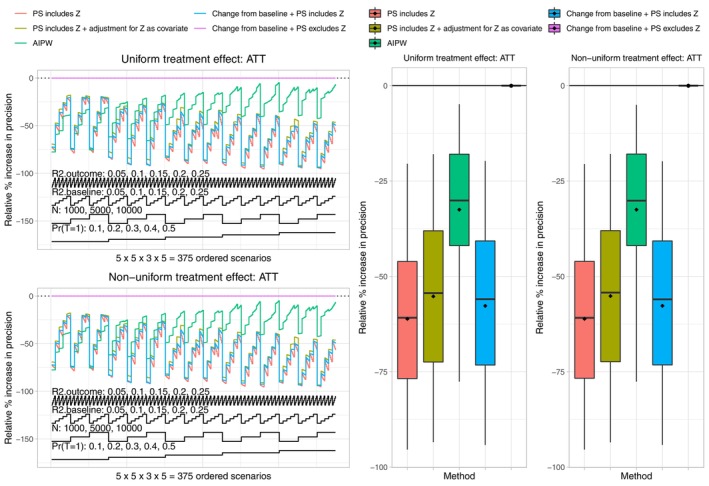
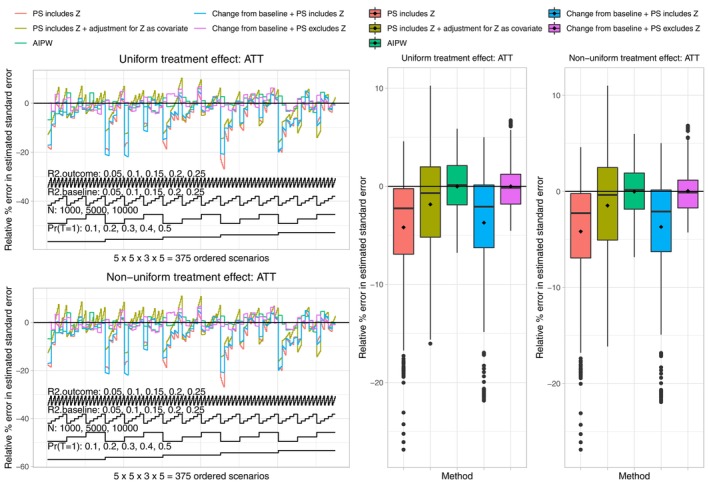
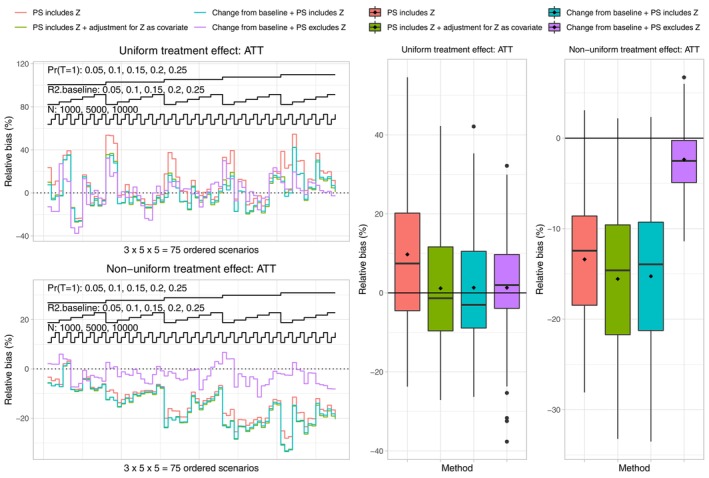
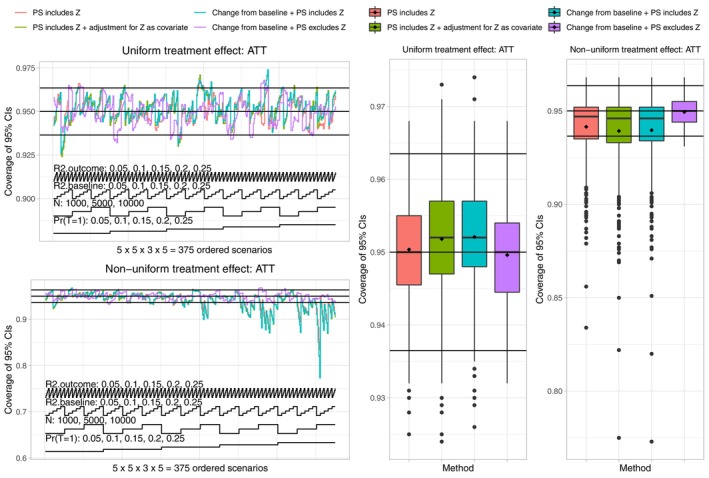
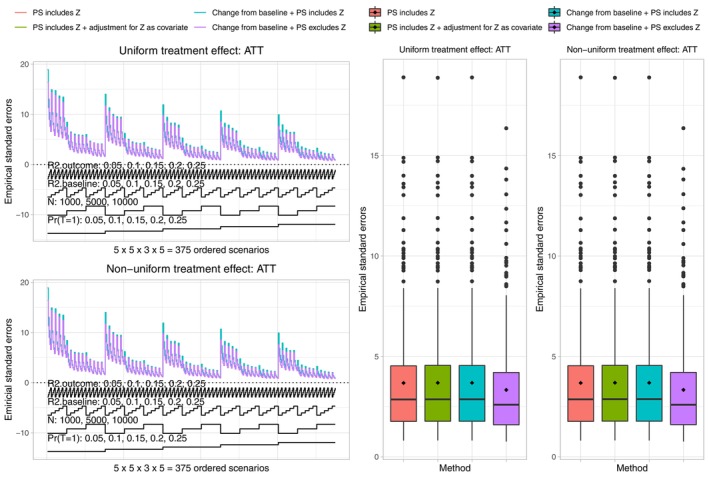
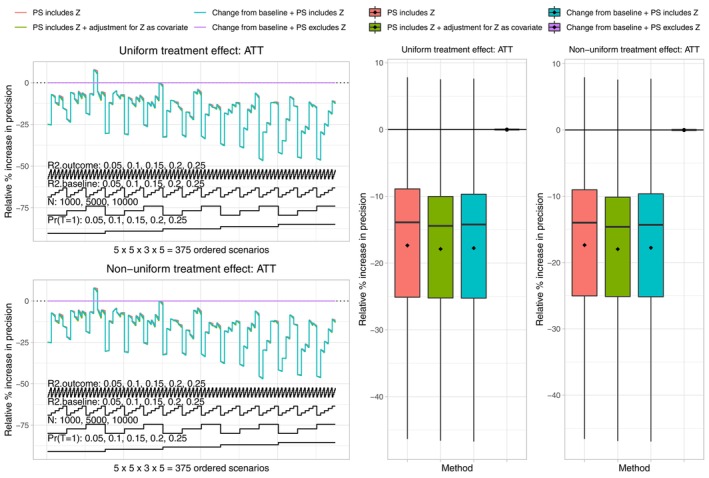
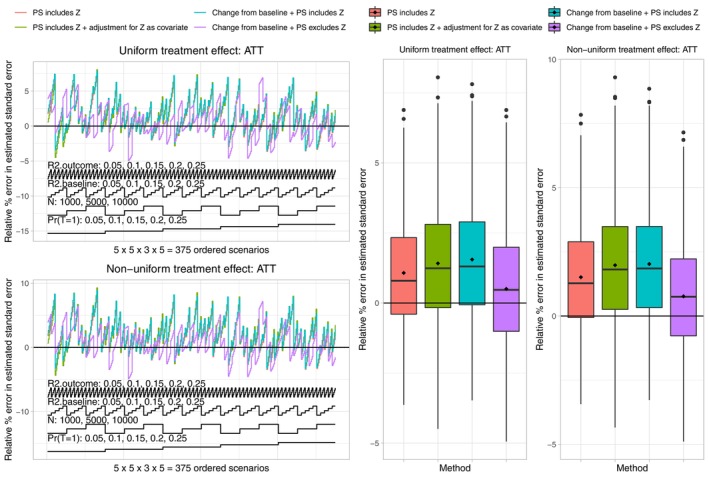
A common feature in cohort studies is when there is a baseline measurement of the continuous follow-up or outcome variable. Common examples include baseline measurements of physiological characteristics such as blood pressure or heart rate in studies where the outcome is post-baseline measurement of the same variable. Methods incorporating the propensity score are increasingly being used to estimate the effects of treatments using observational studies. We examined six methods for incorporating the baseline value of the follow-up variable when using propensity score matching or weighting. These methods differed according to whether the baseline value of the follow-up variable was included or excluded from the propensity score model, whether subsequent regression adjustment was conducted in the matched or weighted sample to adjust for the baseline value of the follow-up variable, and whether the analysis estimated the effect of treatment on the follow-up variable or on the change from baseline. We used Monte Carlo simulations with 750 scenarios. While no analytic method had uniformly superior performance, we provide the following recommendations: first, when using weighting and the ATE is the target estimand, use an augmented inverse probability weighted estimator or include the baseline value of the follow-up variable in the propensity score model and subsequently adjust for the baseline value of the follow-up variable in a regression model. Second, when the ATT is the target estimand, regardless of whether using weighting or matching, analyze change from baseline using a propensity score that excludes the baseline value of the follow-up variable.
Keywords: Monte Carlo simulations; baseline covariates; inverse probability of treatment weighting; propensity score analysis; propensity score matching.
© 2024 The Author(s). Pharmaceutical Statistics published by John Wiley & Sons Ltd.
Conflict of interest statement
The author declares no conflicts of interest.
Figures
References
-
- Altman D. G. and Dore C. J., “Baseline Comparisons in Randomized Clinical Trials,” Statistics in Medicine 10, no. 5 (1991): 797–799. - PubMed
-
- Senn S., “Baseline Comparisons in Randomized Clinical Trials,” Statisics in Medicine 10 (1991): 1157–1159. - PubMed
-
- Administration USDoHaHSFaD , ed., Adjusting for Covariates in Randomized Clinical Trials for Drugs and Biological Products (Silver Springs, MD: Food and Drug Administration, 2023).
-
- Rosenbaum P. R. and Rubin D. B., “The Central Role of the Propensity Score in Observational Studies for Causal Effects,” Biometrika 70 (1983): 41–55.
MeSH terms
Grants and funding
LinkOut - more resources
Full Text Sources
Research Materials
