. 2024 Sep 6;14(1):115.
doi: 10.1186/s13578-024-01297-3.

Targeting stress induction of GRP78 by cardiac glycoside oleandrin dually suppresses cancer and COVID-19

Affiliations

Targeting stress induction of GRP78 by cardiac glycoside oleandrin dually suppresses cancer and COVID-19

Dat P Ha et al. Cell Biosci. .

Abstract

Background: Despite recent therapeutic advances, combating cancer resistance remains a formidable challenge. The 78-kilodalton glucose-regulated protein (GRP78), a key stress-inducible endoplasmic reticulum (ER) chaperone, plays a crucial role in both cancer cell survival and stress adaptation. GRP78 is also upregulated during SARS-CoV-2 infection and acts as a critical host factor. Recently, we discovered cardiac glycosides (CGs) as novel suppressors of GRP78 stress induction through a high-throughput screen of clinically relevant compound libraries. This study aims to test the possibility that agents capable of blocking stress induction of GRP78 could dually suppress cancer and COVID-19.

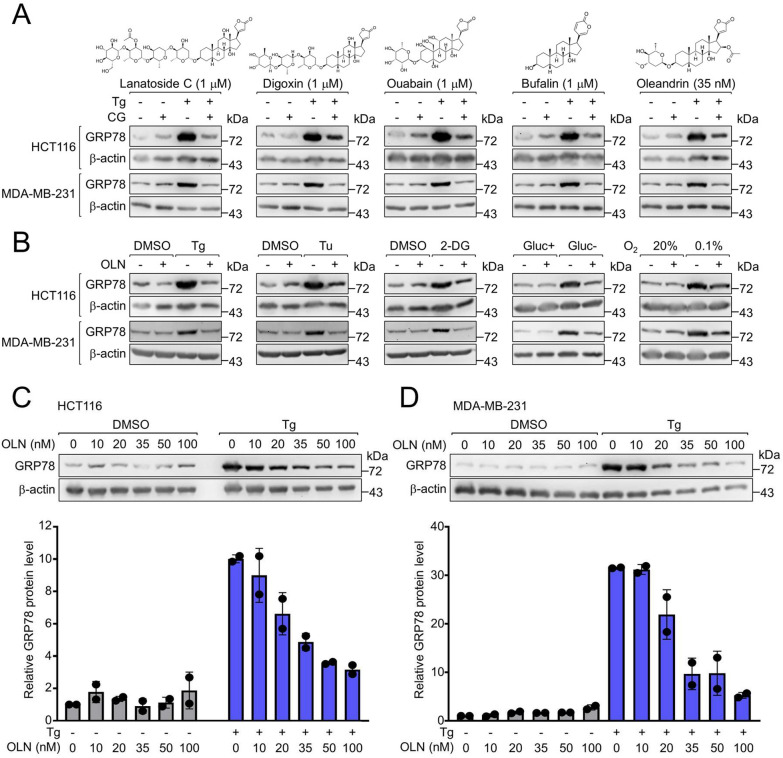
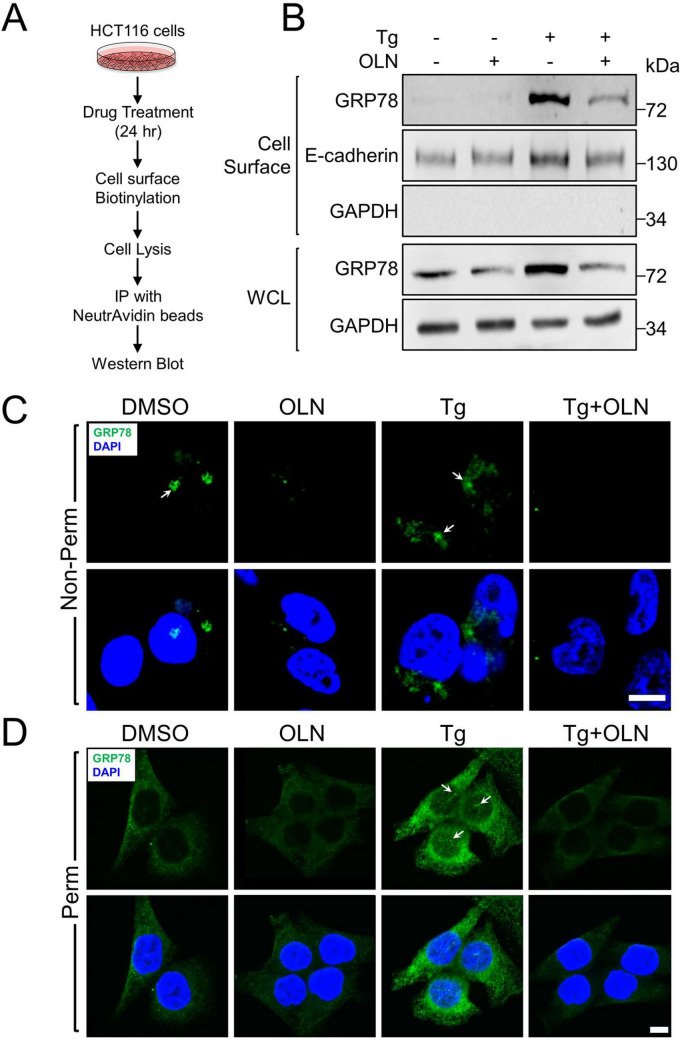
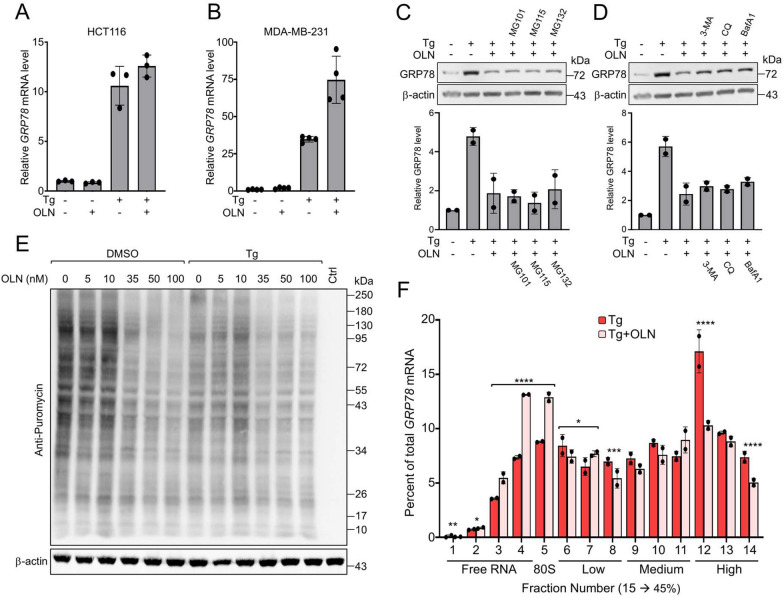
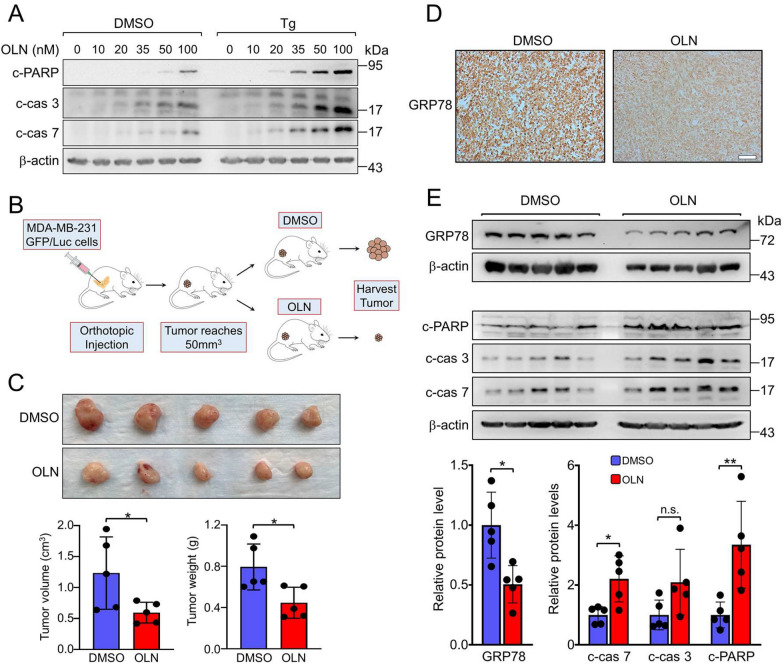
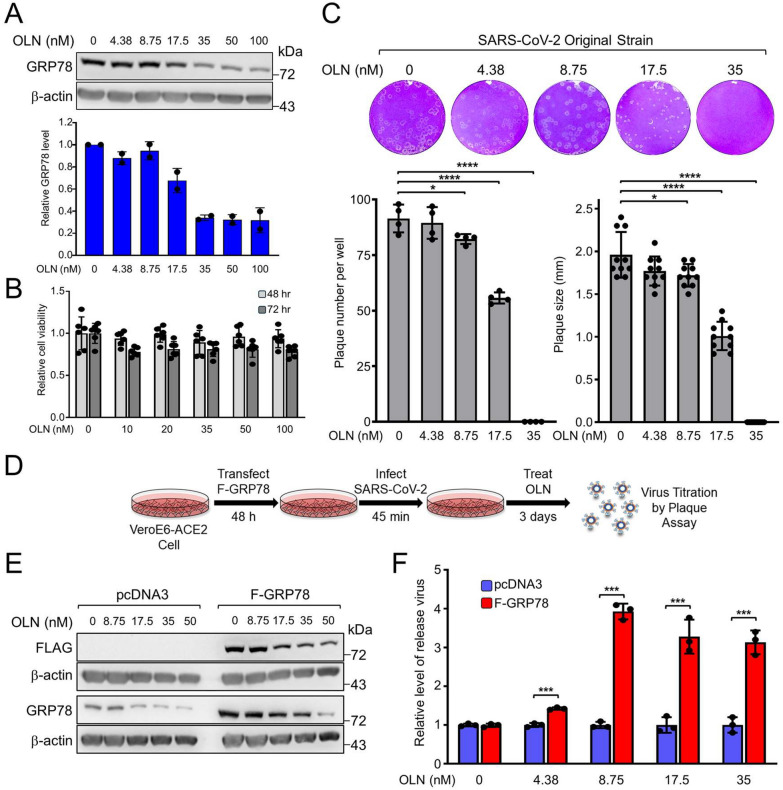
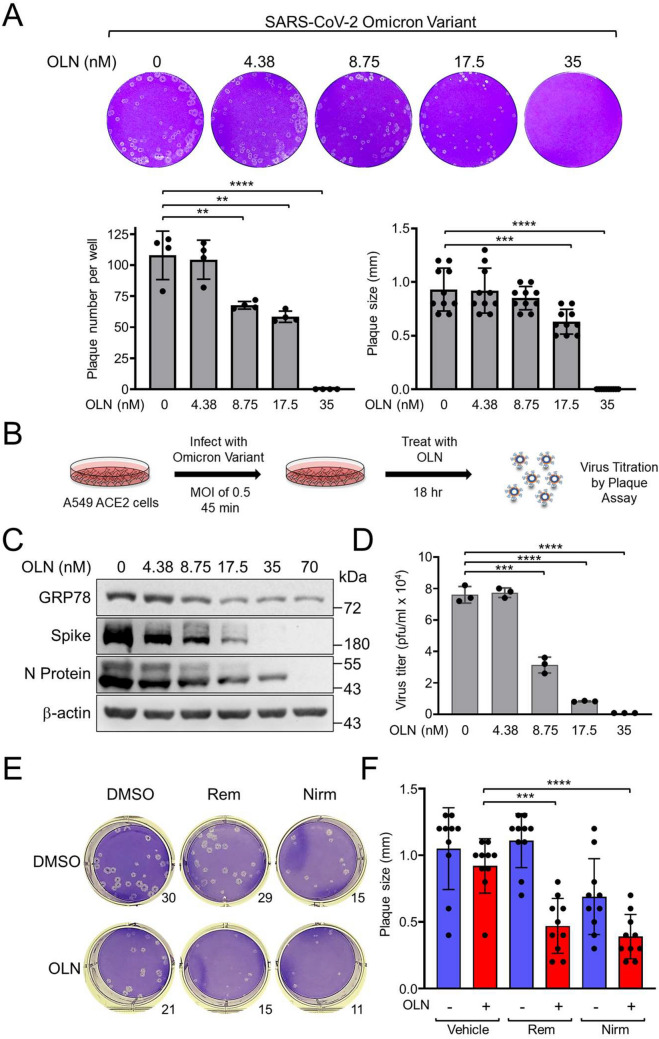
Results: Here we report that oleandrin (OLN), is the most potent among the CGs in inhibiting acute stress induction of total GRP78, which also results in reduced cell surface and nuclear forms of GRP78 in stressed cells. The inhibition of stress induction of GRP78 is at the post-transcriptional level, independent of protein degradation and autophagy and may involve translational control as OLN blocks stress-induced loading of ribosomes onto GRP78 mRNAs. Moreover, the human Na+/K+-ATPase α3 isoform is critical for OLN suppression of GRP78 stress induction. OLN, in nanomolar range, enhances apoptosis, sensitizes colorectal cancer cells to chemotherapeutic agents, and reduces the viability of patient-derived colon cancer organoids. Likewise, OLN, suppresses GRP78 expression and impedes tumor growth in an orthotopic breast cancer xenograft model. Furthermore, OLN blocks infection by SARS-CoV-2 and its variants and enhances existing anti-viral therapies. Notably, GRP78 overexpression mitigates OLN-mediated cancer cell apoptotic onset and suppression of virus release.

Conclusion: Our findings validate GRP78 as a target of OLN anti-cancer and anti-viral activities. These proof-of-principle studies support further investigation of OLN as a readily accessible compound to dually combat cancer and COVID-19.

Keywords: Anti-cancer therapy; Anti-viral therapy; Breast cancer; Cardiac glycosides; Colon cancer; ER stress; GRP78; Oleandrin; SARS-CoV-2.


Conflict of interest statement

A.S.L. is a scientific advisory board member of BiPER Therapeutics. M.Y. is the founder and president of CanTraCer Biosciences Inc. The other co-authors declare no competing interests.

Figures

Fig. 1
Fig. 1
Oleandrin inhibits induction of GRP78 by multiple stress inducers in human cancer cell lines. A Human colorectal carcinoma cell line HCT116 or triple-negative breast cancer cell line MDA-MB-231 were treated with 1 μM of lanatoside C, digoxin, ouabain, bufalin or 35 nM of oleandrin alone or in combination with the ER stress inducer Tg (300 nM) for 24 h. Whole cell lysates (WCLs) were subjected to Western blot analysis for GRP78 protein level with β-actin serving as loading control. B Same as in (A) except the cells were treated with 35 nM of oleandrin (OLN) alone or in combination with the followings: Tg (300 nM), Tu (1.78 mM), 2-DG (10 mM), DMEM containing 4.5 mg/ml glucose (Glu +), glucose-free DMEM (Glu-), 20% O2, or 0.1% O2. C HCT116 cells were treated with OLN (from 10 to 100 nM) alone or in combination with Tg (300 nM) for 24 h. WCLs were subjected to Western blot analysis for GRP78 protein level with β-actin serving as loading control. Quantitation of the relative levels of GRP78 normalized to β-actin are shown in the graphs below. D Same as in (C) except MDA-MB-231 cells were used. Data are presented as mean ± S.D
Fig. 2
Fig. 2
Oleandrin treatment suppresses stress induced total, cell surface and nuclear GRP78 expression. A Experimental scheme to purify and detect GRP78 on the cell surface. B HCT116 cells were treated with OLN (35 nM) alone or in combination with Tg (300 nM) for 24 h. The cells were then subjected to the cell surface protein purification procedure outlined in (A). Whole cell lysate (WCL) and cell surface fractions were subjected to Western blot analysis for GRP78 protein level with E-cadherin and GAPDH serving as loading controls for cell surface and total proteins respectively. C Same as in (B) except the cells were subjected to confocal immunofluorescence staining for GRP78 without permeabilization. The nuclei were stained by DAPI in blue. The white arrows indicate GRP78 on the cell surface. D Same as in (C) except the cells were permeabilized and stained for GRP78. The white arrows indicate GRP78 in the nucleus. In both (C) and (D), the scale bars represent 20 μm
Fig. 3
Fig. 3
Oleandrin suppresses GRP78 stress induction at the post-transcriptional level, independent of protein degradation and autophagy. A HCT116 cells were treated with OLN (35 nM) alone or in combination with Tg (300 nM) for 24 h. GRP78 mRNA level was determined by RT-qPCR and its relative level was graphed with β-actin mRNA serving as loading control. B Same as in (A) except MDA-MB-231 cells were used. C HCT116 cells were treated as in (A) and three different proteasome inhibitors MG101 (10 μM), MG115 (10 μM) or MG132 (10 μM) for 24 h. Western blot analysis was performed for GRP78 protein level with β-actin serving as loading control. Quantitation of the relative levels of GRP78 normalized to β-actin are shown in the graphs below. D Same as in (C) except the cells were treated in combination with three different autophagy inhibitors 3-MA (10 mM), Chloroquine (CQ, 20 μM), or Bafilomycin A1 (BafA1, 100 nM). E HEK293T cells were treated with the indicated concentrations of OLN and Tg, alone or in combination for 8 h followed by 30 min incubation with puromycin (4 μg/ml). Western blot for puromycin labeled proteins is shown with β-actin serving as loading control. F Cells were treated with OLN (30 nM) alone or in combination with Tg (300 nM) for 6 h. Cell lysates were sedimented on sucrose gradient followed by fractionation. RNA was extracted from each fraction and subject to RT-qPCR analysis of GRP78 mRNA. The value on the y-axis corresponds to the percentage of total GRP78 mRNA across fractions. Indicated below the fractions are the free ribosomal subunits which consist of the lower fractions (< 5), the 80S monosome, the low polysome fractions 6 to 8, the medium fractions 9 to 11, and the high polysome fractions 12 to 14 (n = 6, 6 technical replicates from two biological experiments). Data are presented as mean ± S.D. *p ≤ 0.05, **p ≤ 0.01, ***p ≤ 0.001, ****p ≤ 0.0001 (Student’s t test)
Fig. 4
Fig. 4
Oleandrin suppresses stress induction of GRP78 requires the human Na+/K+-ATPase α3 isoform. A Mouse embryonic fibroblasts (MEFs) or mouse acinar pancreatic cancer cells 266–6 were treated with 35 nM of OLN alone or in combination with different ER stress inducers Tg (300 nM), Tu (1.78 mM), or 2-DG (10 mM) for 24 h. Whole cell lysates (WCLs) were subjected to Western blot analysis for GRP78 protein level with β-actin serving as loading control. B Relative protein expression levels of the NKA α1 and α3 isoforms in a panel of 3 head and neck cancer cell lines (SCC15, SCC25, and SCC351). Whole cell lysates were analyzed by Western blot with β-actin serving as loading control. C SCC15, SCC25, and SCC351 cells were treated with OLN (from 10 to 100 nM) alone or in combination with Tg (300 nM) for 24 h. WCLs were subjected to Western blot analysis for GRP78 protein level with β-actin serving as loading control. D Relative protein expression levels of the Na+/K+-ATPase α1 (NKA α1) and α3 (NKA α3) isoforms in a panel of 14 different cancer cell lines. Whole cell lysates were analyzed by Western blot with β-actin serving as loading control. E HCT116 cells were transfected with control siRNA (siCtrl) or siRNA targeting the NKA α3 isoform (siα3) for 24 h. The cells were then treated with OLN (35 nM) alone or in combination with Tg (300 nM) for an additional 24 h. WCLs were subjected to Western blot analysis for GRP78 and NKA α3 protein levels with β-actin serving as loading control
Fig. 5
Fig. 5
Oleandrin sensitizes colorectal cancer cells to chemotherapeutic agents and reduces viability of patient-derived organoids. A HCT116 cells were treated with OLN and Tg as indicated for 24 h. Western blot was performed for the cleaved forms of PARP (c-PARP), caspase-3 (c-cas 3), or caspase-7 (c-cas 7) and β-actin. B HCT116 cells were treated with OLN (35 nM) and Tg (300 nM) as indicated for 24 h. Colonies formed after 2 weeks were stained by Coomassie blue and quantitated. Data are presented as mean ± S.D. **p ≤ 0.01, ***p ≤ 0.001 C HCT116 cells were treated with Tg (300 nM), 5-FU (5 μM), Irinotecan (5 μM), Oxaliplatin (1 μM), and OLN (35 nM) as indicated for 24 h. Western blot was performed for the indicated proteins. D HCT116 cells were transfected with the indicated vectors for 24 h, then treated with OLN and Tg (300 nM) as indicated for an additional 24 h. Western blot was performed for the indicated proteins. E LIM1215 Cetuximab-sensitive (WT) and resistant (R4) cells were treated with OLN as indicated for 72 h and probed for GRP78 and β-actin with GRP78 level normalized to β-actin shown below. (F) Cell viability measured by live cell counts using image analysis segmentation with values normalized to 0 nM OLN. Means ± S.D. with non-linear regression best-fit curves were plotted with respective EC50 values noted (n = 6 for 0 nM and n = 3 for all other concentrations). G Representative images of bright field and Hoechst 33342-stained cells treated with OLN for 3 days (Scale bar, 200 μm). (H) Colon cancer patient-derived organoids (PDOs) were treated as indicated and probed for GRP78 and β-actin levels. (I) Maximum projection images of the PDOs treated as indicated (Scale bar, 200 μm). (J) PDOs were treated as indicated and their viability was measured by CellTiter Glo 3D relative luminescence units and quantified as in (F) (n = 5–6 technical replicates)
Fig. 6
Fig. 6
Oleandrin inhibits MDA-MB-231-GFP/Luc tumor xenograft growth and reduces GRP78 protein level in tumor tissues. A MDA-MB-231 cells were treated with increasing concentrations of OLN (from 10 to 100 nM) alone or in combination with Tg (300 nM) for 24 h. WCLs were subjected to Western blot analysis for the cleaved forms of PARP (c-PARP), caspase-3 (c-cas 3), or caspase-7 (c-cas 7) with β-actin serving as loading control. B Schematic illustration of the MDA-MB-231-GFP/Luc breast cancer cells xenograft experiment and treatment conditions. C Tumors formed at the end of DMSO or OLN treatment. Quantification of the tumors volume and weight is shown in the graphs below. D Immunohistochemical staining of the tumor xenograft tissues for GRP78 protein level (Scale bar, 100 μm). E Western blot analysis of tumor xenograft tissues for GRP78, c-PARP, c-cas 3, and c-cas 7 with β-actin serving as loading control. Quantitation of the relative protein levels normalized to β-actin is shown in the graphs below. Data are presented as mean ± S.D. *p ≤ 0.05, **p ≤ 0.01, n.s. denotes not significant. (Student’s t test)
Fig. 7
Fig. 7
Oleandrin blocks infection by SARS-CoV-2 mediated in part via reduction of GRP78. A Vero E6-ACE2 cells were treated with increasing concentrations of OLN for 48 h and probed for GRP78 and β-actin levels. Quantitation of the relative GRP78 protein levels normalized to β-actin is shown in the graph below. B Vero E6-ACE2 cells were treated with increasing concentrations of OLN for 48 or 72 h and cell viability was measured by WST-1 assay. C Confluent monolayers of Vero E6-ACE2 cells in 6-well plates were infected with the wild-type SARS-CoV-2 virus (WA1 strain) and treated with increasing concentrations of OLN for 72 h. The cells were then fixed with 4% formaldehyde and stained with 0.2% crystal violet. The images are representatives of three repeats. Plaques were counted and plotted in the graph on the left (n = 4). Plaque size was measured and expressed relative to DMSO-treated control in the graph on the right (n = 10). D Experimental scheme to test the effect of GRP78 overexpression on SARS-CoV-2 virus production. E Vero E6-ACE2 cells were transfected with pcDNA3 empty vector or vector expressing FLAG-GRP78 (F-GRP78) for 24 h. The cells were then treated with increasing concentrations of OLN for 48 h. WCLs were subjected to Western blot analysis for Flag-tagged and GRP78 proteins levels with β-actin serving as loading control. F Vero E6-ACE2 cells were transfected with pcDNA3 empty vector or vector expressing F-GRP78 for 48 h. The cells were then infected with SARS-CoV-2 for 45 min followed by OLN treatment for 3 days. The level of viruses released into the media were quantified by plaque assay. The relative fold changes of virus release were graphed with the level of virus release in the cells transfected with the pcDNA empty vector set as 1. Data are presented as mean ± S.D. **p ≤ 0.01, ***p ≤ 0.001, ****p ≤ 0.0001 (Student’s t test)
Fig. 8
Fig. 8
Oleandrin blocks infection by SARS-CoV-2 variants and enhances anti-viral therapies. A Confluent monolayers of Vero E6-ACE2 cells in 6-well plates were infected with SARS-CoV-2 Omicron variant and treated with increasing concentrations of OLN as indicated for 72 h. The cells were fixed with 4% formaldehyde and then stained with 0.2% crystal violet. The images are representatives of three repeats. Plaques were counted and plotted in the graph on the left (n = 4). Plaque size was measured and expressed relative to DMSO-treated control in the graph on the right (n = 10). B Experimental scheme to test the effect of OLN on viral release in human lung A549-ACE2 cells. C A549-ACE2 cells were infected with the Omicron variant and treated with increasing concentrations of OLN for 18 h. WCLs were subjected to Western blot analysis for GRP78, Spike, and N protein levels with β-actin serving as loading control. D Same as in C except the titers of released virus were quantified by plaque assay. E Confluent monolayers of Vero E6-ACE2 cells in 6-well plates were infected with SARS-CoV-2 and treated with 15 nM of OLN alone or in combination with 100 nM of Remdesivir (Rem) or 500 nM of Nirmatrelvir (Nirm) for 72 h. At the end of treatment, the cells were fixed with 4% formaldehyde and stained with 0.2% crystal violet. The number of plaques counted was shown on the lower right of the well. F Plaque size from E was measured and expressed relative to DMSO-treated control in the graph on the right (n = 10). Data are presented as mean ± S.D. ***p ≤ 0.001, ****p ≤ 0.0001 (Student’s t test)

References

    1. Ron D, Walter P. Signal integration in the endoplasmic reticulum unfolded protein response. Nat Rev Mol Cell Biol. 2007;8(7):519–29. 10.1038/nrm2199 - DOI - PubMed
    1. Chen X, Cubillos-Ruiz JR. Endoplasmic reticulum stress signals in the tumour and its microenvironment. Nat Rev Cancer. 2021;21(2):71–88. 10.1038/s41568-020-00312-2 - DOI - PMC - PubMed
    1. Tian X, Zhang S, Zhou L, Seyhan AA, Hernandez Borrero L, Zhang Y, et al. Targeting the integrated stress response in cancer therapy. Front Pharmacol. 2021;12: 747837. 10.3389/fphar.2021.747837 - DOI - PMC - PubMed
    1. Luo B, Lee AS. The critical roles of endoplasmic reticulum chaperones and unfolded protein response in tumorigenesis and anticancer therapies. Oncogene. 2013;32(7):805–18. 10.1038/onc.2012.130 - DOI - PMC - PubMed
    1. Wang M, Kaufman RJ. The impact of the endoplasmic reticulum protein-folding environment on cancer development. Nat Rev Cancer. 2014;14(9):581–97. 10.1038/nrc3800 - DOI - PubMed

LinkOut - more resources