

doi: 10.1186/s40035-024-00439-4.
A novel plasma p-tau181 assay as a specific biomarker of tau pathology in Alzheimer's disease
Affiliations
- PMID: 39238067
- PMCID: PMC11375937
- DOI: 10.1186/s40035-024-00439-4
Item in Clipboard
A novel plasma p-tau181 assay as a specific biomarker of tau pathology in Alzheimer's disease
Transl Neurodegener.
.
No abstract available
Conflict of interest statement
Hitoshi Shimada, Ming-Rong Zhang, and Makoto Higuchi hold patents on compounds related to the present report (JP 5422782/EP 12 884 742.3/CA2894994/HK1208672).
Figures
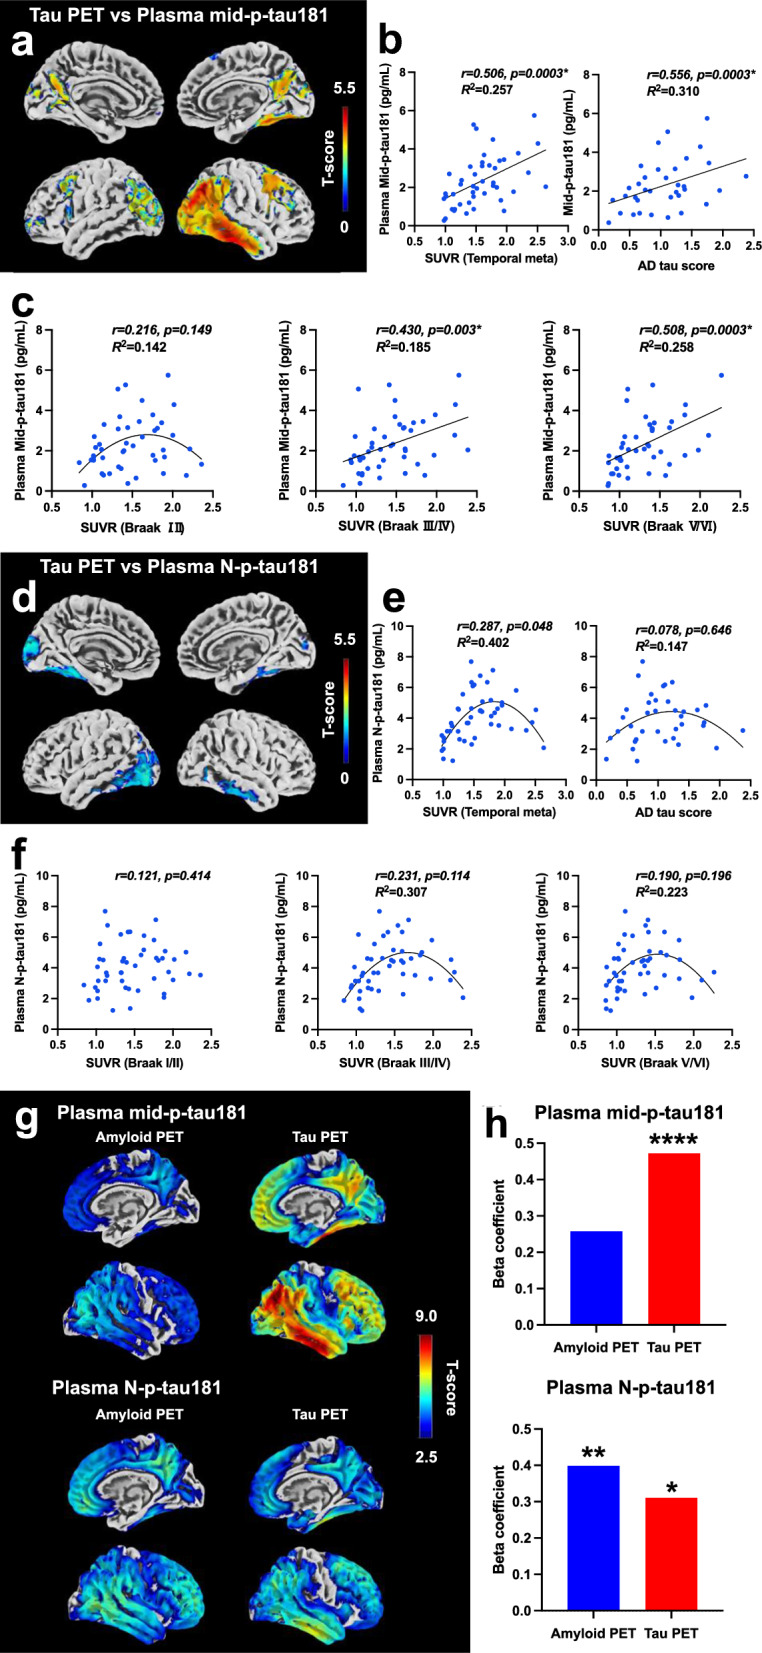
Correlations of plasma mid-p-tau or N-p-tau level with tau or amyloid PET in the subjects with AD continuum. a The correlation between plasma mid-p-tau181 level and 18F-florzorotau tau PET is depicted through its topographical representation (P < 0.05, FWE-corrected). b, c Scatter plots of the correlation between plasma mid-p-tau181 level and tau PET tracer accumulation in each ROI. Pearson's correlation analysis was employed to calculate the r and P values. Statistical significance was established at P < 0.0125, corrected for multiple comparisons using the Bonferroni method. Regression analysis, indicated by a straight or curved line, depicts the preferred model, with its goodness of fit quantified using the R2 value. d Topographical representation of the correlation between plasma N-p-tau181 level and tau PET (P < 0.05, uncorrected). e, f Scatter plots of the correlation between plasma N-p-tau181 level and tau PET tracer accumulation in each ROI. The procedure for the correlation analysis was the same as that in b and c. g Topographical representation of the correlations of each plasma p-tau181 assay with amyloid- (left column) and tau- (right column) PET in the CN and AD continuum cohort (P < 0.05, FWE-corrected). h Bar graphs illustrating beta coefficient values of amyloid and tau PET in multiple liner regression analysis with each p-tau assay. *P < 0.05, **P < 0.005, ****P < 0.0005. P-values were corrected for multiple comparisons using Bonferonni correction with the number of explanatory variables
References
Publication types
MeSH terms
Substances
Grants and funding
- JP18dm0207018/Japan Agency for Medical Research and Development
- JP19dm0207072/Japan Agency for Medical Research and Development
- JP18dk0207026/Japan Agency for Medical Research and Development
- JP19dk0207049/Japan Agency for Medical Research and Development
- 21wm0425015/Japan Agency for Medical Research and Development
LinkOut - more resources
Full Text Sources
Medical
