Multi-omics Analysis to Identify Key Immune Genes for Osteoporosis based on Machine Learning and Single-cell Analysis
- PMID: 39238187
- PMCID: PMC11541141
- DOI: 10.1111/os.14172
Multi-omics Analysis to Identify Key Immune Genes for Osteoporosis based on Machine Learning and Single-cell Analysis
Abstract
Objective: Osteoporosis is a severe bone disease with a complex pathogenesis involving various immune processes. With the in-depth understanding of bone immune mechanisms, discovering new therapeutic targets is crucial for the prevention and treatment of osteoporosis. This study aims to explore novel bone immune markers related to osteoporosis based on single-cell and transcriptome data, utilizing bioinformatics and machine learning methods, in order to provide novel strategies for the diagnosis and treatment of the disease.
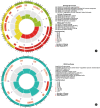
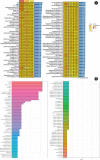
Methods: Single cell and transcriptome data sets were acquired from Gene Expression Omnibus (GEO). The data was then subjected to cell communication analysis, pseudotime analysis, and high dimensional WGCNA (hdWGCNA) analysis to identify key immune cell subpopulations and module genes. Subsequently, ConsensusClusterPlus analysis was performed on the key module genes to identify different diseased subgroups in the osteoporosis (OP) training set samples. The immune characteristics between subgroups were evaluated using Cibersort, EPIC, and MCP counter algorithms. OP's hub genes were screened using 10 machine learning algorithms and 113 algorithm combinations. The relationship between hub genes and immunity and pathways was established by evaluating the immune and pathway scores of the training set samples through the ESTIMATE, MCP-counter, and ssGSEA algorithms. Real-time fluorescence quantitative PCR (RT-qPCR) testing was conducted on serum samples collected from osteoporosis patients and healthy adults.
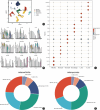
Results: In OP samples, the proportions of bone marrow-derived mesenchymal stem cells (BM-MSCs) and neutrophils increased significantly by 6.73% (from 24.01% to 30.74%) and 6.36% (from 26.82% to 33.18%), respectively. We found 16 intersection genes and four hub genes (DND1, HIRA, SH3GLB2, and F7). RT-qPCR results showed reduced expression levels of DND1, HIRA, and SH3GLB2 in clinical blood samples of OP patients. Moreover, the four hub genes showed positive correlations with neutrophils (0.65-0.90), immature B cells (0.76-0.92), and endothelial cells (0.79-0.87), while showing negative correlations with myeloid-derived suppressor cells (negative 0.54-0.73), T follicular helper cells (negative 0.71-0.86), and natural killer T cells (negative 0.75-0.85).
Conclusion: Neutrophils play a crucial role in the occurrence and development of osteoporosis. The four hub genes potentially inhibit metabolic activities and trigger inflammation by interacting with other immune cells, thereby significantly contributing to the onset and diagnosis of OP.
Keywords: Bioinformatics; Immunology; Machine learning; Osteoporosis; Single cells analysis.
© 2024 The Author(s). Orthopaedic Surgery published by Tianjin Hospital and John Wiley & Sons Australia, Ltd.
Conflict of interest statement
The authors declare no conflict of interest. All authors have reached consensus and agreed to publish.
Figures


References
MeSH terms
Grants and funding
- 2022YFC3601900/National Key Research and Development Program of China
- 22JCZDJC00340/Tianjin Science and Technology Bureau Key Projects
- QNLC-20200030/Inner Mongolia Medical University Youth Leader Creates "Bone to Tendon" Mission Group
- 2021GG0174/Science and Technology Planning Project of Inner Mongolia Science and Technology Department
- 2022YFSH0022/Science and Technology Planning Project of Inner Mongolia Science and Technology Department
- 2022YFSH0020/Science and Technology Planning Project of Inner Mongolia Science and Technology Department
- 2020GG0195/Science and Technology Planning Project of Inner Mongolia Science and Technology Department
- 2022YFSH0021/Science and Technology Planning Project of Inner Mongolia Science and Technology Department
- 2022YFSH0024/Science and Technology Planning Project of Inner Mongolia Science and Technology Department
- NJZZ22665/Inner Mongolia Education Department Project
- YKD2020QNCX001/Inner Mongolia Medical University School Program
- 82304976/National Natural Science Foundation of China (General Program)
LinkOut - more resources
Full Text Sources
Medical
Miscellaneous

